")

")


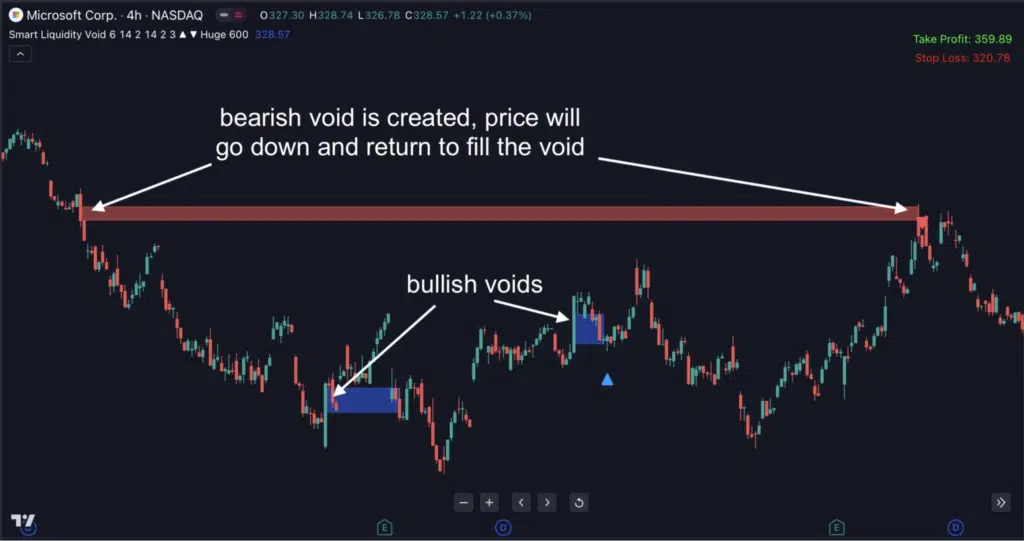
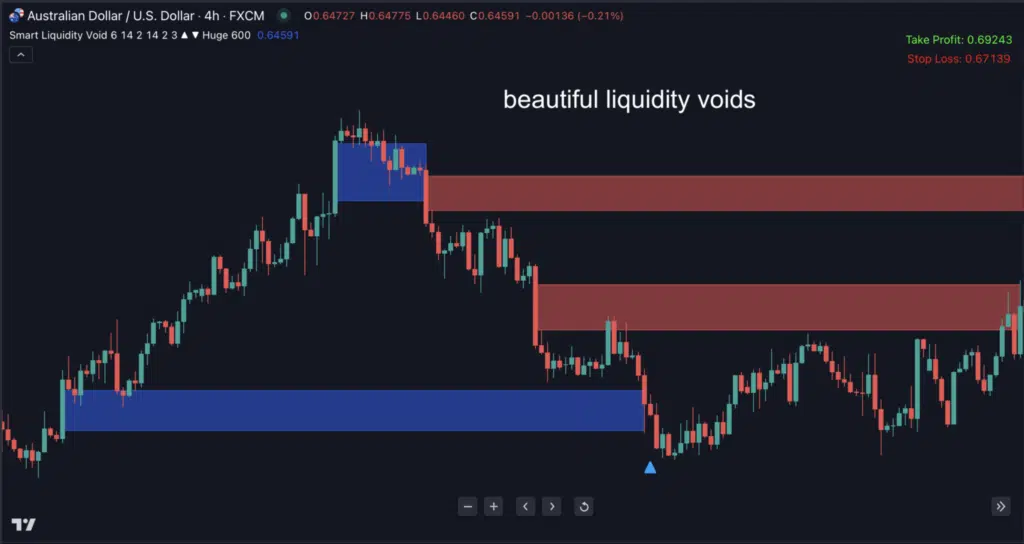
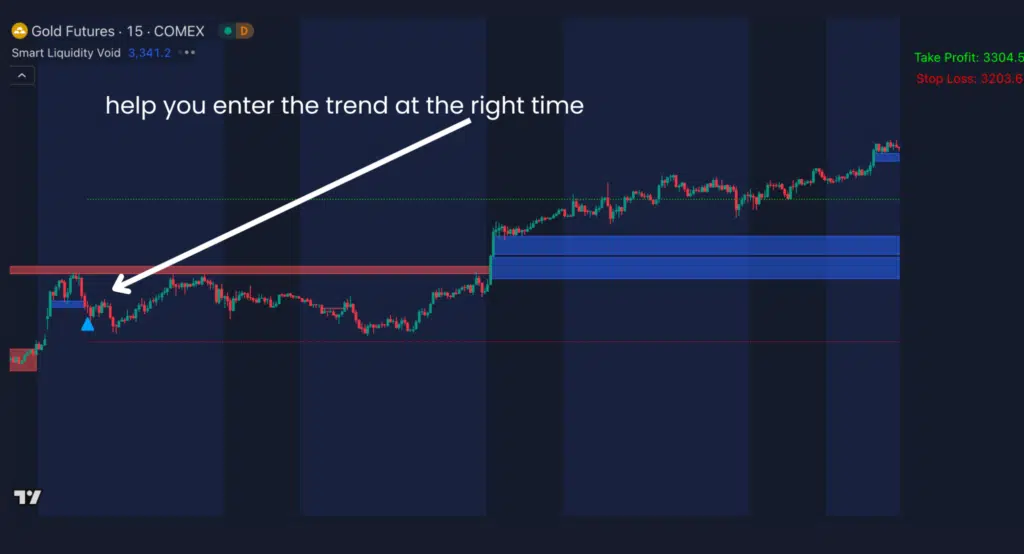
Smart Liquidity Void for TradingView
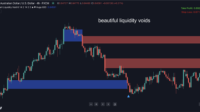
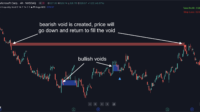
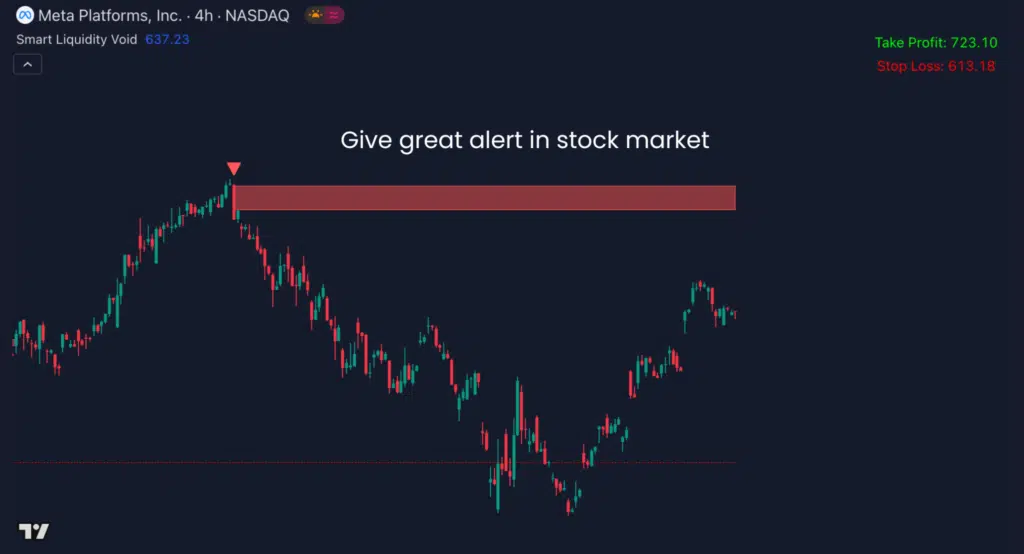
✅ Unlock Liquidity Voids’ Power: Spot Market Imbalances and Seize Trading Opportunities
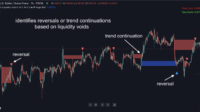
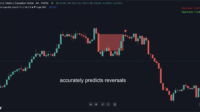
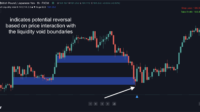
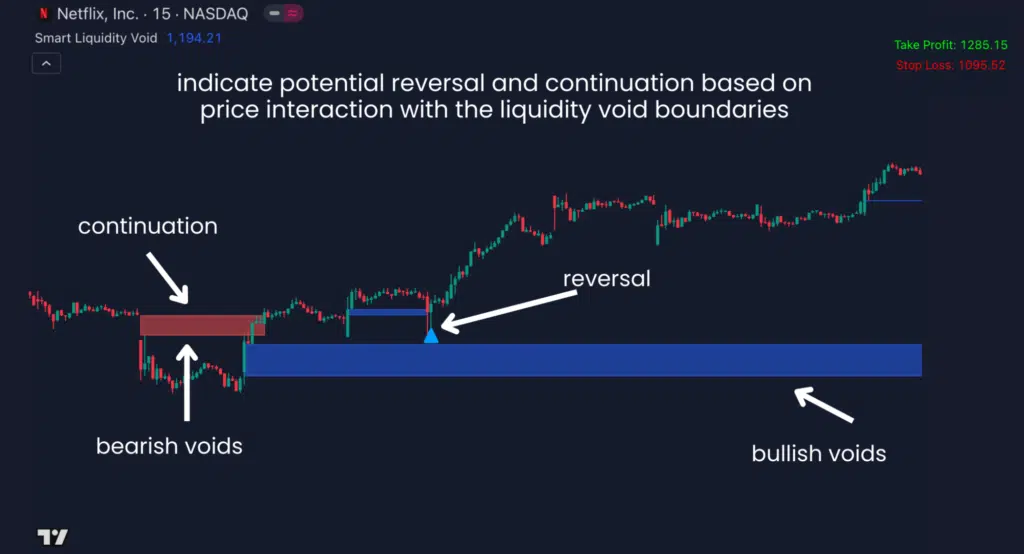
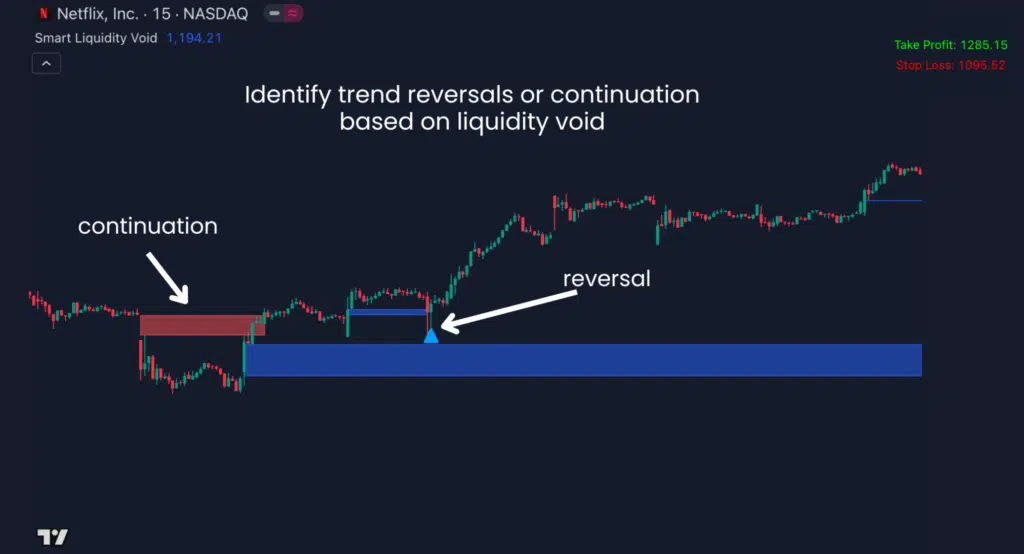
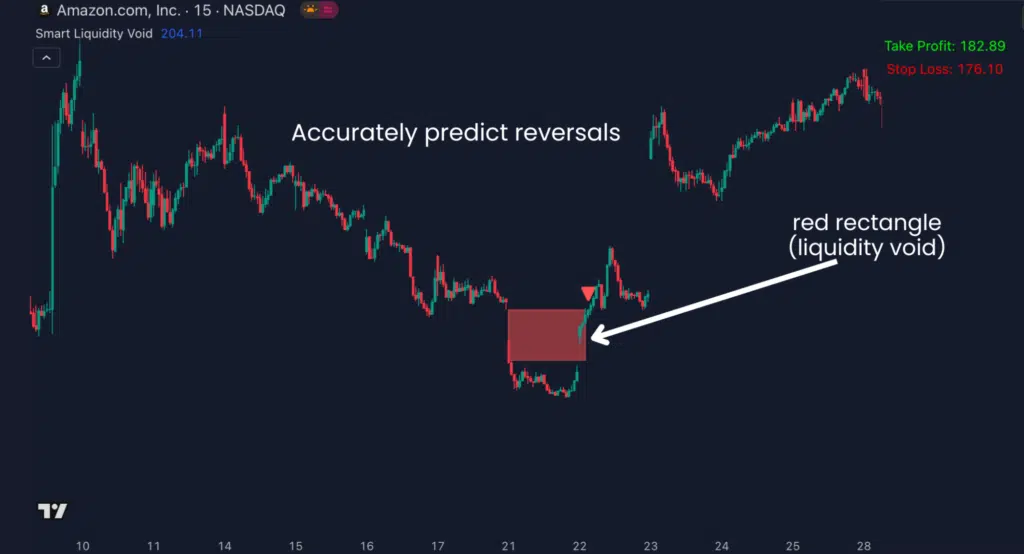
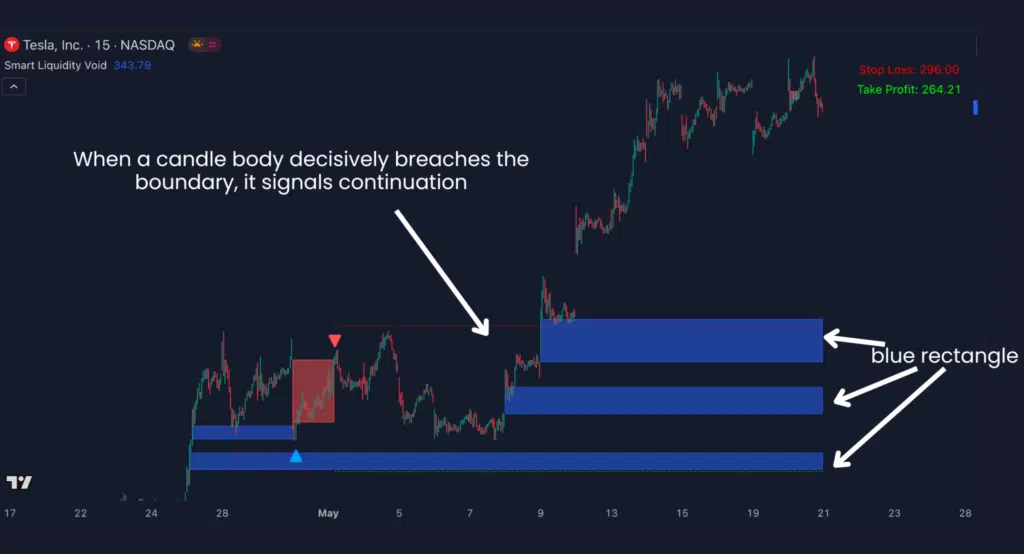
✅ Predict Reversals or Continuations: No more guessing! It analyzes price movements and liquidity voids to predict with high accuracy whether the market will reverse or continue its trend
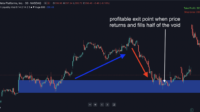
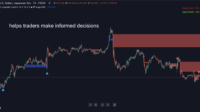
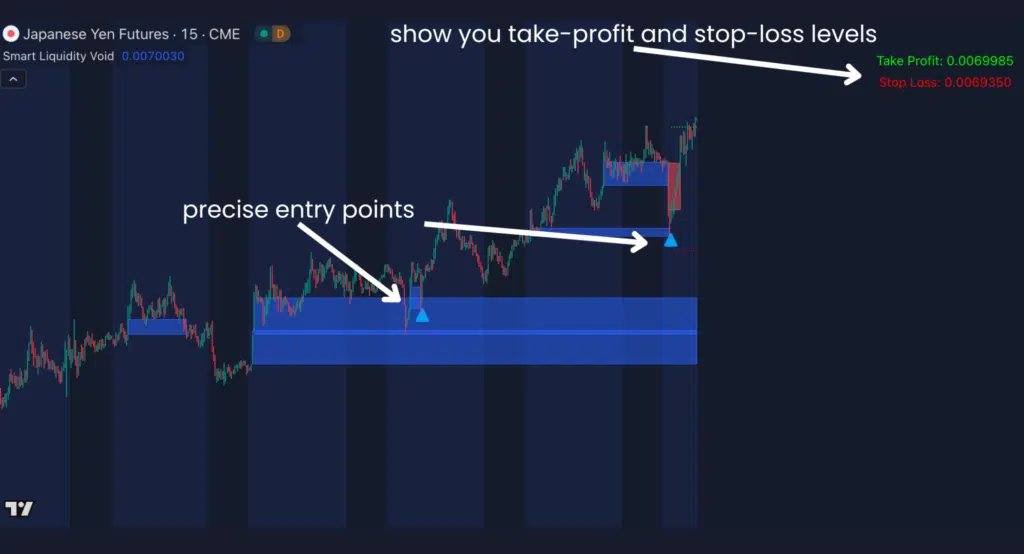
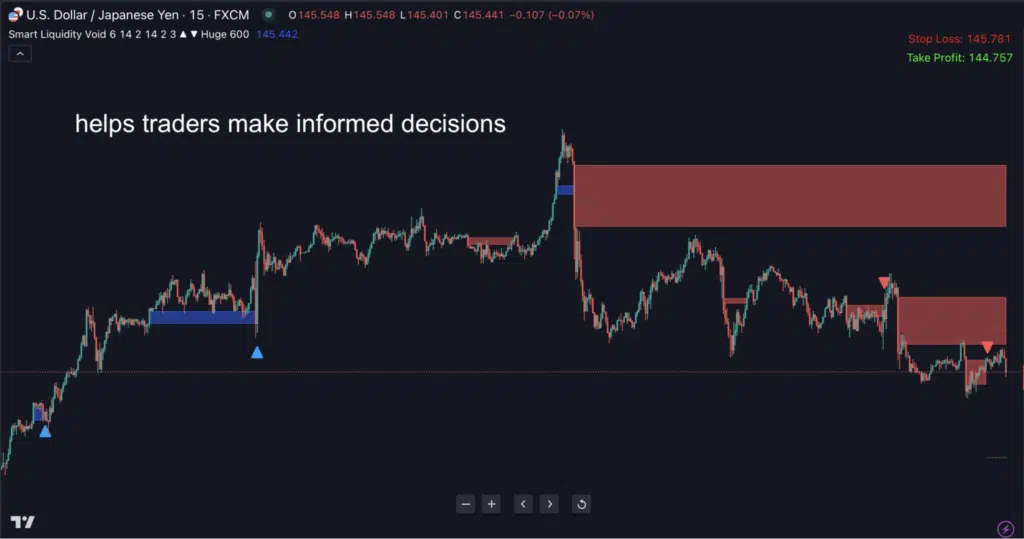
✅ Effortless Trading Decisions: Entry, Exit, and Profit Levels Made Simple!
$299.00


Smart Liquidity Void for TradingView
One-time payment. Lifetime access.