Learn everything about divergence trading, including bullish divergence, bearish divergence, regular and hidden divergence, and how to trade momentum shifts effectively. Discover the limitations of traditional divergence tools, and how the Natural Divergence indicator solves them with early detection, smart filtering and automatic market scanning.
Table of Contents
1. What is divergence trading?
Divergence trading is a method used by traders to anticipate trend reversals or potential continuations by comparing the movement of price to the movement of momentum. When price moves in one direction momentum shifts in another, the market is often signaling that the existing trend is losing strength.
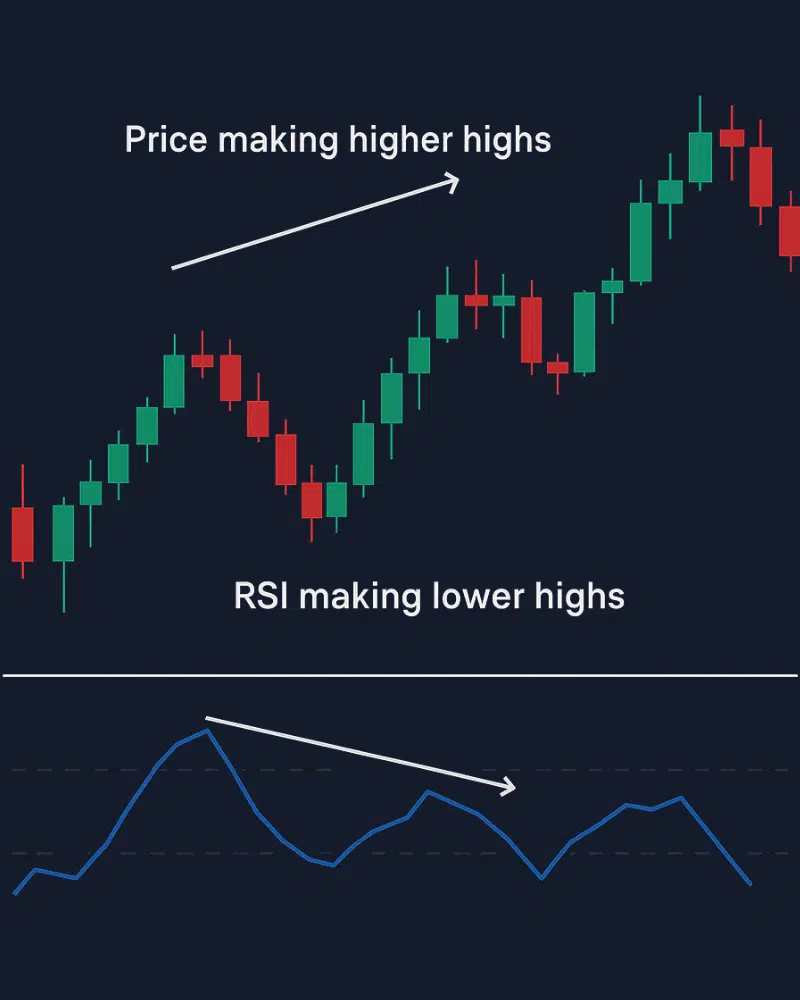
For example, if price is pushing higher but momentum is weakening, the uptrend may be close to ending. Likewise, if price is falling but momentum is rising, selling pressure may be fading and a bullish reversal could be forming. This price-momentum imbalance is what traders call divergence.
Divergence trading is popular because it offers early clues about market turning points. However, traditional divergence indicators such as RSI, MACD, or Stochastic often detect these signals far too late. Their calculations rely heavily on lagging data, which means traders frequently miss the earliest stage of the move or enter after most of the opportunity has already been taken.
Understanding how divergence works and the weaknesses of traditional tools, is essential for trading momentum effectively.
2. What are types of divergence?
There are two primary types of divergence that traders use to predict market psychology. The first type suggests potential trend reversals, while the second type indicates continuation of the existing trend.
2.1. Regular divergence
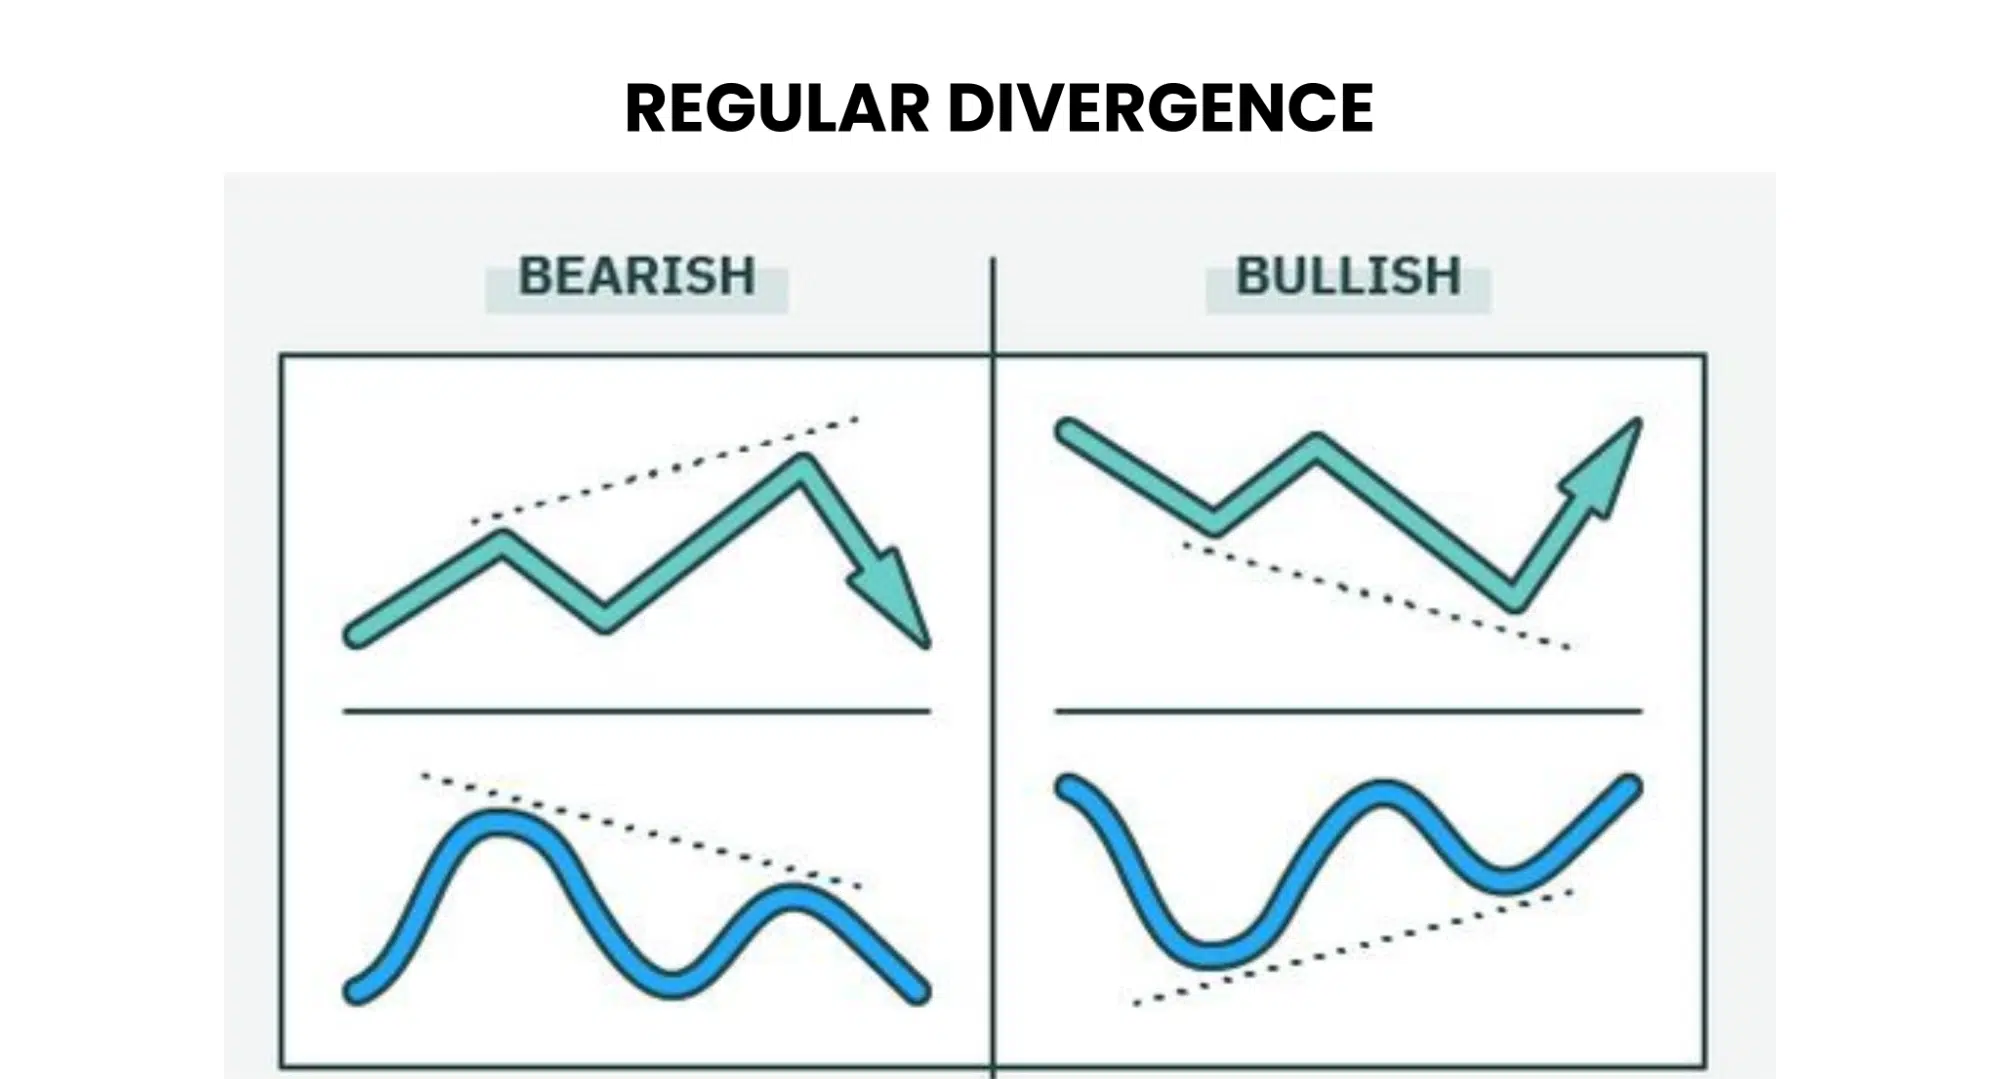
Regular divergence is the most familiar form and is known for signaling trend reversals.
A bullish regular divergence appears when price makes lower lows while momentum makes higher lows. This pattern often indicates that sellers are becoming exhausted and that a bullish reversal may soon follow.
A bearish regular divergence appears when price makes higher highs while momentum makes lower highs. This suggests weakening buying pressure and a potential bearish reversal ahead.
Regular divergence is widely used because it helps traders enter before a new trend builds strength, but only if the divergence is detected early enough.
2.2. Hidden divergence

Hidden divergence signals the continuation of an existing trend, rather than a reversal.
A bullish hidden occurs when price forms higher lows while momentum forms lower lows. This typically indicates that despite a temporary pullback, buyers remain in control and the uptrend may continue.
A bearish hidden divergence occurs when price forms lower highs while momentum forms higher highs. This often shows that sellers remain firmly in control, and the downtrend is likely to continue.
Hidden divergence is extremely useful for entering strong trends at optimal pullback levels, where the risk-to-reward ratio is often much more favorable.
3. How to trade the divergence?
Trading divergence typically follows a methodical process:
Step 1: Identify the divergence
The trader begins by comparing the swing highs and lows of price with the corresponding swings on a momentum indicator to detect any divergence.

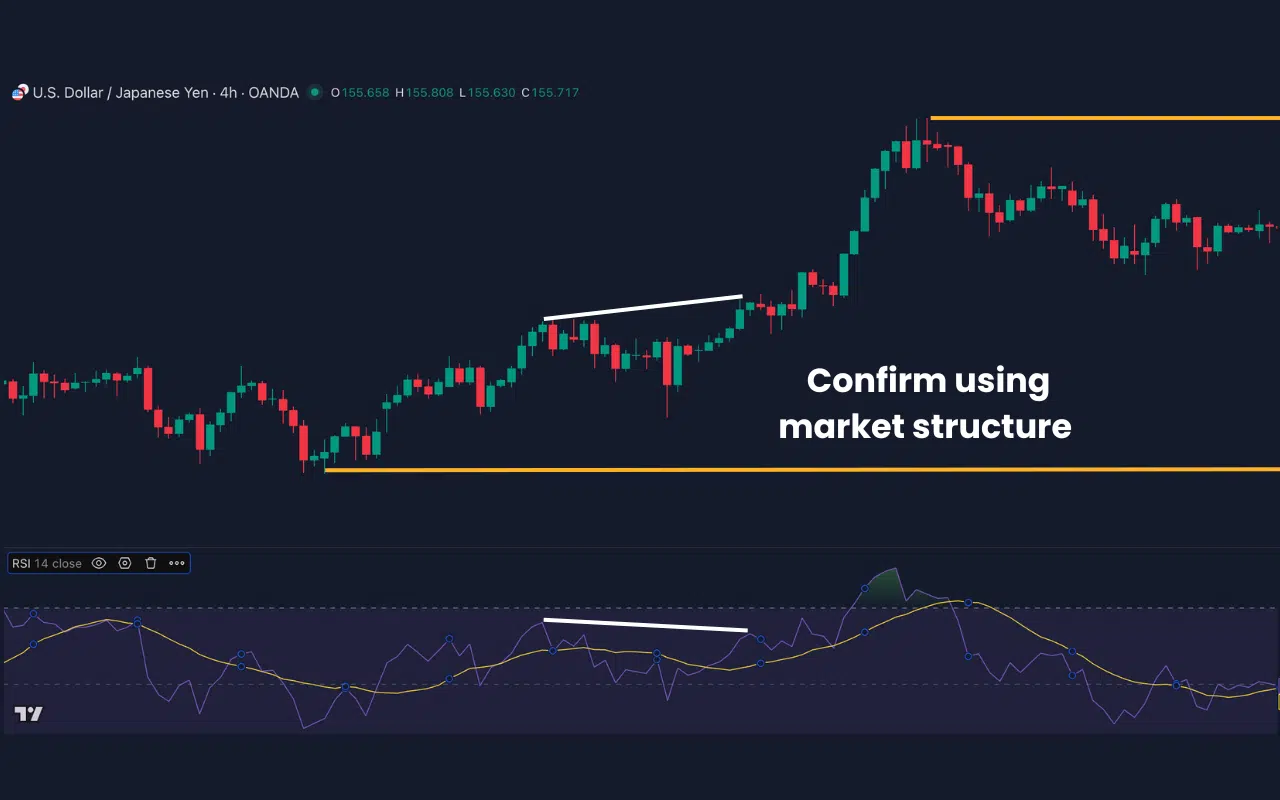
Step 2: Confirm using market structure
After identifying potential divergence, the trader validates the signal by examining broader market conditions such as trendlines, support and resistance level, supply and demand zones, or chart patterns.
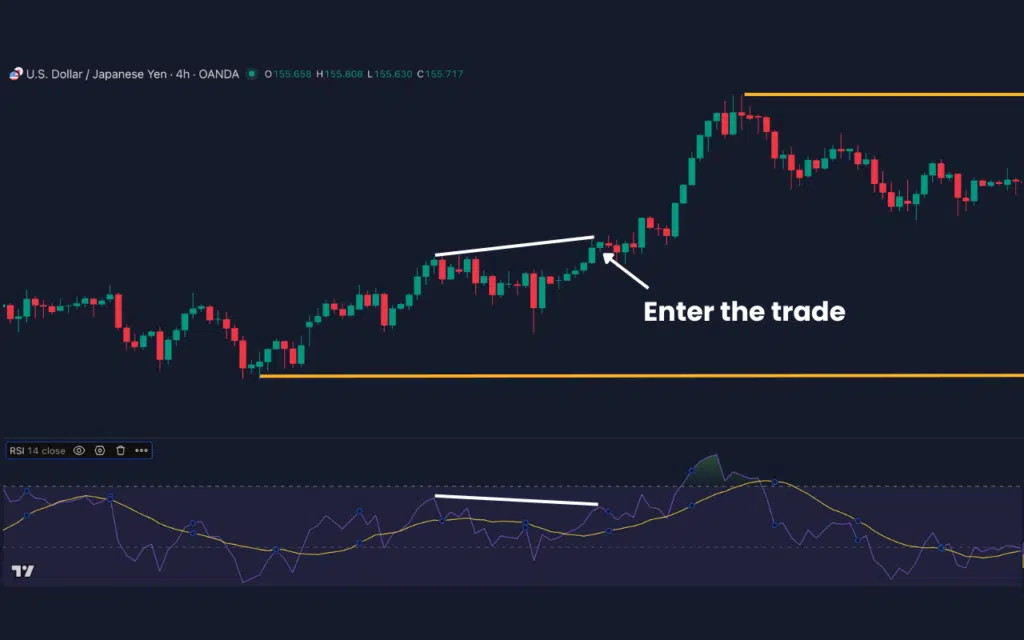
Step 3: Enter the trade
Once the setup is confirmed many traders choose to enter on the open of the next candle following the divergence signal.
Step 4: Set a stop-loss
Stop-loss placement typically goes below the most recent swing low for bullish trades or above the most recent swing high for bearish trades.
Step 5: Define a take-profit target
Profit targets may be set at the next major structural level, determined by a fixed risk-to-reward ratio, or aligned with specific momentum thresholds.
Step 6: Acknowledge the practical challenges
While divergence trading can be highly effective, manually identifying divergence across multiple markets and timeframes, and separating high-quality signals from weak ones, remains a significant challenge for many traders.
4. What are the limitations of divergence trading?
Although divergence trading is powerful, it has several major drawbacks when done with standard tools.
- Lagging signals:
RSI, MACD and Stochastic react slowly to market conditions. By the time they show divergence, the most profitable part of the move may already be gone.
- High volume of false setups
In sideways or volatile markets, divergence appears constantly, making it difficult to filter meaningful signals from noise.
- Manual chart scanning is inefficient
Traders miss opportunities simply because they cannot monitor every market, timeframe, or instrument simultaneously.
- Over-sensitivity to minor swings
Most divergence tools mark every small swing as a signal, even if momentum behind it is weak. This leads to confusion, hesitation, and the dreaded divergence trap. These limitations explain why divergence trading often underperforms, not because the concept is flawed but because the detection tools are outdated.
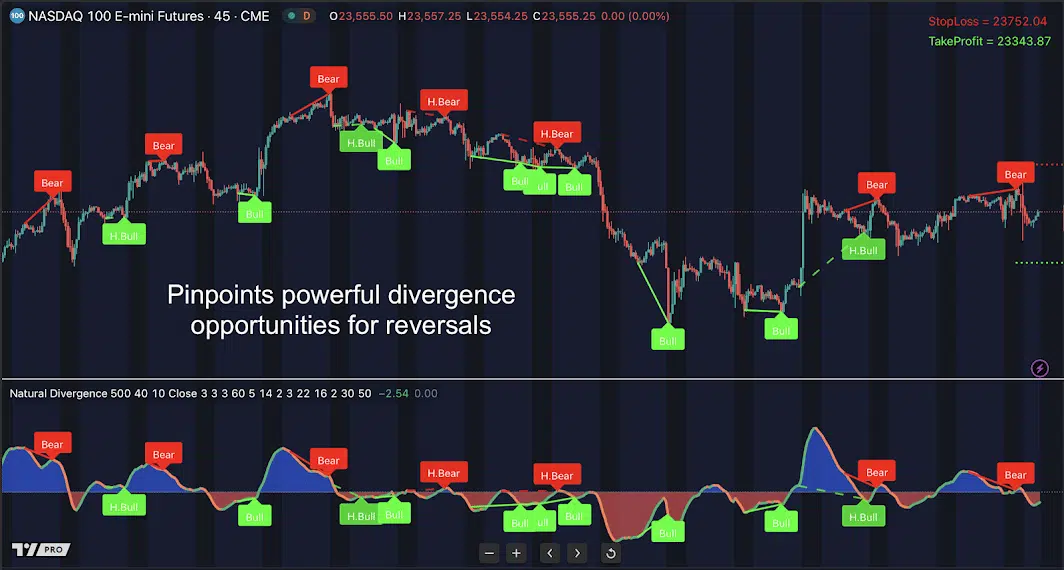
5. Forget divergence trap, automatically scan the market for high-probability divergences with Natural Divergence indicator
The Natural Divergence indicator for Tradingview fully solves the problems that traditional divergence tools create. Built on the proven Natural Momentum algorithm, this indicator was engineered specifically for early detection, intelligent filtering, and real-time scanning across any market and timeframe.
Why Natural Divergence is a game-changer:
- Detect divergence 5-15 bars earlier
- Filter our weak or low-quality divergences
- Automatically scan all swings
- Works on all markets and timeframes
The Natural Divergence indicator works across all markets, including Forex, stocks indices, commodities and cryptocurrency. It supports every timeframe from one minute to monthly charts, making it suitable for scalpers, day traders, swing traders, and long-term investors.
For traders who rely on momentum analysis and want to avoid divergence traps while capturing reversals early, Natural Divergence provides a serious competitive advantage.
6. The bottom line
Divergence trading is one of the most reliable methods for identifying both trend reversals and continuations. Yet traditional divergence indicators are limited by lag, noise and a lack of filtering power.
The Natural Divergence indicator eliminates these limitations by providing early divergence detection, clean visualization, advanced filtering, and full automation across all markets and timeframes. For traders who want to trade momentum accurately and avoid divergence traps, this tool offers a significant edge.
When you are ready to improve your divergence trading and gain earlier, clearer, and more reliable signals, explore the Natural Divergence indicator for Tradingview. It brings the accuracy and speed that standard indicators simply cannot match.