Table of Contents
Supply and demand zones are some of the most sensitive chart regions top technical analysts exploit for max gains. Learn how to use them like a pro today.
1. Introduction
The law of supply and demand has shaped markets for centuries and in modern trading, it’s the foundation of countless profitable strategies.
For technical traders, mastering supply and demand zone trading is a game changer. These zones reveal where institutional money is likely to step in, creating high-probability reversal or continuation opportunities.
In this guide, we’ll break down how to identify, analyze, and trade supply-demand zones effectively, plus introduce a top-tier tool that makes it all effortless: Supply Demand Pro for Tradingview.
2. Employing Supply and Demand Zones in Technical Analysis
As its core, technical analysis reflects the constant tug of war between buyers and sellers. When demand for an asset rises, prices follows; when supply increases, price falls.
With increased interest (demand) in tradable assets, the price typically rises (with all other factors being equal). Conversely, when the consensus is to sell, the supply increases, culminating in price falls.
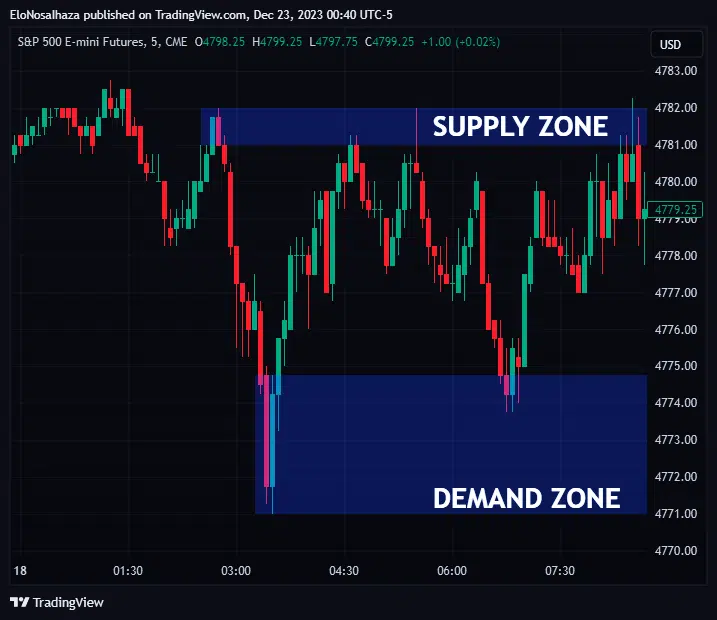
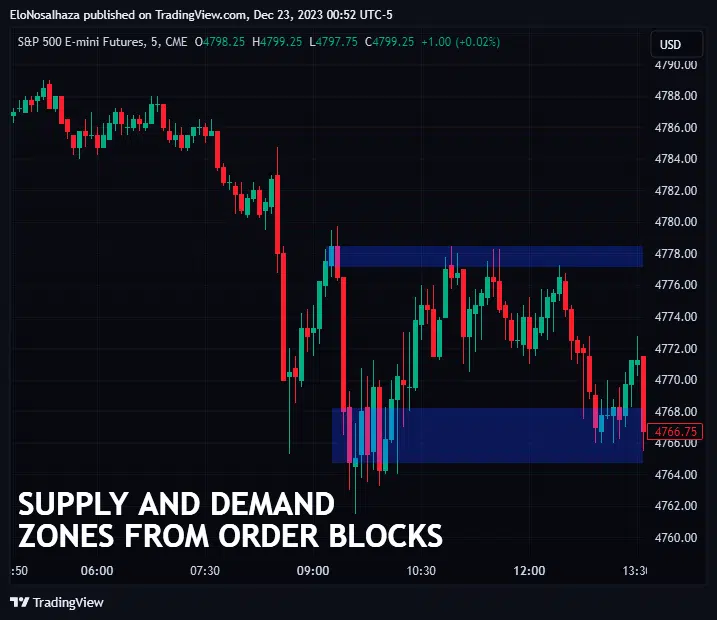
That’s why supply and demand zones are so powerful. They highlight areas where price has previously reversed due to an imbalance, where supply overwhelmed demand, or vice versa.
In essence, these zones act like advanced support and resistance levels. Identifying them correctly gives technical analysts a real edge: pinpointing where large traders are likely to enter or exit positions.
3. Practical Methods to Identify Strong Supply and Demand Zones
Unlike fundamental traders, who focus on macro data, technical traders rely on the chart itself to locate potential supply-demand zones. Here are some proven methods:
Method 1: Volume Analysis
Volume tells the story of trader participation.
High trading volume often aligns with strong supply-demand zones, signaling areas where market sentiment shifts.
When price revisits a high-volume zone, technical traders prepare for possible reversals, expecting institutional players to defend those levels.
Understanding volume representation on your platform is key. Misreading volume data can lead to false conclusions and poor trading timing.
Traders can view high-volume areas as potential supply-demand zones.
As market price gravitates toward them, traders prepare to counter-trend trade in hopes of a prolonged reversal.
This strategy primarily demands proper comprehension of the volume representation in one’s preferred platform. Misunderstandings will affect the results.
Method 2: Price action assessment
Price action reveals the footprints of supply and demand.
Sharp price swings, large wicks, or consolidation before breakouts often indicate hidden supply or demand zones.
They indicate areas where market price should react to for the first time or may have reversed in the past.
For example, an extended wick rejecting higher prices might mark a supply zone, while a long lower wick could identify strong demand.
These patterns show where price has reacted before, and likely will again. Mastering price action is essential for every technical analyst aiming to trade zones effectively.
Method 3: Fibonacci Levels
The Fibonacci retracement tool is another powerful ally for supply and demand zone trading. Common Fibonacci ratios like 38,2 %, 61,8% and 78,6% often align with key supply-demand zones, offering highly accurate entry and exit levels.
Combining Fibonacci with price action and volume analysis can drastically increase your probability of success.
Method 4: Indicator Signals
Technical indicators can confirm or filter supply-demand zones.
Popular choices include the Moving Average, MACD, and RSI.
For instance:
- When candlesticks interact with the Moving Average, it can signal momentum shifts.
- An RSI crossing out of overbought or oversold regions often coincides with supply or demand zones reversals.
By blending these signals with your zone analysis, you create a stronger, data-driven confirmation system.
4. Bossing Supply and Demand Trading With a Top-Tier Technical Tool
Knowing how to spot supply and demand zones is valuable but doing it consistently in real time is what separates professionals from amateurs.
That’s where the Supply Demand Pro indicator for Tradingview comes in.
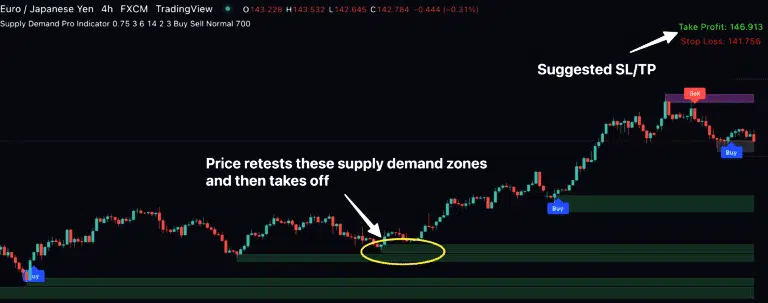
Supply Demand Pro automates the identification of the strongest supply-demand zones, removing guesswork and saving hours of manual charting.
With this tool, you can:
- Instantly see high-probability reversal zones
- Understand market structure with visual clarity
- Take long or short trades with precise entry and exit awareness
- Receive real-time Tradingview alerts for every setups
Whether you’re a day trader, swing trader or technical analyst, Supply Demand Pro helps you trade with the same precision institutional traders rely on.
5. Conclusion
Supply and demand zone trading remains one of the most powerful and time-tested approaches in technical analysis.
By identifying high-quality supply-demand zones through volume analysis, price action, Fibonacci levels, or indicator confirmation, traders can position themselves ahead of the crowd.
And with Supply Demand Pro, you don’t just find zones, you trade them confidently, with data backed accuracy.