Many traders feel like they’ve missed an opportunity when an asset is rising quickly. That’s where pullback trading becomes powerful. Instead of chasing price, pullback trading allows traders and investors to enter when the asset’s price temporarily declines but still maintains a strong uptrend. Such situations form the foundation of pullback trading strategies.
Table of Contents
1. What is a Pullback?
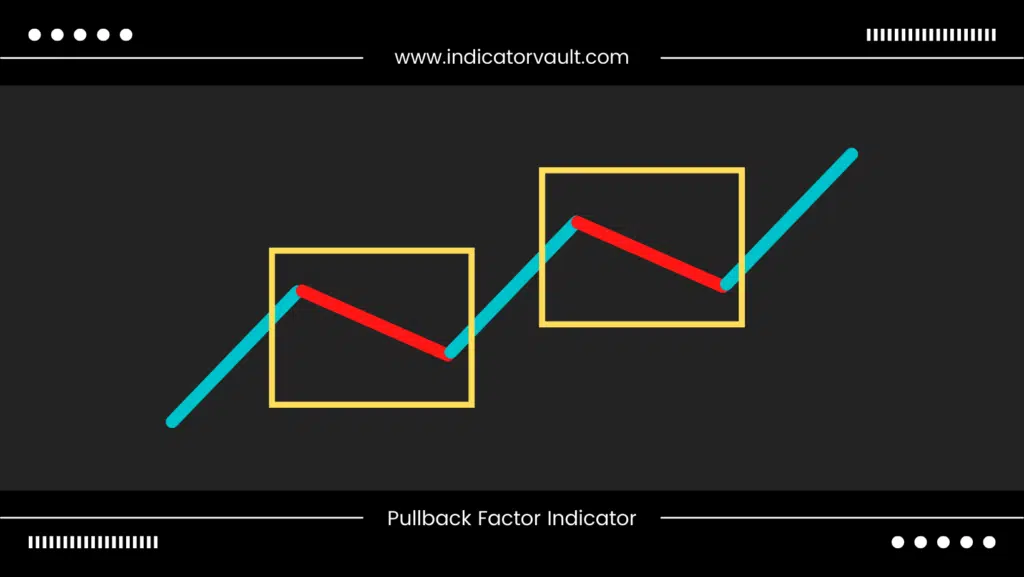
A pullback is a pause or slight decline from recent peaks in an asset or security pricing chart that takes place during an uptrend. This phrase is typically used to describe price declines that last only a few successive sessions before the uptrend returns.
There are two technical terms that are similar to pullback: retracement and consolidation. While a retracement is considered a minor pullback, consolidation describes a prolonged pause before the uptrend resumes. These two terms can also be used interchangeably with the term.
2. What Can Pullback Trading Tell You About Market Moves?
A pullback tells you that a temporary suspension is happening in the overall market movement. This might be caused by a number of things, such as a brief decline in trader confidence following certain economic announcements. But most of the time, it is because traders take profit after a positive earnings report.
In both situations, traders will mostly try to sell the asset, which leads to a decrease or pause in the asset’s price. However, as long as the underlying trend is a constant rise, the price will increase again. A positive earnings announcement, on the other hand, is also a fundamental signal that predicts the uptrend will continue.
As you can see, you may acquire an asset at a lower price during its pullback period, and if it is correct and the asset’s value resumes its upward direction, you can profit from it. Pullbacks are therefore often viewed as fantastic buying opportunities and are widely used in pullback trading strategies.
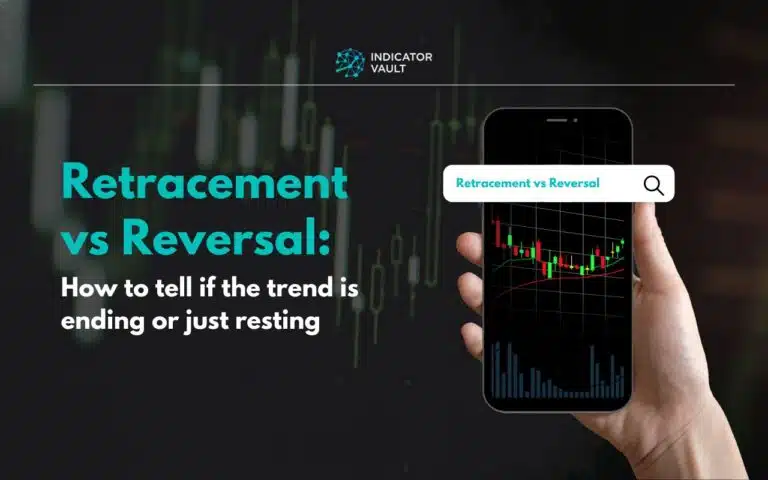
3. Pullback and Reversal - What's the difference?
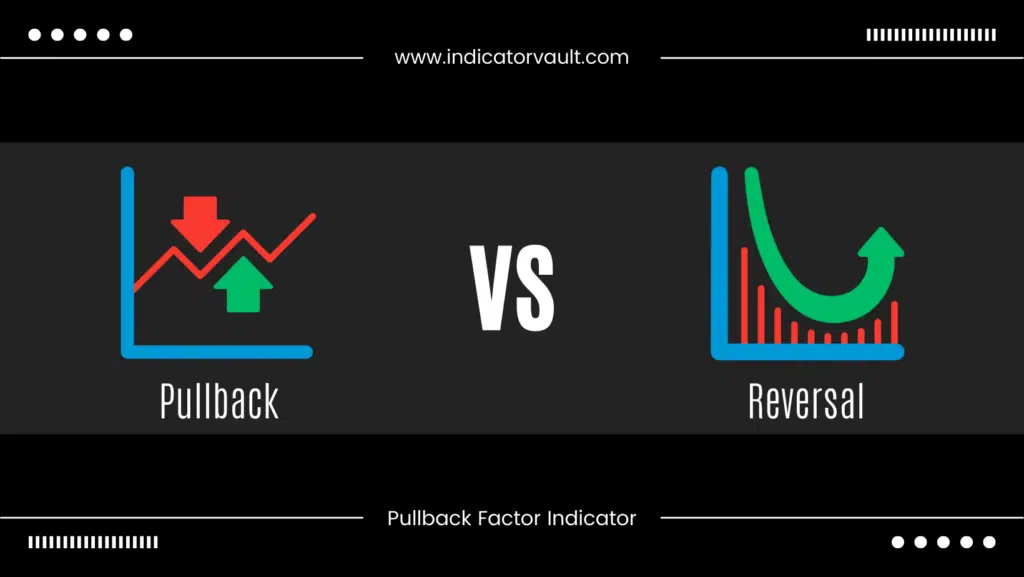
Since both go against the primary trend, you may mistake one for the other, or worse, wrongly predict the behavior of the price. A pullback only lasts for a short moment before returning to its previous behavior. A reversal, however, is the shifting of the trend, meaning that the underlying trend has reversed and will continue for a long period.
If you can tell the difference between the two, your trade can come with great profitability, otherwise, you risk suffering a significant loss. However, while it is simple to spot these tendencies on a price graph after they have happened, it may be quite challenging to be certain right away.
4. What to do during a pullback?
Now you have understood the meaning, I guess you would like to know how to trade profitably with pullbacks. The goal of pullback trading is to trade in the direction of the underlying trend while entering the market with the least amount of risk. There are two main ways to trade that come with different risk-reward ratios.
The first approach is to enter a trade right away when the price returns to the it. A trader must decide where to enter in order to do this. The other approach you can do is to wait for a confirmation of the price continuing the trend structure which is safer as the reversal is less likely to happen.
Whatever strategy is used, it certainly focuses on capturing the best spot to enter the trade, whether it is to gain a bigger profit or reduce risk. Therefore, the major drawback of pullback trading is that you are unsure about the optimal time or price to enter a trade.
5. A perfect solution to all the problems
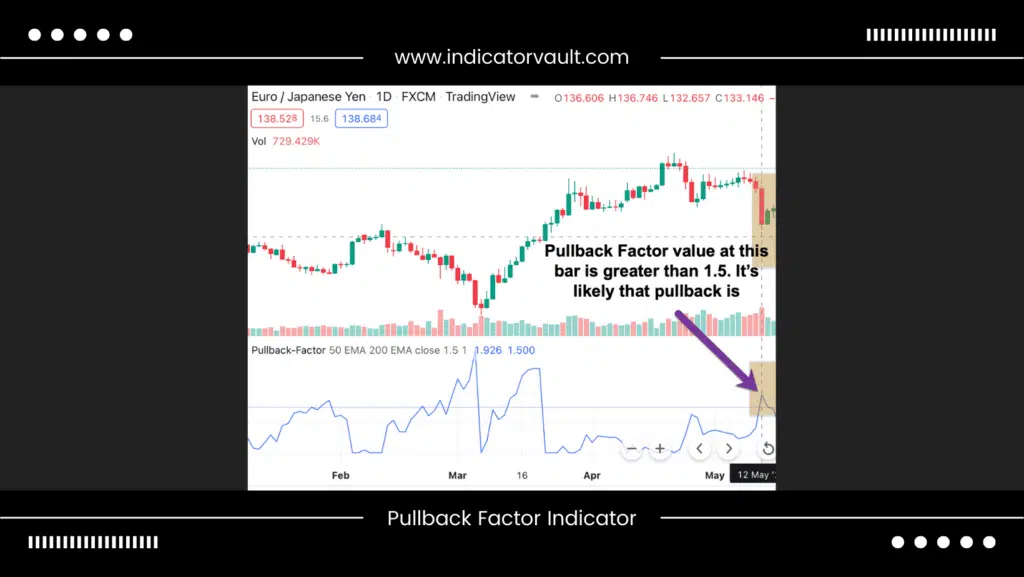
Despite your best predictions, a pullback might go against you. So what’s the solution to this? Unquestionably, a customized indicator is among the greatest options. Let me introduce to you the: Pullback Factor for TradingView developed by Indicator Vault.
This indicator used a volatility-based algorithm to identify whether or not the current pullback is about to end. Once implemented, you can check the Pullback Factor indicator VALUE and presumably predict when it will cease. Simply keep an eye on the value and start trading once it peaks at a specific level.
For traders applying pullback trading, this tool can help identify when the temporary price decline is likely to finish. Finally, it is applicable to any market and any timeframes.
6. Conclusion
If you wish to trade pullbacks, success depends on your ability to recognize the proper ones and when to enter trades. Without the rightful tool, your prediction might be incorrect and result in a significant loss.
Pullback Factor for TradingView can help you with pullback trading from start to finish. You can accurately predict when the it will end by examining the value displayed by the indicator. Find out more about this indicator with this complete guide HERE.
Also, follow us for all the promotions and other useful topics:
- Facebook: www.facebook.com/indicatorvault
- Instagram: www.instagram.com/indicator.vault
- Youtube: www.youtube.com/c/IndicatorVault