Learn how to use moving averages in trading with this simple guide for beginners. Understand the difference between SMA, EMA, and WMA to spot trends and get better signals.
Ever look at a trading chart and see those lines snaking through the candles?
That’s a moving average, and it’s one of the most useful tools a trader can use. This guide will show you exactly what it is, what it does, and how you can use it to get better at trading.
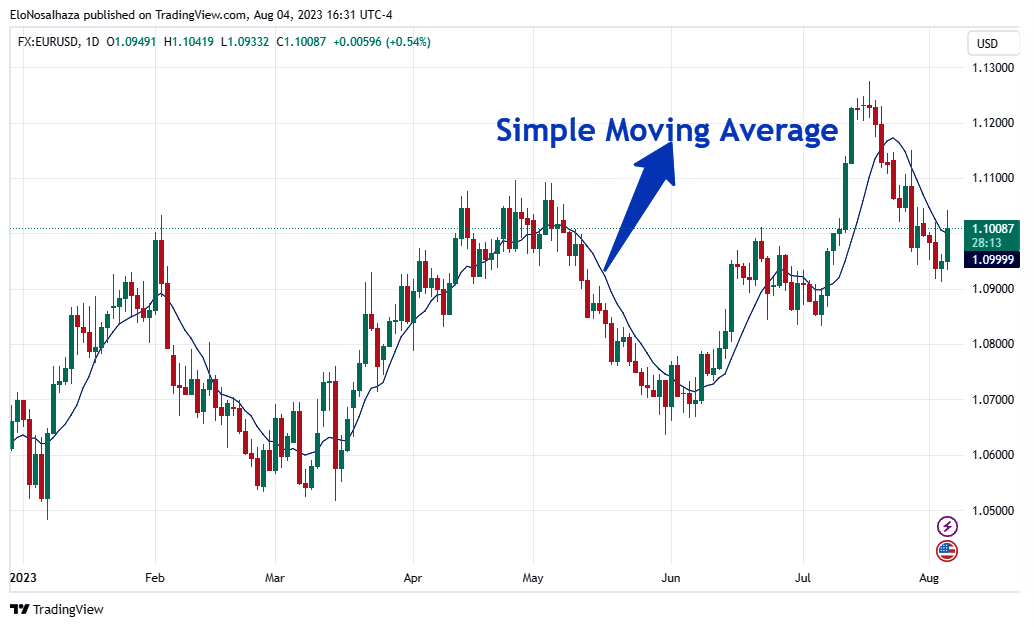
Think of a moving average as a way to smooth out a bumpy road. On a price chart, prices can jump up and down all the time. A moving average takes the average price over a certain time period, like the last 20 days, and draws a single, smooth line.
This line helps you see the real direction of the market by ignoring all the daily ups and downs.
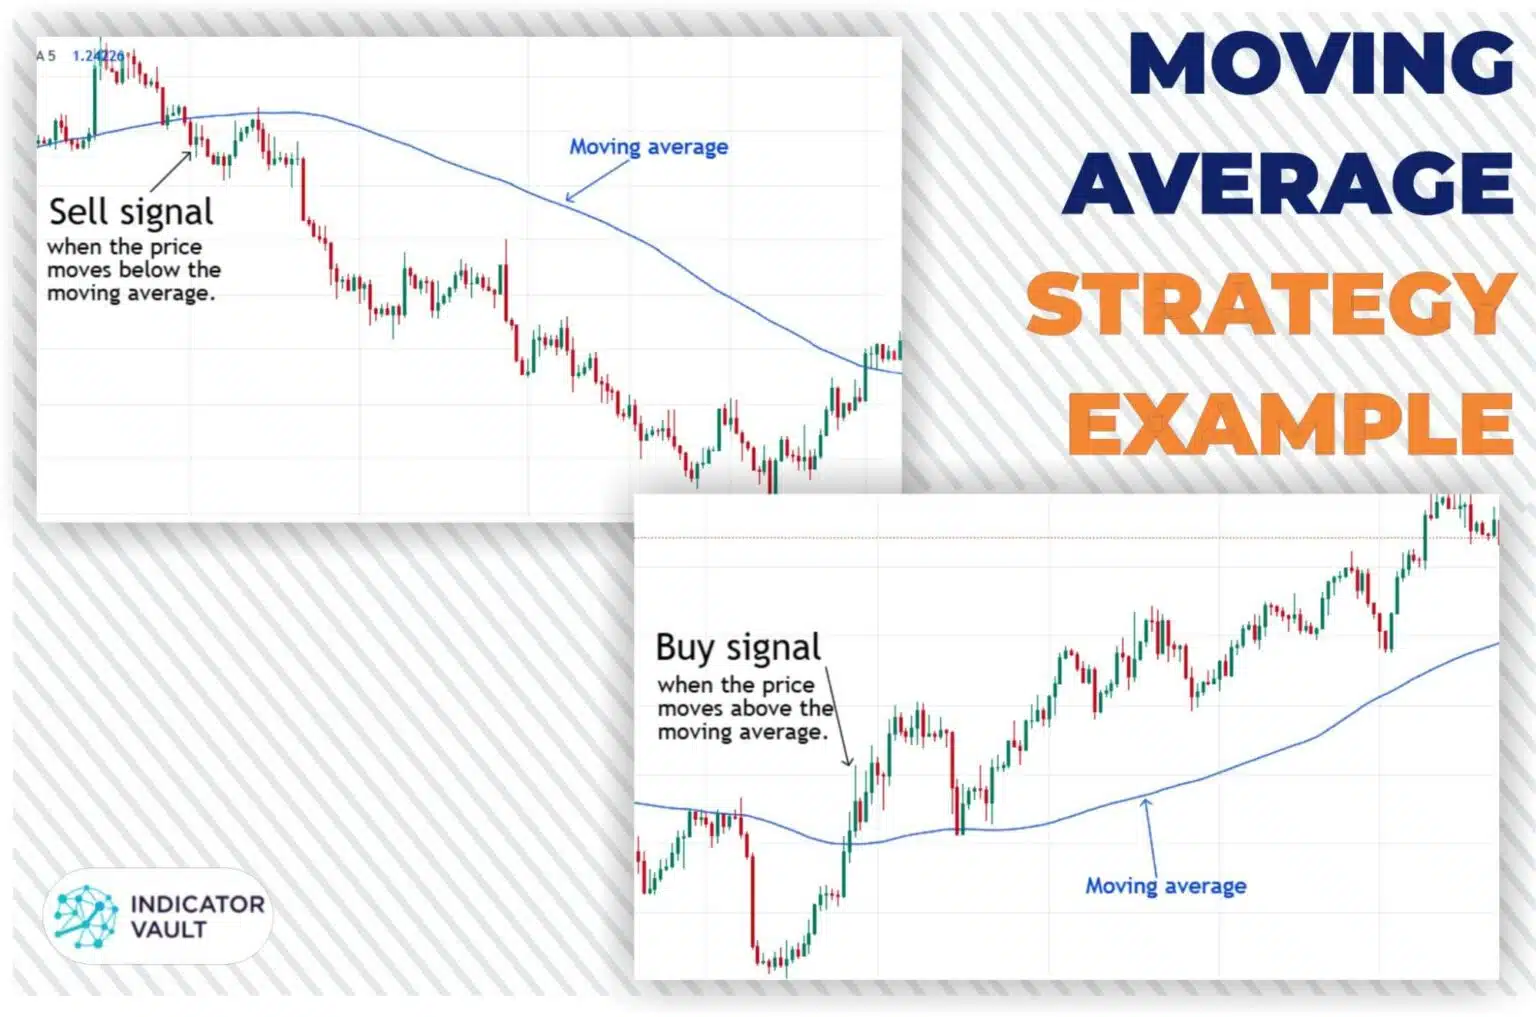
When the price is above the moving average line, the market is generally moving up. When the price is below it, the market is likely moving down. See? It’s that simple.
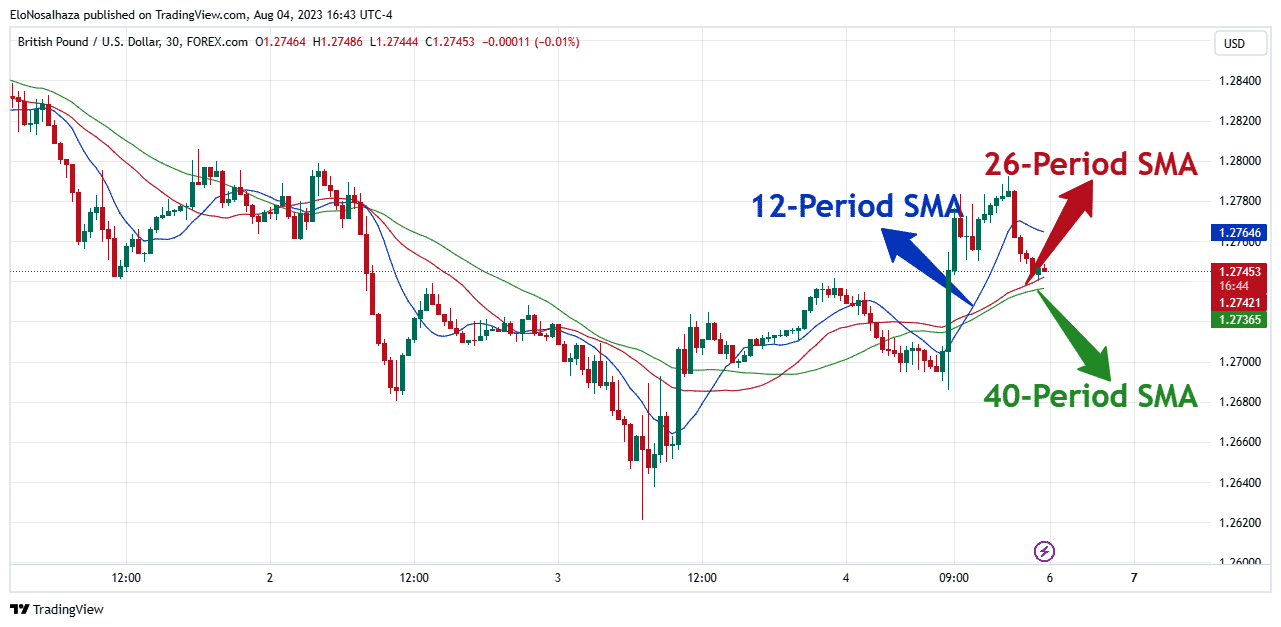
Not all moving averages are the same. They each work a little differently, and knowing this helps you pick the right one.
For most people, especially if you’re new to this, the EMA is a great choice because it’s a good mix of fast and smooth.
You can use moving averages on their own to find powerful signals.
Step 1: Spotting Trends
This is the main job of a moving average.
Step 2: Finding Support and Resistance
A moving average can act like a floor or ceiling for the price.
Step 3: Finding Buy and Sell Signals
Many traders use two moving averages to find signals. For example, a 20-period EMA and a 50-period EMA.
Moving averages are so foundational that they’re a key part of other famous indicators you’ve probably heard of, like the MACD, Bollinger Bands, and the Ichimoku Cloud. They’ve been a starting point for countless trading innovations.
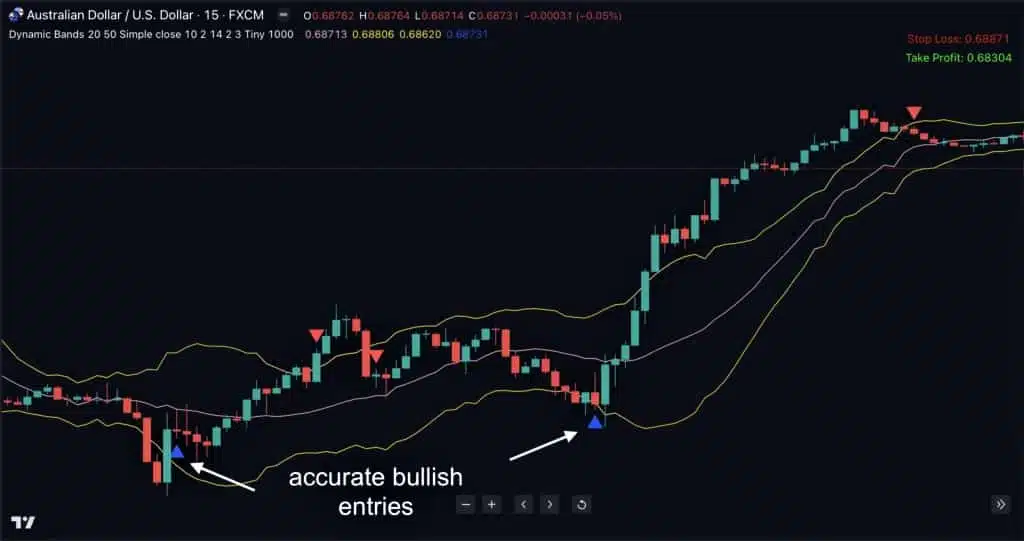
We’ve taken that same foundational idea and built something even more powerful: the Dynamic Bands Indicator.
It’s a next-generation tool that combines a dynamic moving average with the Average True Range (ATR). It’s engineered to:
The moving average is a foundational tool, but we believe our Dynamic Bands Indicator is one of its most impressive evolutions yet.
Click here to see Dynamic Bands Indicator in action
It’s what happens when you take a simple idea and build something truly powerful for today’s markets.