The 50 day moving average is one of the most commonly used tools in technical analysis. By smoothing out price data, the 50 day moving average helps traders see the bigger picture of market direction and filter out short-term noise.
Different periods of moving averages serve different purposes. For example, the 50-day, 100-day, and 200-day moving averages are all popular among traders and investors for spotting trends, identifying support and resistance, and generating signals.
Among these, the 50 day moving average is often seen as a practical balance between shorter-term and longer-term analysis. It reacts more quickly than the 200 MA, while still being less sensitive than very short-term averages.
In this article, we’ll take a closer look at the 50 MA, how it’s applied in technical analysis, the strategies it supports, and where it may fall short compared to modern alternatives.
Continue this article to learn about this novel indicator and what it offers compared to the classical Moving Average. Ambitious traders will immediately receive direct access to improve analysis and trading results.
Table of Contents
1. What is the 50-day moving average?
The 50 day moving average (50 MA) is a type of simple moving average (SMA) that calculates the average closing price of an asset over the past 50 days.
This line is then plotted on a chart and moves forward with each new trading day, creating a smoothed representation of price action.
Because of its balance between short-term sensitivity and long-term stability, the 50 MA is widely used to:
- Identify the intermediate trend of a market
- Highlight potential support and resistance zones
- Work alongside other moving averages, such as the 100-day or 200-day MA, for crossover strategies.
2. How traders use the 50 day moving average in technical analysis
As discussed, this type of MA is one of the most respected and reliable moving averages. Depending on your approach, it can be applied to any market (stocks, forex, crypto, or futures) and across multiple timeframes.
But what makes it so powerful are the ways traders use it:
2.1 Trend Identification
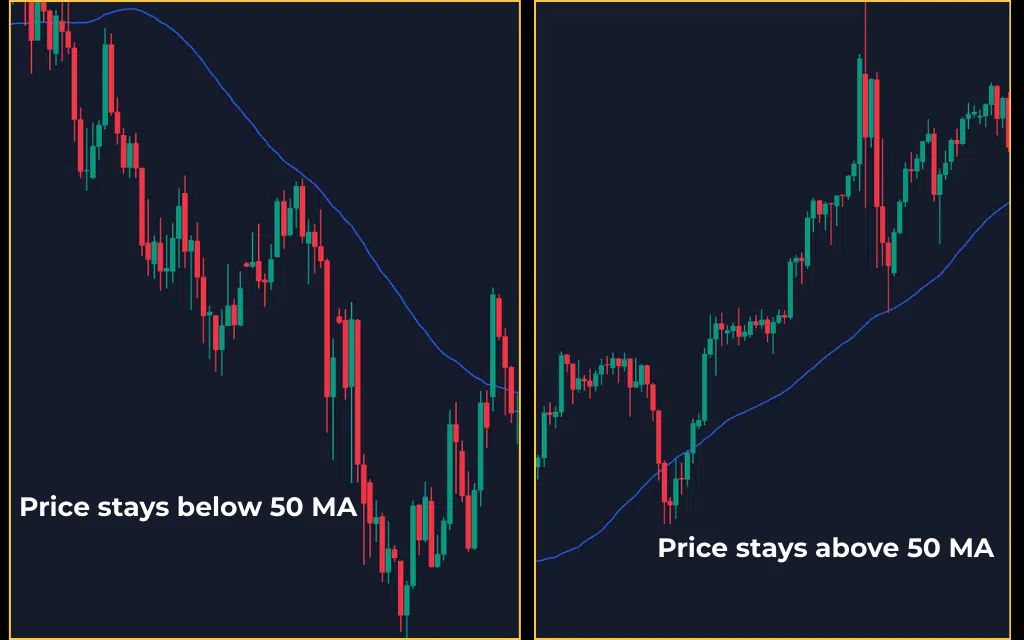
The 50 day moving average is often used as a baseline for identifying bullish and bearish conditions.
- When price consistently stays above the 50 MA, the market is typically in an uptrend.
- When price stays below the 50 MA, it’s often a sign of a downtrend.
- During ranging or consolidating periods, the 50 MA flattens out, and price tends to cross back and forth.
This ability to highlight the overall direction is why the 50 MA remains a favorite for swing traders and long-term investors.
2.2 Support and resistance
Beyond trend direction, the 50 day moving average also acts as a dynamic support or resistance level.
- In an uptrend, the line can serve as support, with price bouncing off it before continuing higher.
- In a downtrend, it often serves as resistance, where rallies fade once price touches the average.
This dynamic feature makes the 50 MA more adaptive than traditional horizontal support and resistance lines.
2.3 Crossover strategies
The 50 day moving average also plays a key role in crossover strategies. Traders often combine it with other moving averages (shorter-term or longer-term) to generate signals.
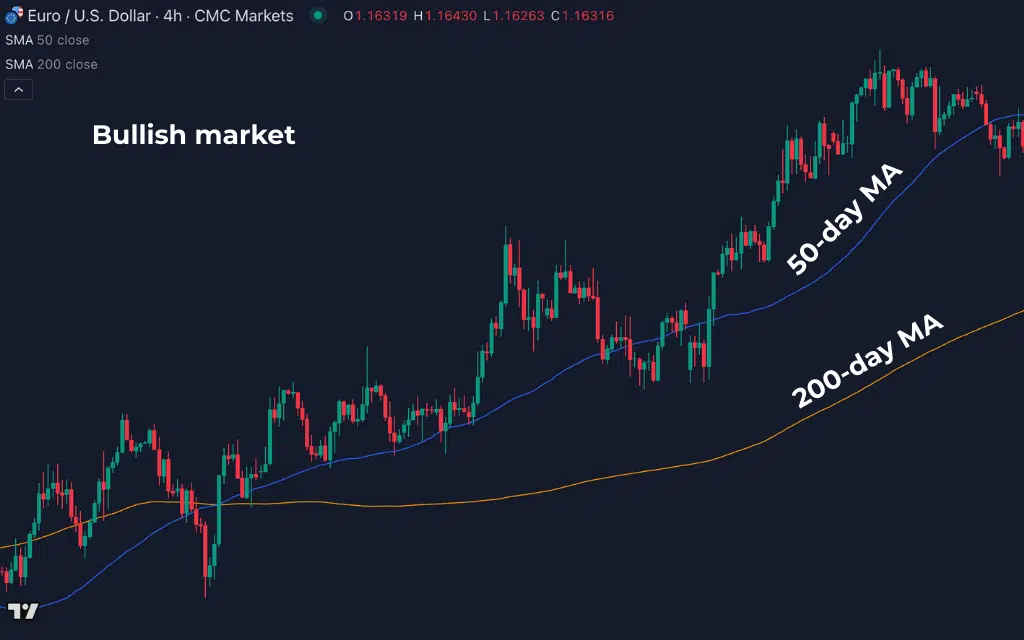
- Golden cross: This happens when the 50-day MA crosses above the 200-day MA, signaling the potential start of a long-term uptrend. Many institutional traders see this as a confirmation of bullish market conditions.
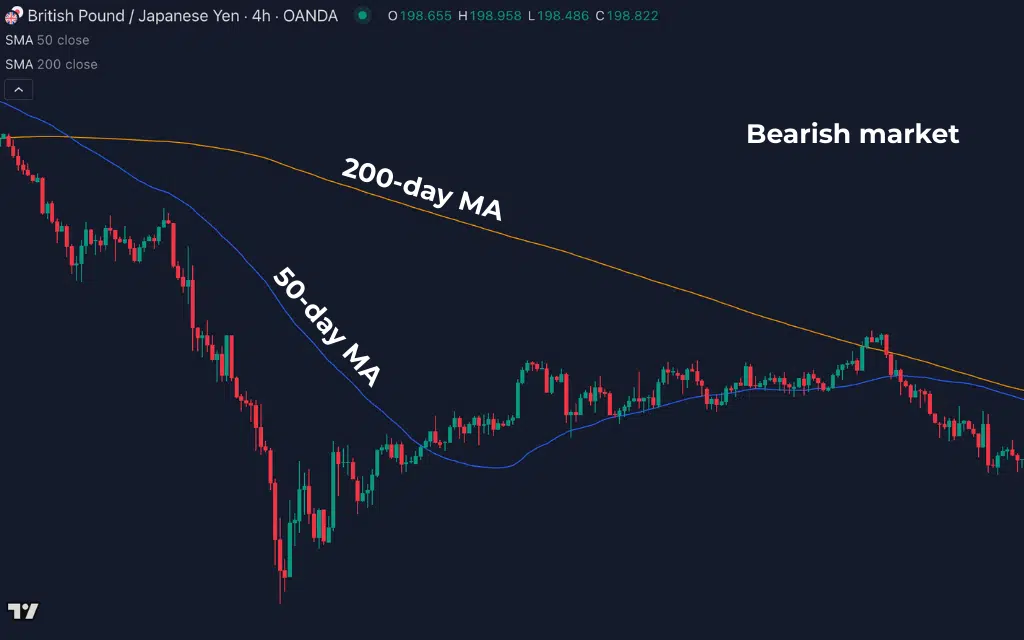
- Death cross: This opposite occurs when the 50 day MA crosses below the 200-day MA, pointing to a potential bearish market.
Apart from the famous 200-day line, traders sometimes use the 50-day moving average alongside the 20-day MA (short-term) or 100-day MA (intermediate-term). This layering gives a more detailed view of trend dynamics:
- The 20 vs 50 crossover can highlight short-term momentum shifts.
- The 50 vs 100 crossover provides a medium-term perspective.
- Aligning the 20, 50, and 200 together can confirm strong multi-timeframe trends.
This makes the 50 MA a versatile tool, bridging the gap between short-term signals and long-term analysis.
3. Drawbacks of using the 50-day MA
While the 50-day moving average is widely respected, it’s not without flaws. Traders should be aware of its limitations before relying on it as a standalone tool.
3.1 Lagging nature
Like all moving averages, the 50-day MA is based on past price data. This means it reacts after the market has already moved. In fast-moving markets, you might see signals that arrive too late, missing out on the best entries and exits.
3.2 False signals in choppy markets
The 50-day MA works best in clear uptrends or downtrends. But when the market is sideways, prices can whip above and below the average repeatedly. This creates false signals that can frustrate traders and lead to losses.
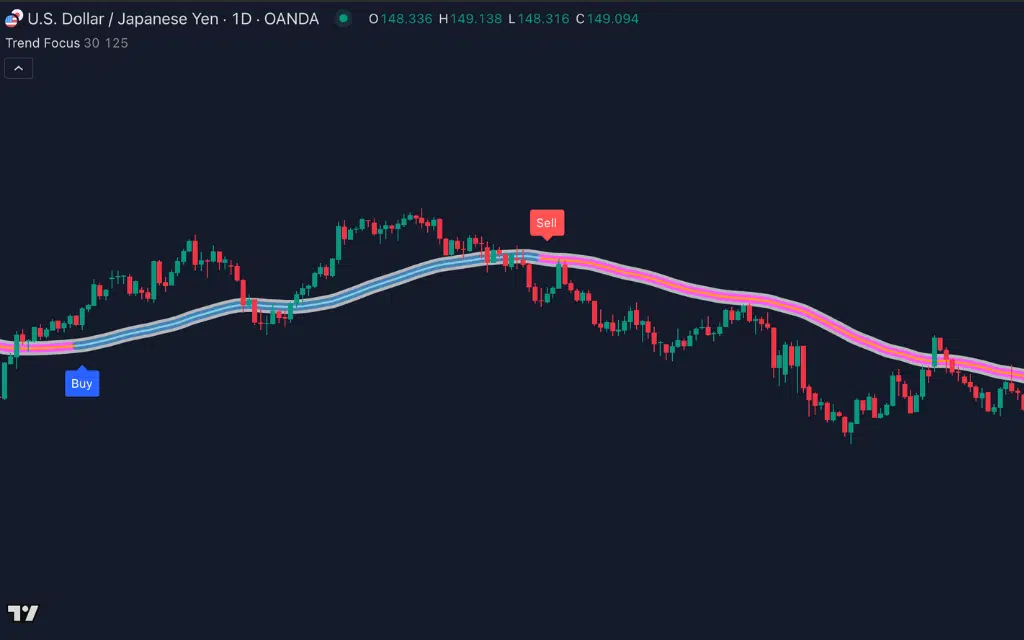
4. A smarter alternative: Trend Focus indicator
The limitations of the 50-day moving average highlight a simple truth: traders need tools that react faster and filter out noise more effectively. That’s where the Trend Focus indicator comes in.
Unlike traditional MAs, Trend Focus indicator is designed with advanced algorithms that reduce lag and adapt more quickly to changing market conditions. Instead of waiting for the market to move before showing you the signal, it delivers early alerts so you can act at the right time.
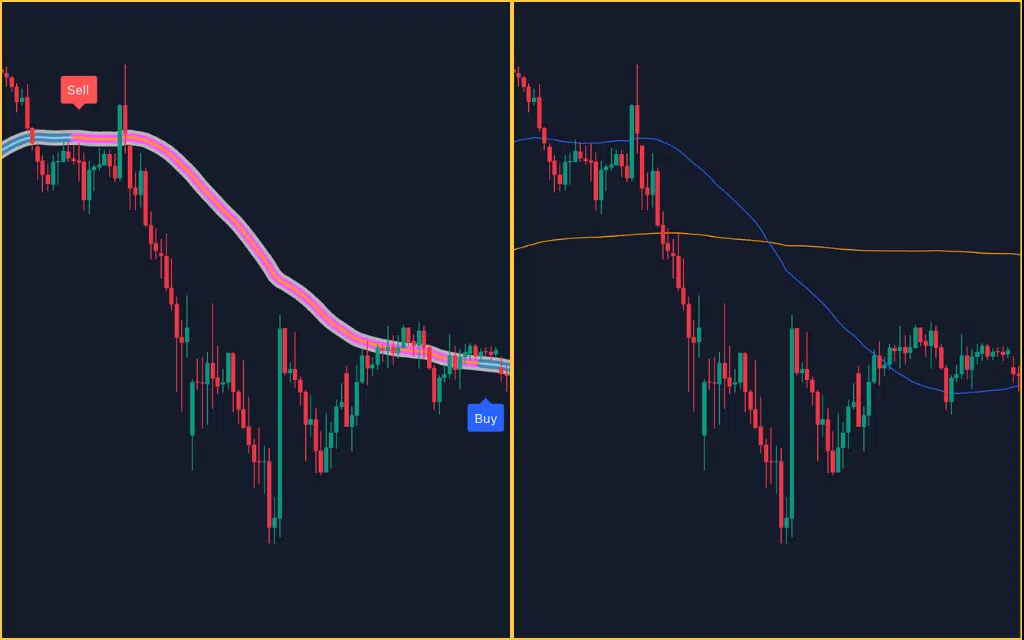
Another key advantage is how it handles sideways markets. Where the 50-day MA often produces false crossovers, Trend Focus uses noise-filtering techniques to ignore minor price moves. This helps you avoid frustrating whipsaws and stay focused only on meaningful signals.
5. Final Thoughts
The 50-day moving average is a classic tool for spotting trends and key levels, but it often lags and struggles in sideways markets.
The Trend Focus indicator takes what’s useful about moving averages and enhances it with faster response times and built-in noise filtering. Instead of reacting after the move is over, it helps you stay one step ahead by highlighting only the most reliable opportunities.
If you want to experience how Trend Focus can sharpen your strategy, check it out today.