Table of Contents
1. Introduction
It’s one thing to know trending conditions are the most favorable for trading; it’s another thing to identify them. That’s why trend following indicators have become essential tools for modern technical analysts.
Price analysts have invented various means to detect sustained market direction, but trend following indicators remain the most practical and widely used solutions today.
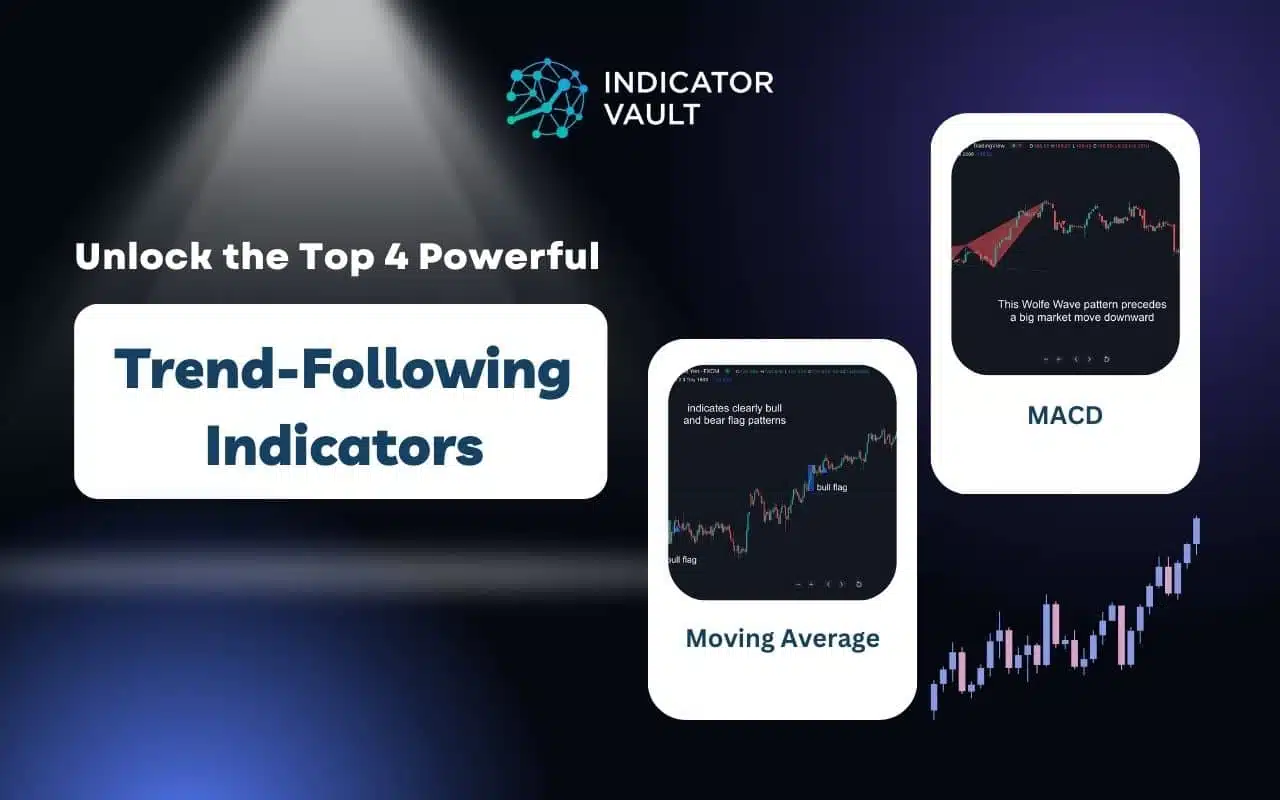
Stick around to learn four of the most useful trend following indicators, from MACD to Smooth Trend Finder, and how they help confirm bullish and bearish market conditions.
2. Moving Averages
The Moving Average (MA) is hands down the most popular among trend following indicators. It represents the average of price values over a fixed subset, plotted as a smooth line.
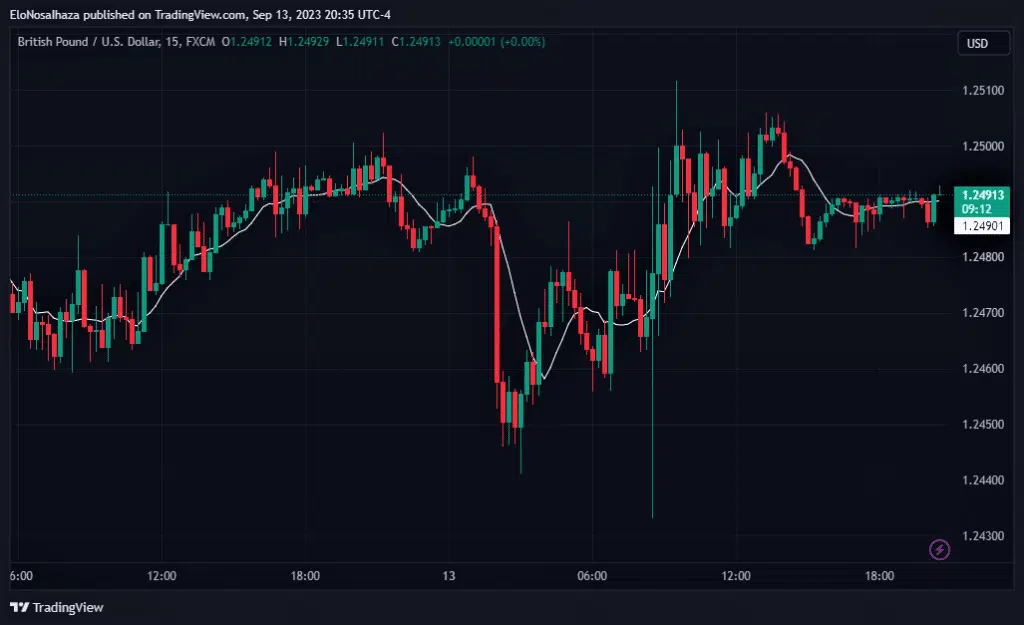
As more data becomes available, the MA makes recalculations to ensure it always moves with price. Hence, the name “Moving” Average.
Using The Moving Average Confirm Price Trends
Alone, Moving Averages may look simplistic, but they remain foundational trend following indicators for identifying market direction.
On the contrary, this tool is highly effective in trend identification.
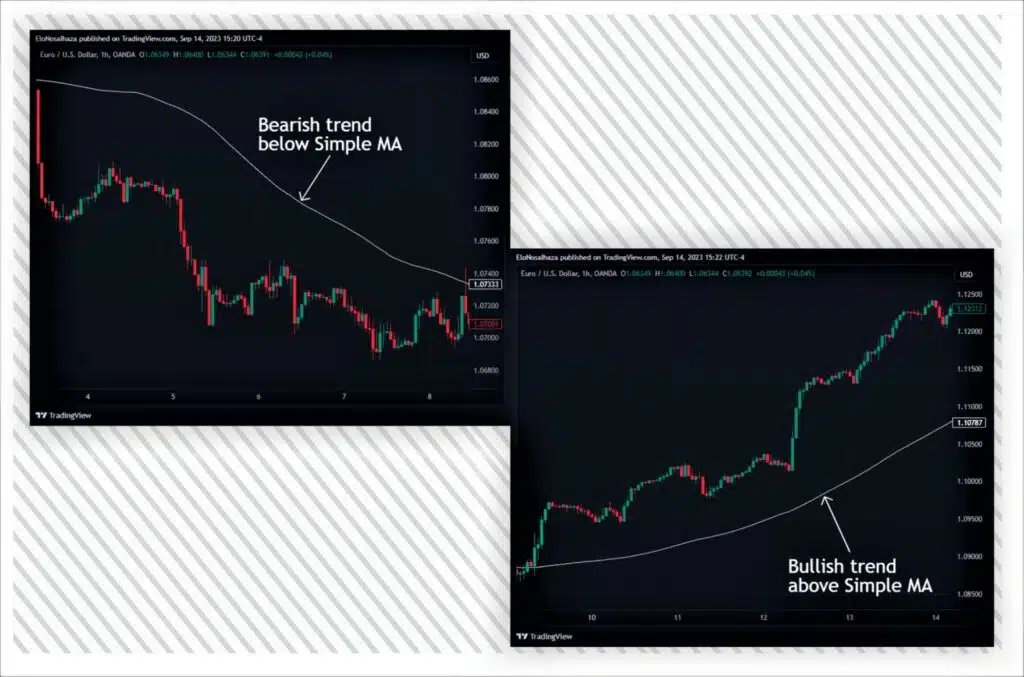
The market price is in an uptrend, downtrend, or sideway trend, depending on its position relative to the MA.
Traders consider it bullish when the price is consistently above the indicator and bearish when it’s been consistently below. There are also ranging conditions when they frequently cross each other.
The timeframe, instrument, and MA’s period and type are also highly influential. Therefore, back- and forward-test your theories extensively before application in live accounts.
3. Moving Average Convergence Divergence (MACD)
The MACD is another powerful addition to the family of trend following indicators.
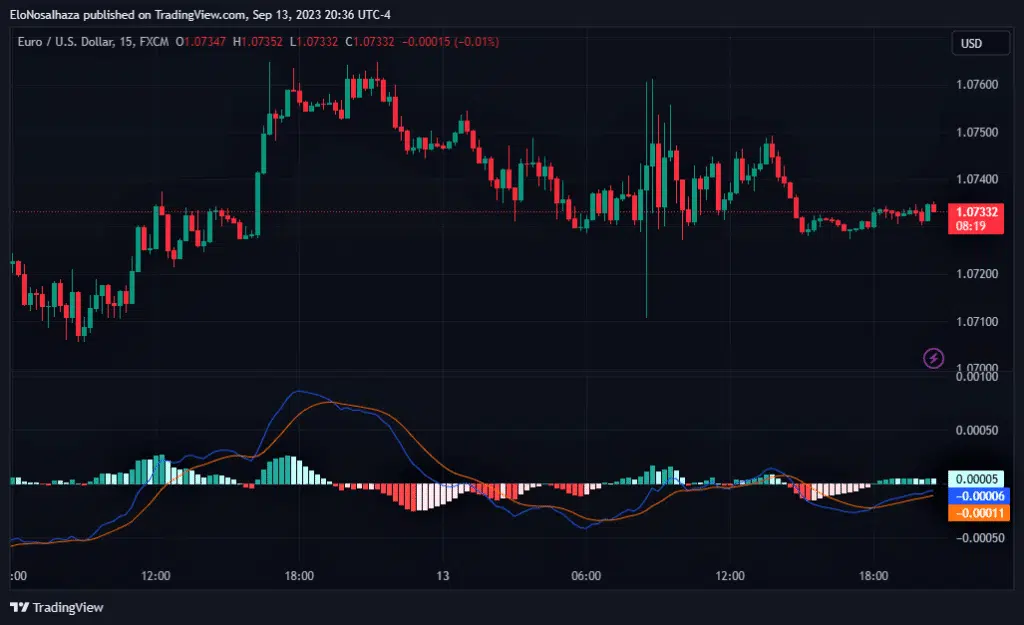
Classical ones consist of the following parts:
- Two Exponential Moving Averages of different periods
- A MACD Line formed from the subtraction of the EMAs
- A Signal Line calculated from the MACD Line
- A MACD histogram
Trend-Following With the MACD
Gerald Appel initially designed MACD specifically for trend assessment, and it remains one of the most respected trend following indicators decades later.
The classical and generally accepted way to confirm a trend is the cross of the MACD Line and the Signal Line. The former is a “faster” Moving Average than the latter.
Conditions are bullish when the MACD Line remains above the Signal Line and bearish when below.
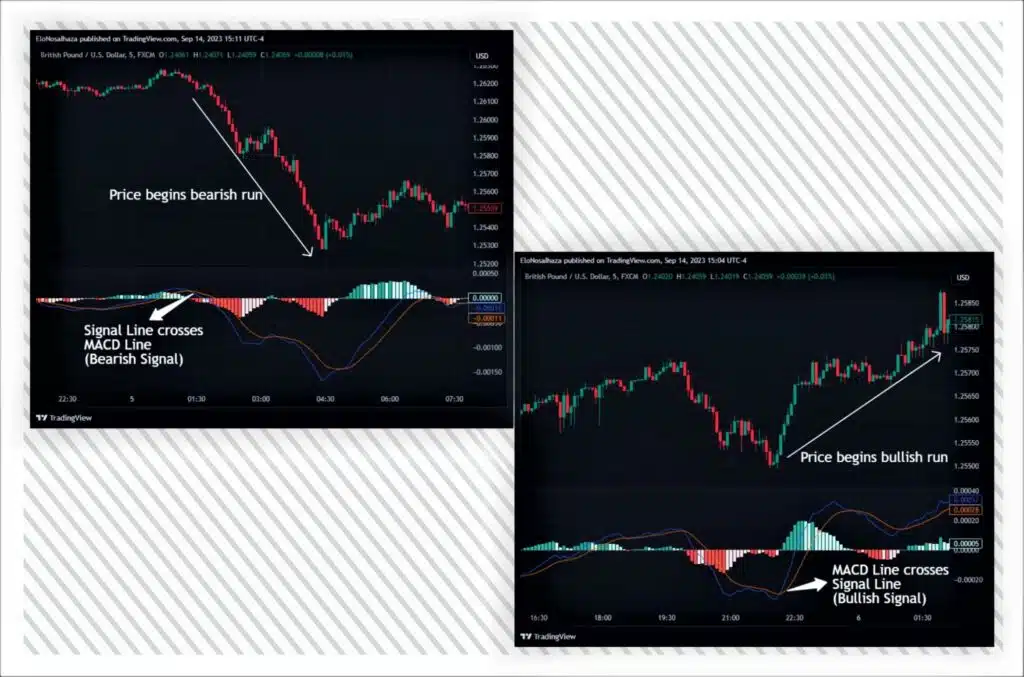
The probability increases when the histogram bars are positive and negative for uptrends and downtrends, respectively.
Histogram confirmation further strengthens signals, making MACD one of the more dynamic trend following indicators available.
4. Supertrend
The Supertrend is another reliable entry among modern trend following indicators, built using the Average True Range (ATR) and a multiplier.
Ideally, the ATR helps measure volatility over a certain period by analyzing price highs and lows. However, the multiplier (usually between 1 and 3) tweaks the indicator’s sensitivity.

Applying the Supertrend for Trend Assessment
The Supertrend works like the Moving Average for identifying trends.
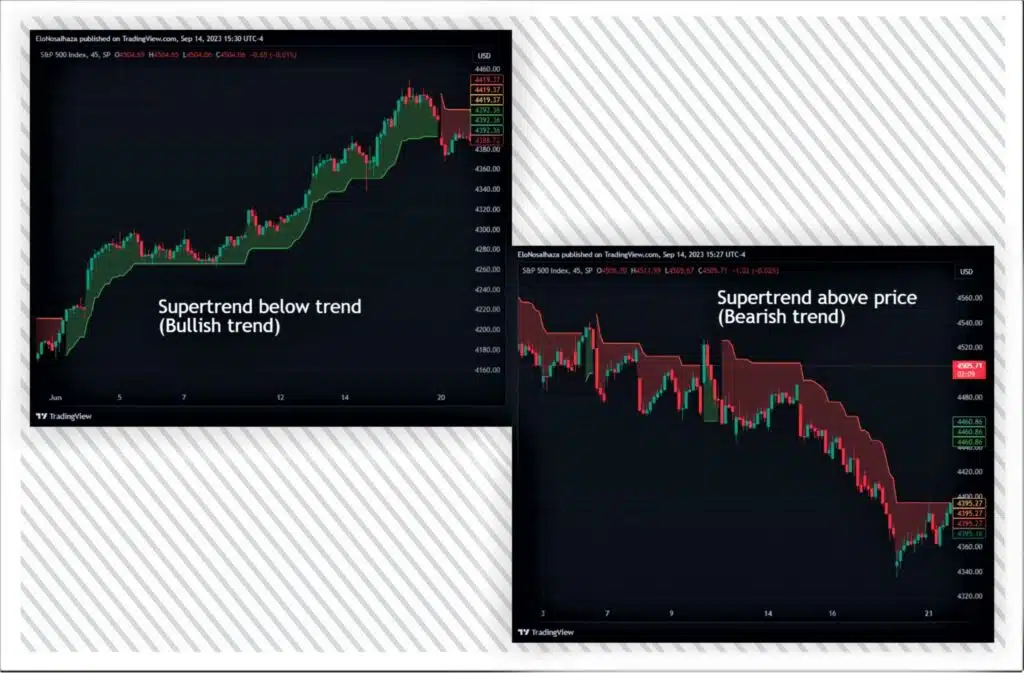
Advocates believe the price is in a healthy uptrend whenever the Supertrend line is below. Conversely, they become bearish-biased when the indicator moves above.
Below is an example of both scenarios:
Note that the Supetrend’s probability drops whenever the price isn’t clearly trending.
Other traders get more precise with it for entry and exit signals, but its trend-following function is the most promoted use.
Like most trend following indicators, its reliability improves when markets are clearly trending rather than ranging.
5. Smooth Trend Finder
Among emerging trend following indicators, the Smooth Trend Finder stands out for its responsiveness and predictive capacity.
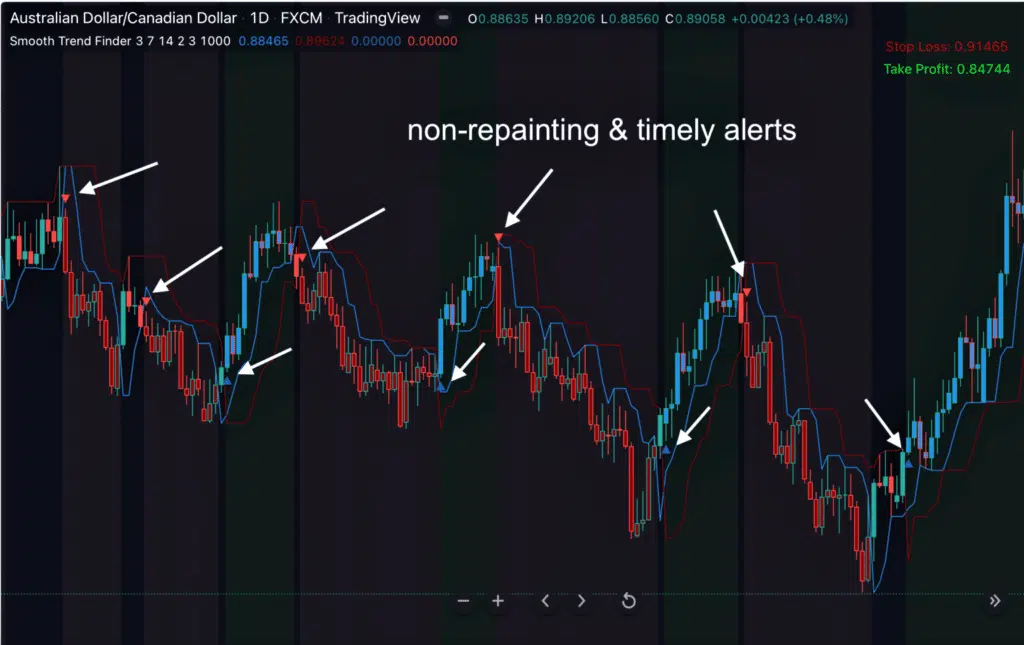
Currently available for TradingView, this indicator focuses on the latest close price relative to previous highs and lows. The evaluation doesn’t only share the underlying movement but also signals upcoming reversals.
Benefits of the Smooth Trend Finder
The Smooth Trend Finder comprises two simple but functional lines and switching chart background colors.
It may not seem like much from a superficial perspective. However, studies into price data prove it’s genuinely one in a million.
Compared to traditional trend following indicators, it offers:
- Discovery of new movement (reversals) far quicker than Moving Averages, MACD, or Supertrend
- Learning when the market is ranging with utmost certainty
- Faster response to price movements due to the tool’s high sensitivity
- Abstinence from false signals, thanks to Indicator Vault’s Triple Confirmation algorithm
Click here for an exclusive plan to use it ASAP.
6. Final Thoughts
Every ambitious trader seeks to trade strong directional markets and avoid choppy conditions. Thankfully, structured trend following indicators like the MA, MACD, Supertrend, and Smooth Trend Finder help reveal those opportunities.
The Smooth Trend Finder is arguably the most impressive because it predicts potential trend changes, unlike others that lag.
There are several trading opportunities to employ these indicators. Thus, share this article to help friends and aspiring traders on social media.
The Comment Section is also open to questions, contributions, and trading results regarding market movement.