Candlestick reversal patterns are one of the fastest ways for traders to develop an edge trading the market. If you haven’t heard of this pattern and its common types before, no pressure there! Indicator Vault has compiled the most fundamental information for you to visualize.
As a trader, candlestick reversal patterns are important tools you must know. Candlestick reversal pattern are tools for you to predict price direction.
In other words, it will help you know if the next trend of the market will reverse or not, where the top and bottom of the trend is. If so, you will make swift decisions on when to take profit and stop loss.
There are various ways in which the reversal can occur. We distinguish between bullish candlestick reversal patterns and bearish candlestick reversal patterns.
Here are some of the most common reversal candlestick patterns from both categories.
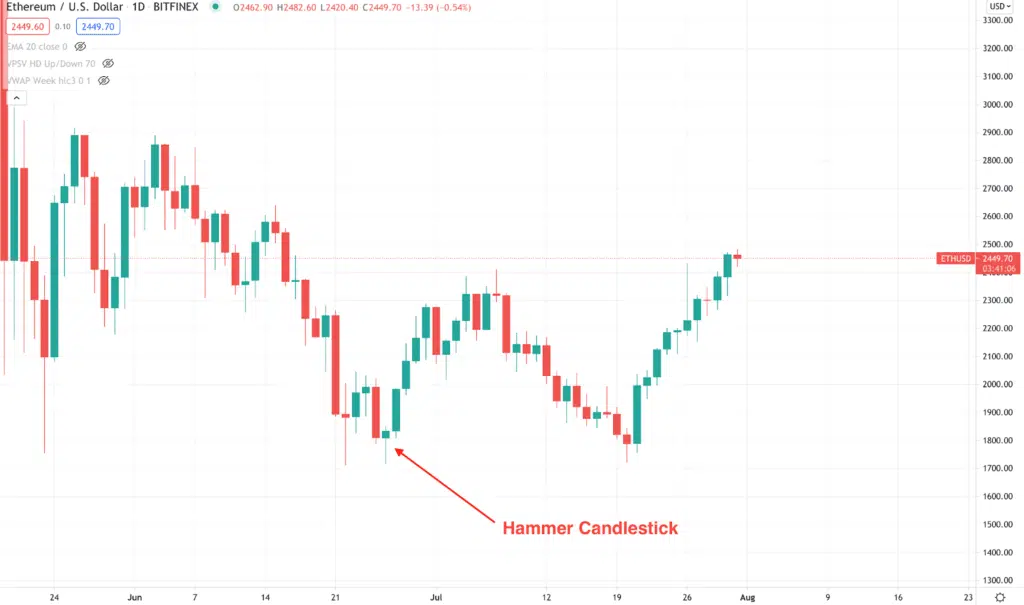
The hammer is a single candlestick formation and is formed by a relatively small body and a long tail (at least twice the length of the real body).
Hammer is a bullish reversal candlestick pattern that happens when the market is in downtrend. If you identify this pattern, you should remember that the prior trend is a downtrend.
When the hammer appears on the price chart, it means that at the time the market is open, control of the market is on the side of the sellers. Moreover, they were trying to push down the prices but they were unable to do so. And because of this strong push, the price closed at or near the opening price.
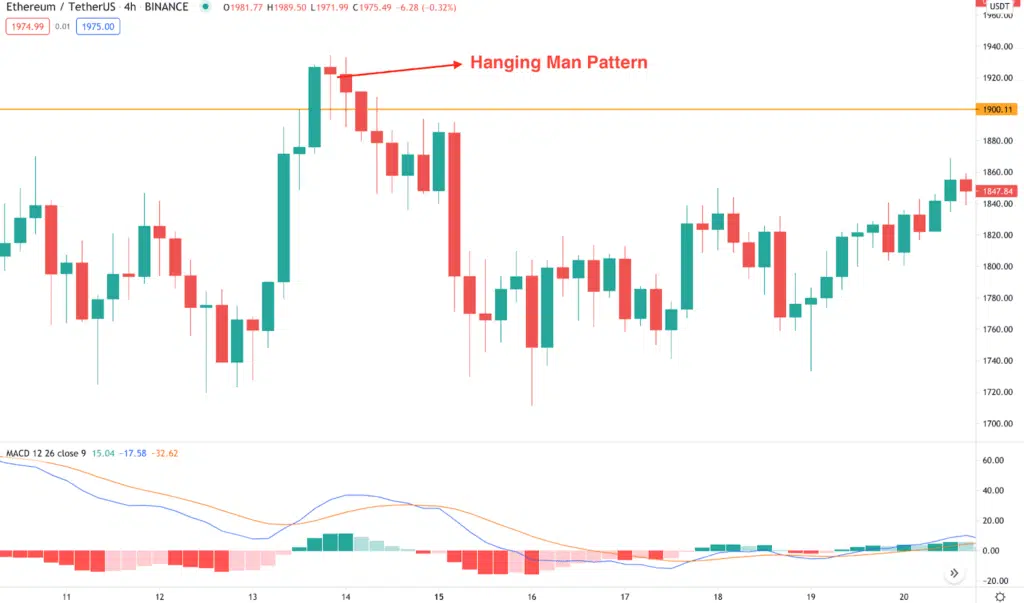
The hanging man is also a single candle with a small body and a long wick.
The hanging man appears at the end of an uptrend or strong resistance zone. It signals that the uptrend is about to end and the market will reverse from bullish to bearish.
It may look like a hammer but from another angle, you will see it as a person hanging from a high level with their long legs below. To avoid confusion, you must be familiar with the characteristics of each pattern.
You should remember that the red hanging man candlestick will provide more accurate signals than the green hanging man.
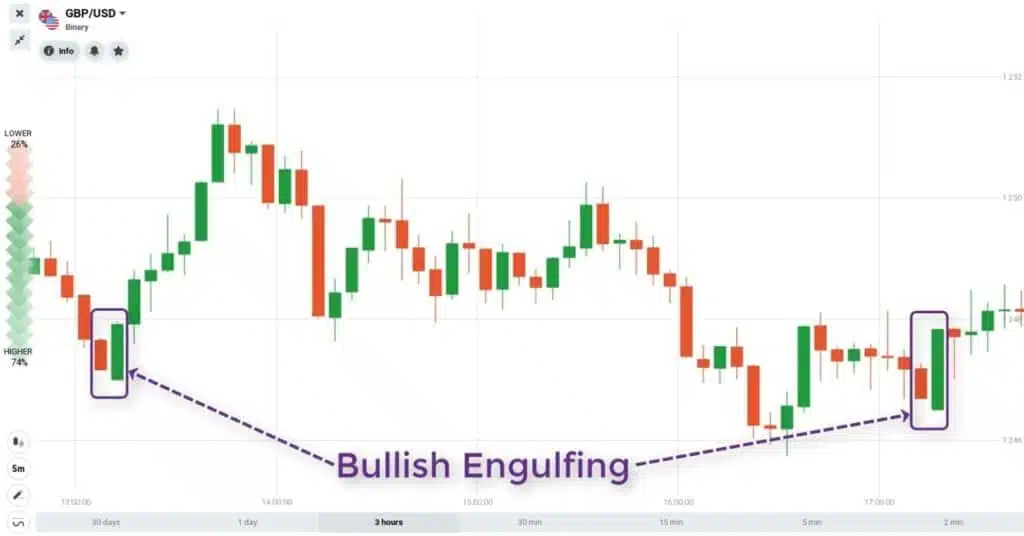
An “engulfing” is a two-candle pattern that can signal a strong reversal in the price market. Its name means that the second candle engulfs the body of the first candle.
Depending on the location of the formation and the ongoing price trend, the engulfing candle can be bullish or bearish.
This pattern consists of the first candle being red and the second candle being green. It must be located at the bottom of a downtrend to bring about a potential reversal.
Bullish Engulfing reverses the current trend as more buyers enter the market, pushing prices even higher.
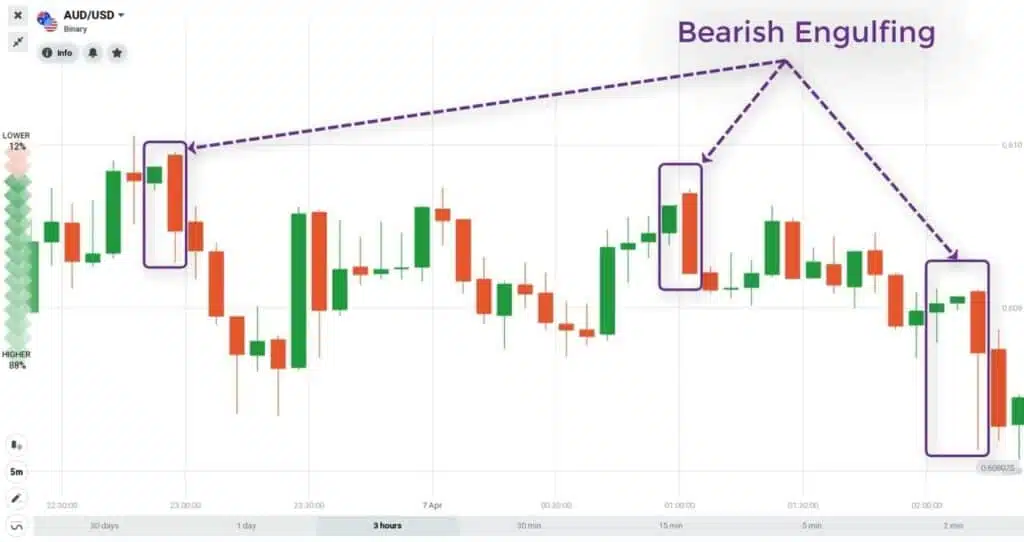
It’s the exact opposite of the above pattern.
This pattern consists of the first candle being green and the second candle being red. It shows a reversal from the uptrend and moves the prices up after a long uptrend.
In other words, sellers have surpassed buyers and are pushing the price down more aggressively than buyers were able to push it up.
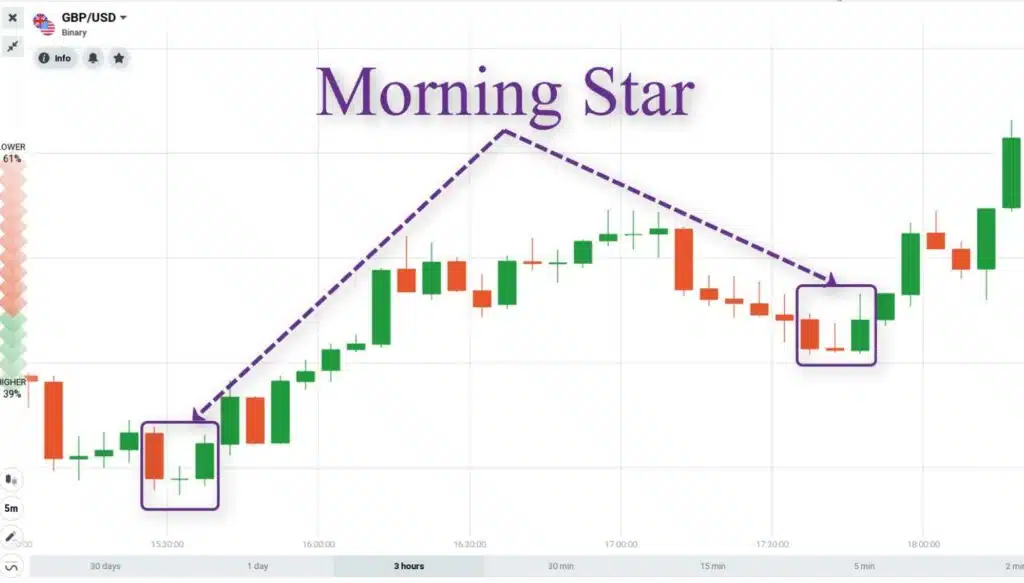
It is a bullish formed by three candles. The first candle is a bearish candle (red), indicating the previous price trend. Next is a small body candle. Its color is not important, it can be bullish or bearish. Finally, there is a bullish candle, showing a strong return of the buyers.
The morning star follows a downtrend and suggests higher prices may soon begin.
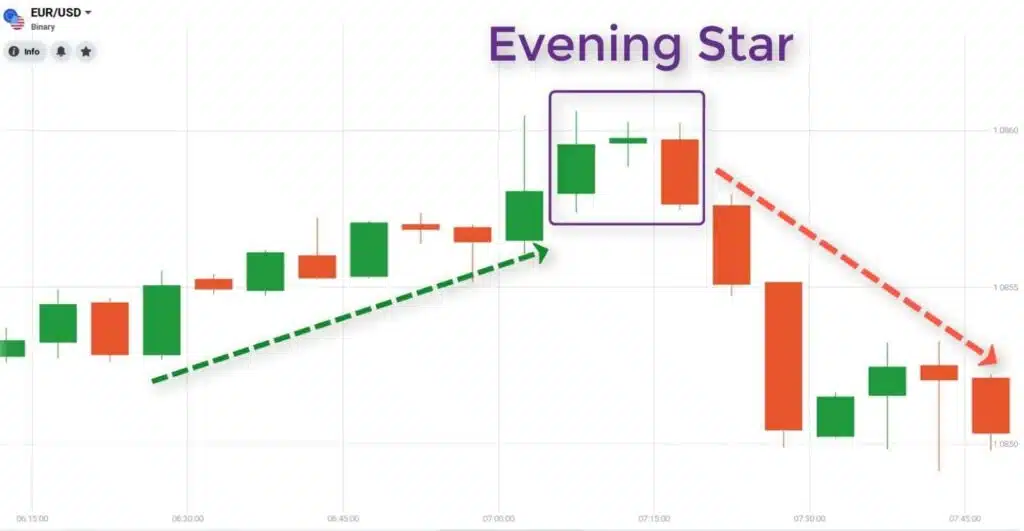
It is a triple bearish candlestick pattern that indicates a bearish reversal. The first is a bullish candlestick (green). The second one can be either bullish or bearish with a small body. And the third candlestick is a bearish candle, its body is covered by the first candle or 1/2 of the body of the first candle.
As it is formed at the end of an uptrend. It gives us a warning sign that the uptrend is going to reverse to a downtrend.
We have just shown you top 4 popular candlestick reversal patterns as well as their features. In addition to these 4 types, you will come across many different types of candlestick reversal patterns during your trading. Because of this diversity, it may make you confused and lead to a risky trade. We’ve all been there.
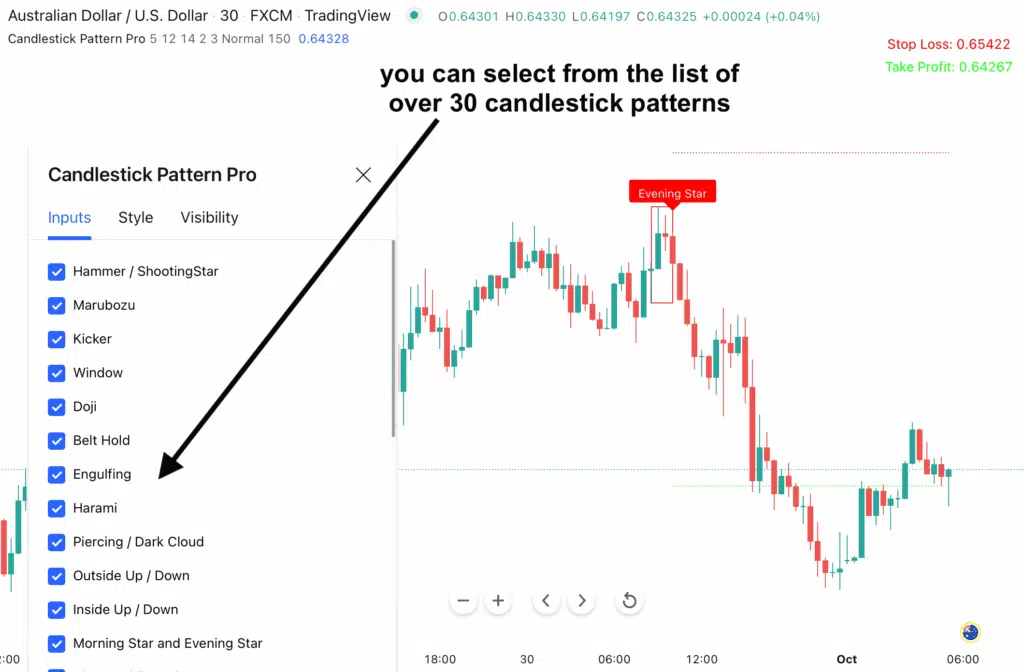
To help you easily identify candlestick reversal patterns as well as other candlestick patterns, we just released an amazing indicator – Candlestick Pattern Pro for TradingView.
This versatile “Candlestick Patterns” indicator does exactly what its name suggests: It scans the market in real time and detects over 30 candlestick patterns for you. Such as reversal, continuation, trend exhaustion patterns,…
Moreover, it plots these patterns beautifully on your charts. It’s never been easier to apply candlestick patterns in your trading.
All you need to do is turn on notifications, this candlestick patterns indicator does almost everything. You easily seize the opportunity to get high-probability trades.
Interesting?
Through the article, we hope that you have looked at some of the most popular candlestick reversal patterns. In addition, the candlestick reversal pattern has many other patterns, you can learn more to support your technical analysis.
Thanks for your reading. You can find out more articles in our blog: Tracking And Profiting With Trend Reversal and Everything You Need To Know About Order Block .
If you would like to keep up on the latest trading news and best deals, come by and connect with us:
Feel free to share your comments on the candlestick reversal!
Find this article useful? Share this blog with your friends on social media!