Despite the Relative Strength Index’s popularity, only a few users truly understand its basics. Dive into this article for its fundamentals, uses, and caveats.
The Relative Strength Index (RSI) is easily among the most popular technical indicators ever. While adopting ensuing strategies from several sources has become effortless, understanding its fundamentals affords enthusiasts a leading edge.
Continue reading this post for more insights into the tool’s inner workings and basic applications, including essential caveats only the gurus know. Readers will also uncover a revolutionized variant that elevates technical analysis significantly.
The Relative Strength Index is a momentum indicator first developed and shared by renowned American engineer – J. Welles Wilder.
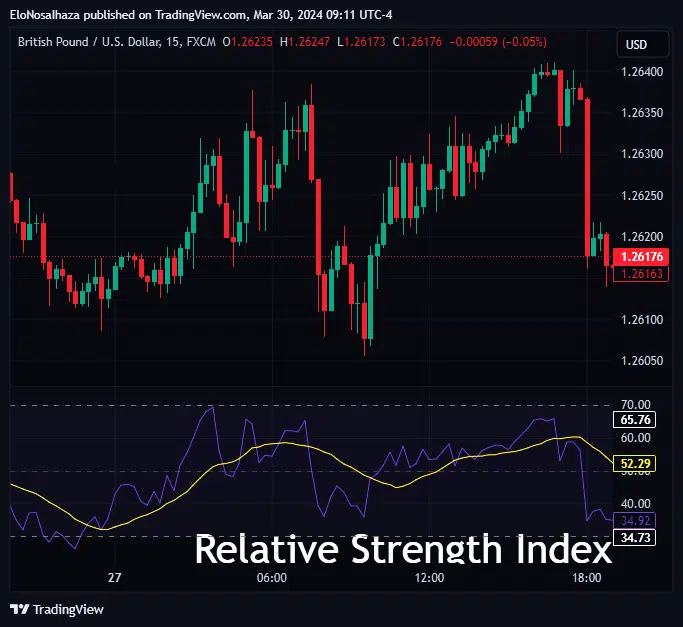
Like most similar indicators, its primary goal is to reveal the speed and magnitude of price moves (bullish or bearish). It acquires the closing prices of a defined trading period for representation on a chart as seen below:
The RSI formula is multi-faceted, involving closing prices, Moving Averages, and some ratio calculations. A Relative Strength Factor ultimately gives rise to the plotted graph from 0 to 100.
The consensus among users is that the 30 and 70 levels marked are the most significant. The market is overbought when the RSI surges swiftly above the latter. Conversely, when it runs below the former, it is oversold.
Owing to the fast-paced evolution technical analysis enjoys, various adaptations of the RSI have surfaced. Almost every believer in the indicator has modified theories for improved personal results.
However, below are a few initial and generally accepted strategies with the oscillator:
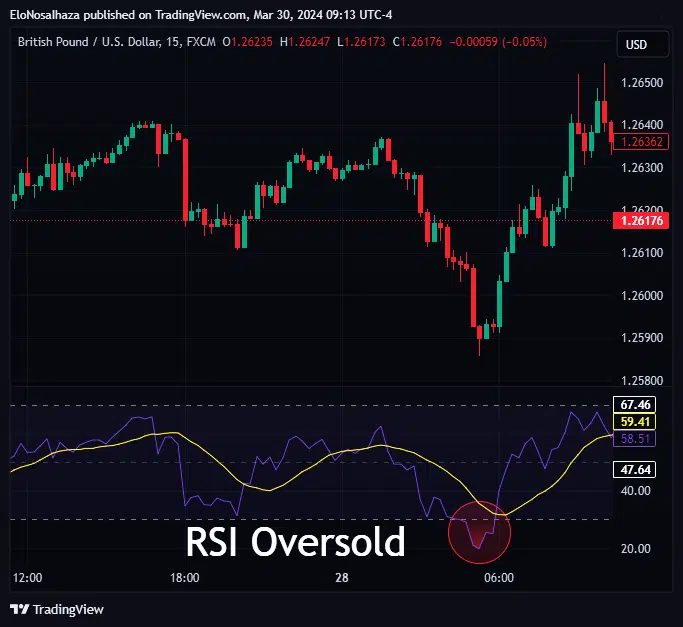
As discussed, below and above certain levels in the indicator signals an overbought or oversold market. 30 & 70 are the most generally accepted but some investors go more extreme to consider 20 & 80 or 10 & 90.
When the market is overbought, RSI proponents expect an imminent downtrend and look for reasons to go short soonest. Likewise, when oversold, the anticipation of an approaching uptrend makes traders eager to buy a security ASAP.
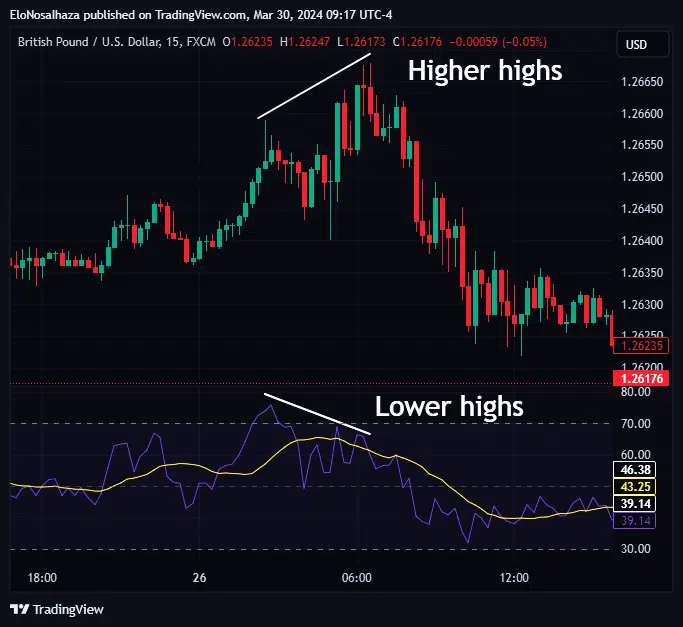
Typically, the market price and RSI move in tandem, forming similar highs and lows during trading hours. A divergence occurs when there is a significant discrepancy between them.
The market may fail to break an old swing high or low when the indicator does, and vice-versa. Thus, traders expect a trend reversal sooner or later.
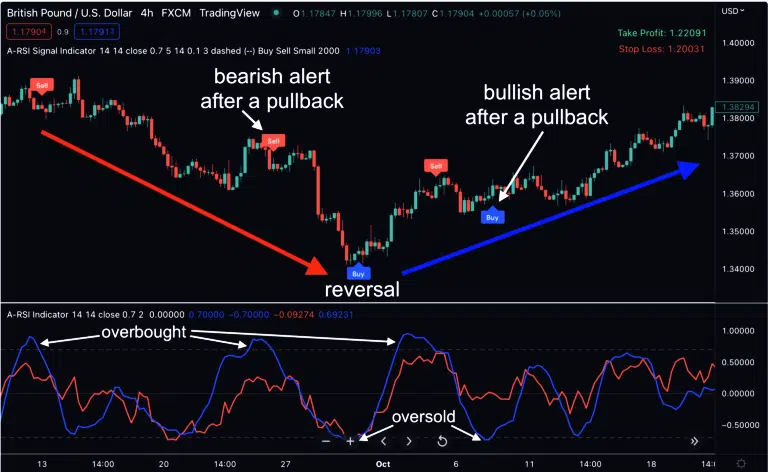
In this strategy, the RSI emerges from an overbought or oversold area. Then, it leaves the region and turns back slightly, teasing a desire to return there. Finally, it surges away from the overbought/oversold territory, breaking the most recent low/high.
After the breakout, the security typically moves a sizable magnitude, continuing the trend.
Although the RSI has garnered notable advocates following its inception, it is by no means infallible in forecasts. Pros, conscious of this, even combine it with other theories and strategies for increased precision.
Hence, any interested trader must take caution of these points:
Risk and money management strategies are also vital for trading with the oscillator.
No doubt, basic RSI techniques, as shared above, will generate positive results. Almost every technical analyst, experienced and novice, has tried to confirm its efficiency in one way or another.
However, Indicator Vault has developed a massively underrated game-changer – The Advanced RSI (A-RSI) for TradingView.
True to its name, the A-RSI’s foundation depends on the classic Relative Strength Index but with major tweaks to suit trading in any condition.
Concisely, below are a few of several benefits users relish from its application:
Sounds false? Click here to confirm these and many more perks ASAP.
The Relative Strength Index is highly respected in technical analysis for its remarkable success in price forecasts. It comprises a graph plotted from 0 to 100, with overbought and oversold territories above and below 70 and 30, respectively.
Past and present users use the oscillator in several inventive ways, including basic divergence, swing rejection, and overbought-oversold techniques.
However, it gets much better with the highly recommended A-RSI for TradingView.
Please share this article with any ambitious indicator buff. Also, leave a comment below for exciting debates.