1. Introducing the Dynamic Bands indicator for TradingView
If you’ve ever been stuck watching price bounce back and forth, whipsawed by false signals and sideways noise, you’re not alone.
But what if you had an indicator built to cut through all that noise? One that reacts only when the market is truly trending — helping you catch real moves and avoid the frustrating whipsaws?
Introducing the Dynamic Bands indicator for TradingView — designed to solve exactly these problems.
2. What Makes Dynamic Bands Different?
Unlike traditional indicators like simple moving averages or Bollinger Bands, which often lag or get fooled by sideways action, Dynamic Bands use a smarter approach:
Dynamic Moving Average + ATR: The core of Dynamic Bands is a dynamic moving average combined with Average True Range (ATR) bands, which measure actual market volatility instead of relying on fixed statistical deviations.
No More Whipsaws: Because the bands adjust based on the speed of the market, they ignore sideways noise and only signal when a genuine trend begins.
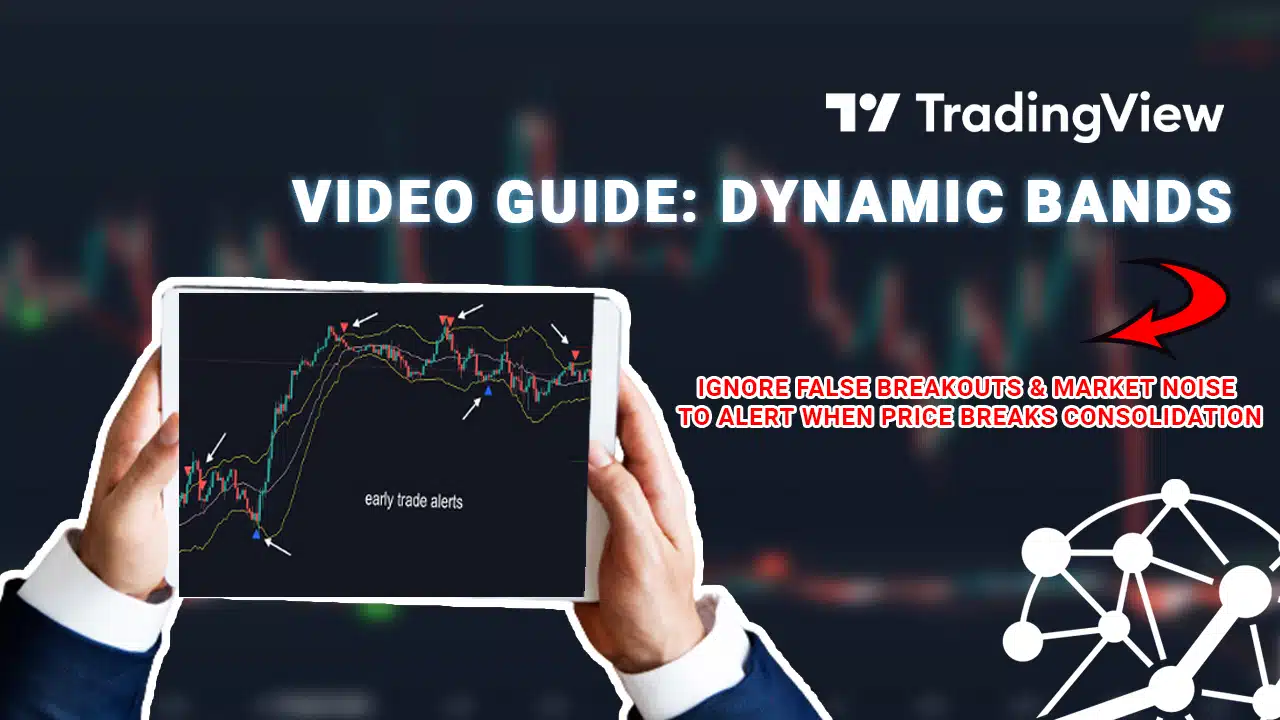
Clear Entry & Exit Signals: Dynamic Bands doesn’t just draw lines — it help identify bullish and bearish entries when price crosses outside the bands and then returns, giving you clear trade signals with automatic stop loss and take profit levels.
Watch the full video for a walkthrough of real trade examples with the Dynamic Bands.
Ready to trade high-probability setups without false breakouts and noise?
Click here to explore the Dynamic Bands indicator for TradingView.