Table of Contents
1. What Is a Flag?
A flag in the context of technical analysis is a price pattern that moves opposed to the dominant price trend shown on a price chart in a shorter time period. It gets its name from the way it reminds the observer of a flag on a flagpole.
The flag pattern is used to indicate the possibility of a prior trend continuing from a point when price has strayed against that trend. If the trend resumes, the price gain might be swift, making it favorable to time a trade by observing the flag pattern.
2. How a Flag Pattern Works
Flags are areas of tight price consolidation indicating a counter-trend move that occurs immediately after a major directional price movement. The pattern is often made up of five to twenty pricing bars. Flag patterns may be either upward or downward trending (bullish or bearish). The bottom of the flag should not be higher than the halfway of the preceding flagpole. Flag designs are distinguished by five basic characteristics:
- The preceding trend
- The consolidation channel
- The volume pattern
- A breakout
- Price goes in the same direction as the breakout as confirmation.
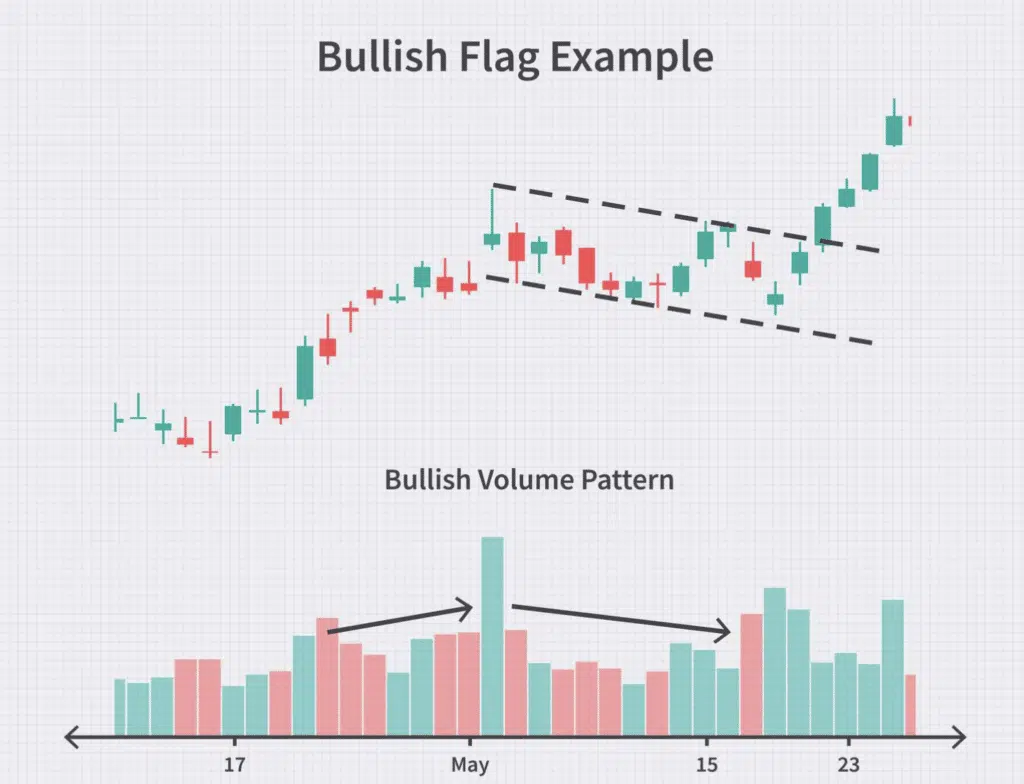
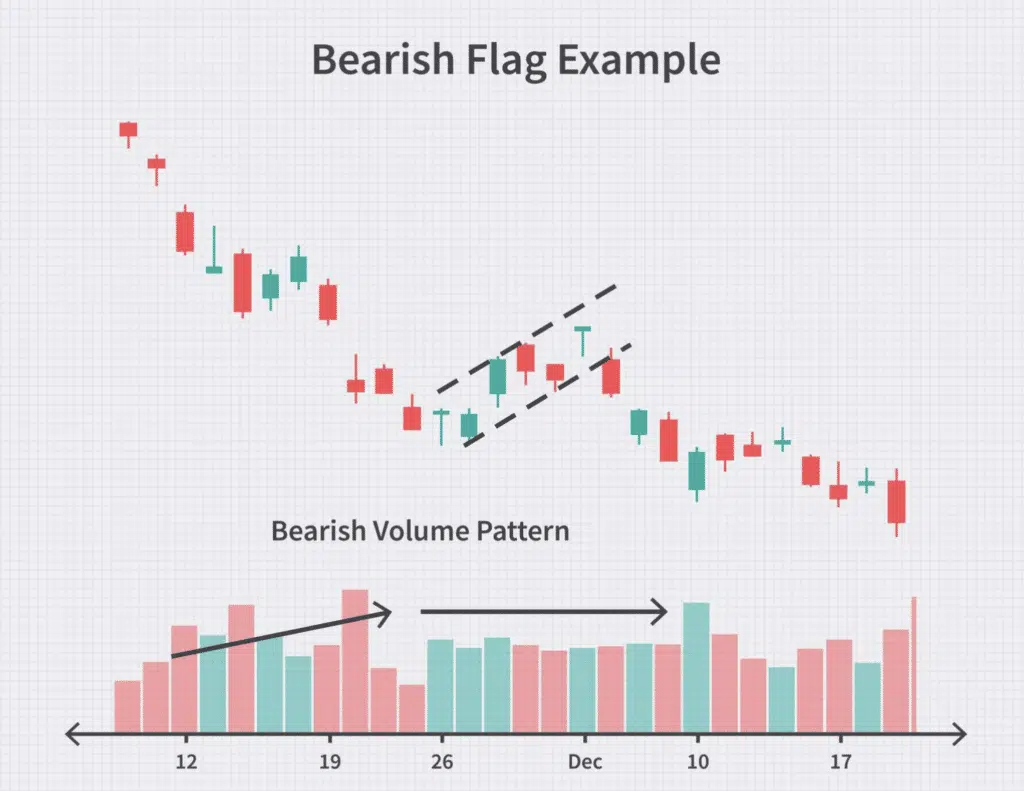
The architecture of bullish and bearish patterns are identical, however the trend direction and volume pattern change somewhat. In the previous trend, the bullish volume pattern grows, but in the consolidation, it decreases. A bearish volume pattern, on the other hand, grows initially and then tends to maintain level since negative tendencies tend to expand in volume as time passes.
3. Flag Pattern Examples
The price movement in this bullish flag pattern rises during the first trend move and then decreases through the consolidation period. Although a big volume rise is not necessarily associated with a breakout, analysts and traders want to see one since it indicates that investors and other traders have joined the stock in a fresh wave of excitement.
Volume does not usually decrease during the consolidation phase of a bearish flag formation. This is because negative, downward trending price movements are often driven by investor fear and worry about dropping prices. The farther prices fall, the more compelled surviving investors are to act.
As a result, these trades have higher-than-average (and growing) volume patterns. When the price stops falling, the growing volume may not fall, but rather remain stable, signaling a respite in the anxiety levels. Because volume is already high, the downward breakout may be less prominent than the upward breakout in a bullish pattern.
4. The best time to trade Flag pattern
In my view, there are two situations when trading these patterns is advantageous:
4.1 When the market had just broken out
Assume the market was in a range before eventually breaking down. When it breaks down, the initial retreat is the ideal moment to trade the Flag pattern. When a bearish flag pattern forms, it is the optimum moment to trade the Flag pattern.
Why is this the case?
Because traders who missed the rally will be looking for a pullback.
You can bet that as the market pulls back during the formation of this flag pattern, there will be traders wanting to short this market after missing the previous move. So they’re attempting to capitalize on the trend!
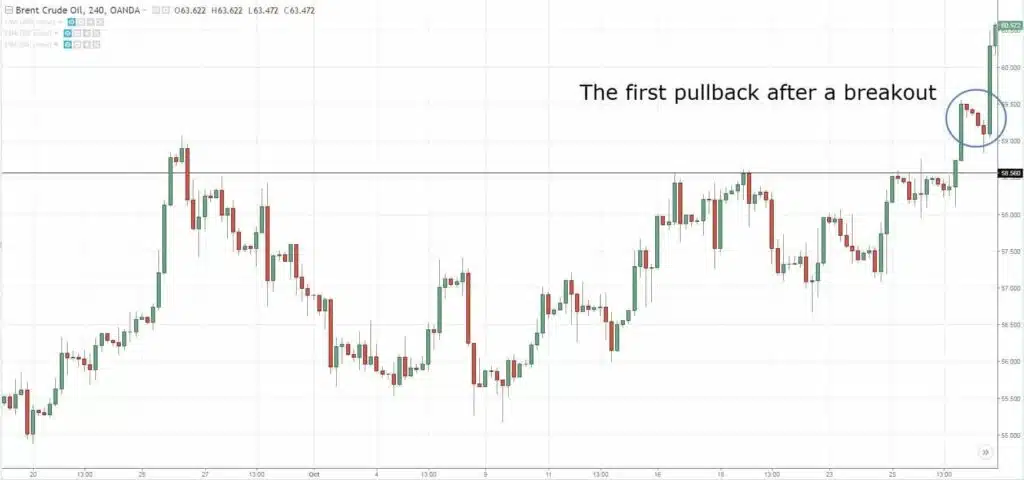
This is why, after a market breakthrough, I like to trade the first retreat or the first flag pattern.
Here’s an example:
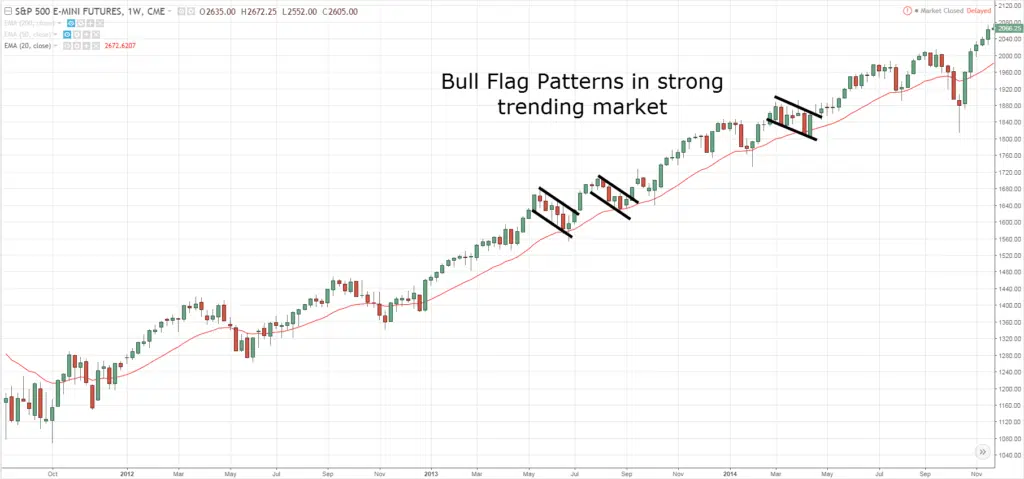
4.2 Market is strongly trending
There is a trending move and a pullback moving move or pullback in a strong trending market. When the market is firmly trending and trading above the 20-period moving average… All of them are potential possibilities to trade a flag pattern retreat!
This is what I mean:
5. The bottom line
While no one can predict whether the market surge will continue or reverse, traders should pay attention to price activity and let the probability do the rest. While all chart patterns are prone to misleading signals and unexpected changes, bullish flags are among the most dependable and effective.
In order to make the best decisions, it is important to equip yourself not only with fundamental knowledge but also with supportive tools that can serve as excellent guides.
What do you think? Please feel free to share your comments!
Find this article useful? Share this blog with your friends on social media!


