What is trading volume? Volume reveals market participation intensity – yet 70% of retail traders ignore this powerful indicator. Learn how to employ volume analysis for trend confirmation, reversal detection, and improved trade timing.
Table of Contents
1. What is Trading Volume? Definition and Key Strategies
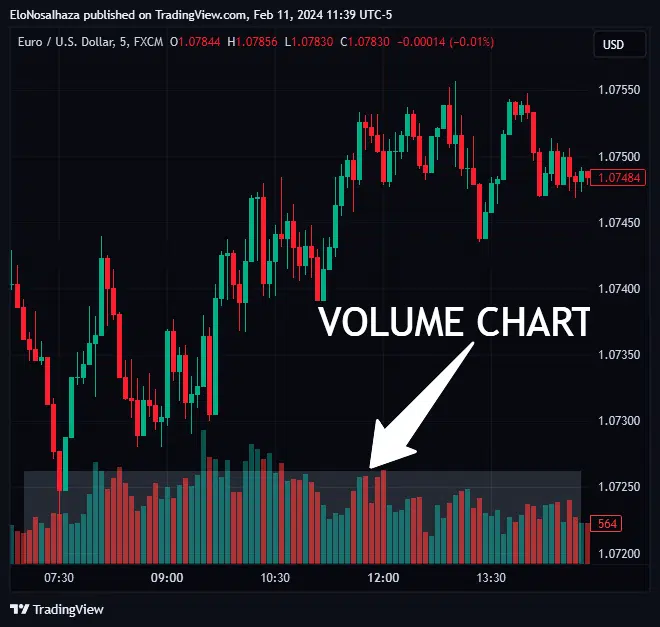
What is trading volume in simple terms? In the financial sphere, trading (or market) volume represents the total shares or contracts traded in a defined period. It’s the most fundamental measure of market activity and participation.
📊 PRACTICAL EXAMPLE: If 500 traders each buy 100 shares of Apple stock while 500 sellers each sell 100 shares, what is trading volume in this scenario? It’s 100,000 shares, not 50,000. Every transaction counts twice: once for the buyer and once for the seller.
Stocks, bonds, commodities, options, and futures contract traders desire this data the most for insightful analysis. However, exchanges report volumes on almost every financial market.
Understanding what is trading volume helps traders measure a security or market’s activity quickly. Hence, traders use it and its several derivatives for forecasts.
Key Volume Trading Strategies
Now that we understand what trading volume is, let’s explore how professional traders use this data for profitable decision-making.
Strategy #1: Trend Confirmation
As a general rule of thumb, trading volume can help confirm a trend’s strength when both move in tandem for a significant period. In essence, if the price is falling, the volume should decrease. However, in a sustained bullish trend, it should rise proportionately.
✅ What to Look For:
- Uptrend + Rising Volume = Strong bullish momentum
- Downtrend + Rising Volume = Strong bearish momentum
- Price movement + Declining Volume = Weakening trend (potential reversal ahead)
Strategy #2: Reversal Detection
The market volume also confirms reversal expectations due to reduced activity. Proponents consider trends (regardless of how promising they appear) weak when their moves don’t correlate with a security’s price. Thus, traders take any continuation signal with a grain of salt, waiting for a retracement or reversal.

Strategy #3: Volume Breakouts
Analysts also anticipate and make forecasts with volume breakouts – periods when the figures exceed average values or pre-defined thresholds.
What is trading volume telling us during breakouts? A price breakout accompanied by 2-3x average volume suggests genuine momentum, while low-volume breakouts often fail.
Popular Volume-Based Indicators
When traders ask “what is trading volume analysis,” they’re often referring to these specialized volume technical tools:
- Volume Oscillator: Compares two volume-based Moving Averages (MAs) to signify significant volume changes
- On-Balance Volume (OBV): Cumulative indicator showing buying/selling pressure
- Chaikin Money Flow (CMF): Measures money flow volume over a specific period
Volume oscillators may compare fast- and slow-moving MAs, with the difference resulting in a histogram and overbought-oversold levels. Like most indicators, they require extensive study and testing before application in live markets.
2. Notable Elements of Volume Trading
Before asking “what is trading volume good for,” ambitious traders should understand both its advantages and limitations. Here are the key elements for improved understanding and application:
2.1 Trading Volume's Objectivity
When people ask “what is trading volume data based on,” the answer is simple: pure, verifiable numbers. Volume is significantly more objective than other data sources typically employed for analysis.
Exchanges report them periodically per trading session, easily accessible on their website and trading platforms. Financial news and third-party websites also cover the volume of popular instruments. Unlike subjective indicators like sentiment or chart patterns, volume data is raw, unfiltered, and universally agreed upon.
2.2 Easy Scalability
Market volume strategies can work across several financial markets and timeframes, provided the data remains available.
Therefore, they suit numerous trading disciplines and preferences – a massive perk for discovering opportunities in every trading session. Whether you’re a day trader analyzing 5-minute charts or a swing trader examining daily patterns, volume principles remain consistent.
2.3 Complexity
If you’re wondering “what is trading volume analysis complexity,” be prepared for a learning curve. Volume analysis is undeniably complex for neophytes hoping to gain the most from the values.

Here are a few common pitfalls:
- Misinterpreting low volume as bearish (it can simply indicate consolidation)
- Ignoring relative volume (today’s volume compared to 20-day average matters more than absolute numbers)
- Overlooking market context (holiday trading naturally shows lower volume)
Time and experience in a simulated environment are crucial requirements. Understandably, many take extensive courses or proven mentorships for consolidated know-how. Failure to familiarize oneself with the concepts has severe consequences
2.4 Complement to Other Indicators
One significant discovery in thorough volume studies reveals that the values work best in a pre-existing strategy.
Utilizing it as a stand-alone signal is never advisable.
In technical analysis, volume strategies can supplement Moving Average or chart pattern signals. It can also mold fundamental analysts’ expectations of real-world events and their impact. For instance, combining volume analysis with support/resistance levels can dramatically improve entry and exit timing.
2.5 Susceptibility to False Signals
No matter the hype, volume analysis is never free from false signals – a bitter pill for green-horn traders.
The markets are always prone to manipulation; indicators may lag during massive fluctuations, and popular sources may report wrong values. Large institutional trades, algorithmic trading, and low-liquidity periods can all distort volume readings.
Hence, unify any volume strategy with strict risk management rules.
3. Deploying the Volume Force PRO for Expert Analysis
After learning what is trading volume and how to analyze it, retail traders can leverage market volume in several inventive ways for exceptional results. However, only a few discuss its setbacks, including the complexity and possibility of false signals.
One of the most recommended solutions is the Volume Force PRO indicator for TradingView.
Its trailblazing operation stems from the market volume and candlesticks’ price points in the desired timeframe.
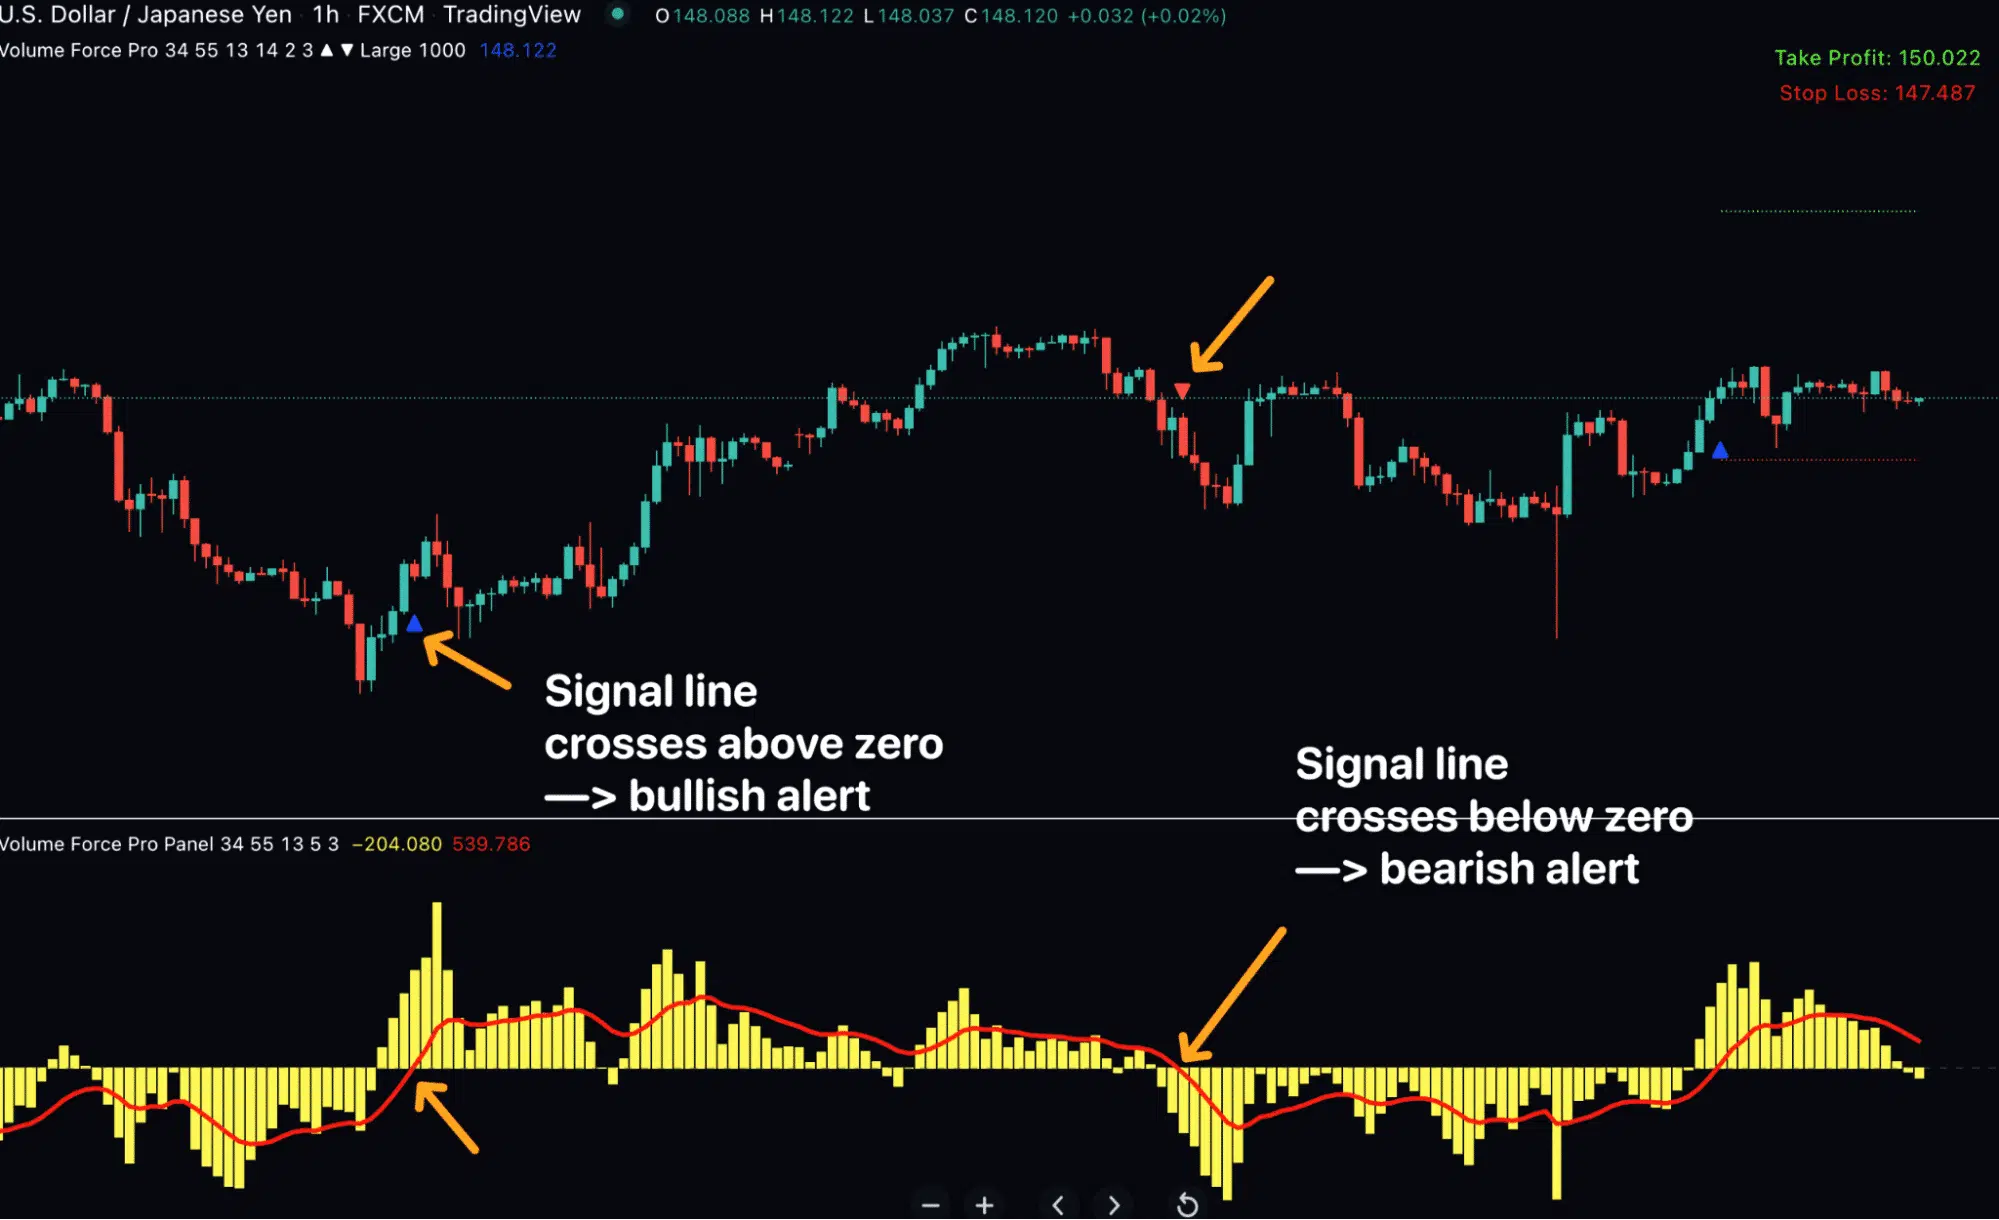
For traders still asking “what is trading volume’s practical application,” this tool demonstrates real-world usage. Simply, below are a few of several advantages users relish from the tool:
- ✓ Earliest awareness of an imminent bullish or bearish trend
- ✓ Knowledge of the best chart points to place profit and stop orders
- ✓ Freedom to engage in any market or timeframe desired
- ✓ Confidence of never missing promising opportunities due to timely reminders
Doubt it? Confirm these and more perks to forecast with trading volume here.
4. Frequently Asked Questions
Q: What is trading volume in stocks?
A: It’s the total number of shares bought and sold during a specific period, measuring market activity and liquidity.
Q: What is trading volume used for?
A: Traders use volume to confirm trends, detect reversals, identify breakouts, and gauge market conviction behind price moves.
Q: What is trading volume indicator?
A: Volume indicators are technical tools like OBV, Volume Oscillator, and CMF that analyze volume data to generate trading signals.
Q: What is trading volume compared to average volume?
A: Relative volume compares current volume to the average (typically 20-day), helping identify unusually high or low activity periods.
Volume’s scalability and objective nature make it one of the most reliable signal generators. However, since traders battle with setbacks like false signals and manipulation, the Volume Force PRO indicator (one of its several derivatives) is highly recommended.