Why do most volume indicators fail at breakout trading? They can’t distinguish institutional pressure from retail noise. Volume Breaker is designed to solve that problem by revealing true accumulation and distribution before price moves.
Table of Contents
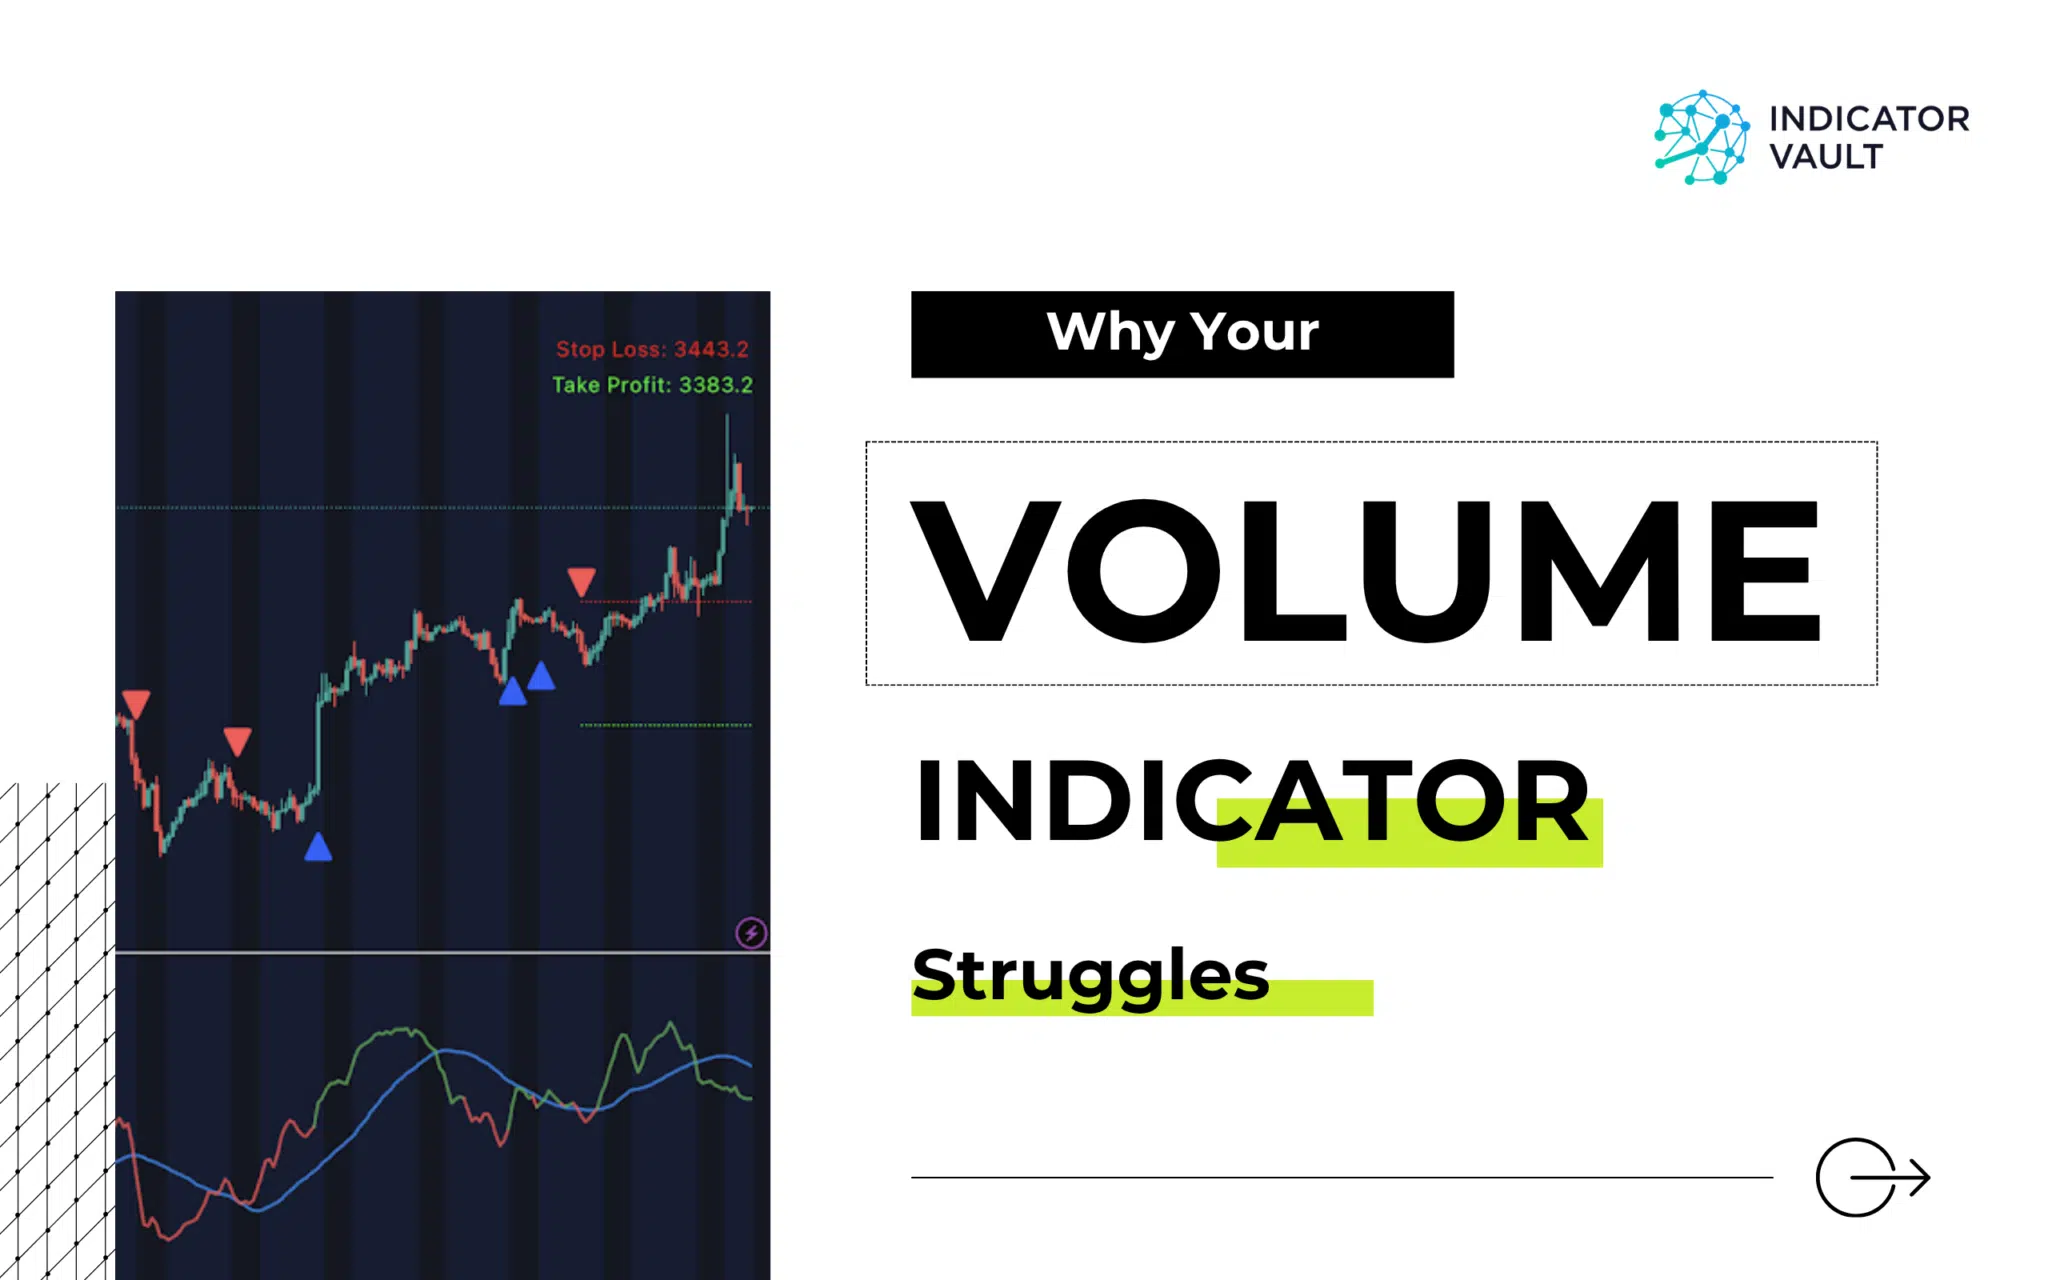
1. The Problem With Standard Volume Indicators
The typical volume indicator shows ONE thing: how much trading happened.
But it can’t tell you:
- Was that buying or selling volume?
- Is this institutional accumulation or retail panic?
- Is this pressure building toward a breakout, or just noise?
A volume spike during a breakout could mean two completely different things:
Scenario 1: Institutions have been quietly accumulating for hours. The breakout is the START of their move. (This is what you want.)
Scenario 2: Institutions are dumping on retail breakout chasers. The breakout is the END of the move. (This is what destroys accounts.)
Standard volume indicators can’t tell the difference. They show the same green or red bar for both scenarios.
Volume Breaker was built specifically to solve this flaw.
2. What Professional Traders Know About Volume
Institutional traders don’t look at volume the way retail traders do.
They track something called “volume pressure” – the cumulative difference between buying and selling pressure over time.
Think of it like water building behind a dam:
- Each day of positive volume (price up + volume) adds pressure
- Each day of negative volume (price down + volume) releases pressure
- When pressure reaches critical levels, the dam breaks
This is why professionals can spot breakouts BEFORE they happen, while retail traders are always reacting after the fact.
This is also the logic behind Volume Breaker. Instead of reacting to a spike, Volume Breaker measures underlying pressure before the breakout.
3. Why Volume Breaker Actually Works
The solution lies in a volume indicator that works the way institutional traders think about volume.
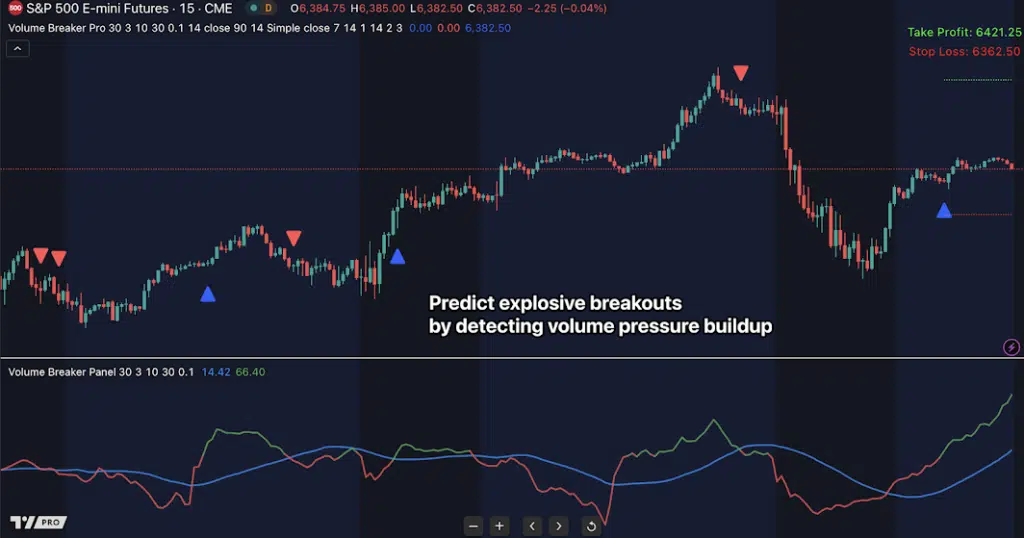
Volume Breaker for TradingView calculates institutional volume pressure buildup in real-time.
Unlike traditional volume indicators that just show bars, Volume Breaker:
- Detects pressure building BEFORE breakouts
- Classifies volume as positive (buying) or negative (selling)
- Only alerts when institutional accumulation reaches critical levels
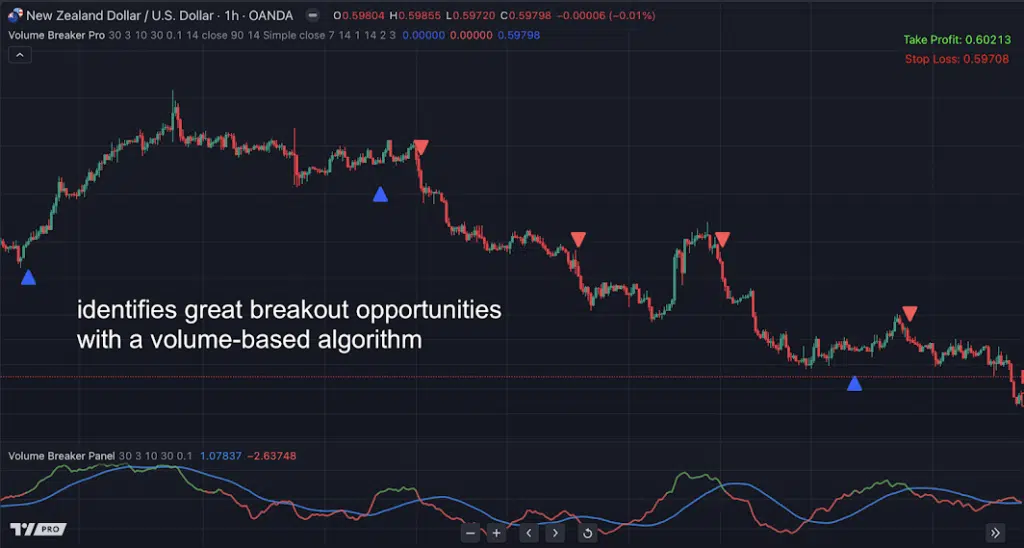
- Enables traders to predict breakouts
4. How Volume Breaker Works Like A Gem
Volume Breaker operates on a fundamentally different principle than standard volume indicators. Instead of just measuring volume, it reveals institutional intent. Here’s what that means for your trading:
4.1 Separates Smart Money From Dumb Money
Traditional volume indicators lump all trading activity together. Volume Breaker classifies every session as either positive volume (buying pressure on up days), negative volume (selling pressure on down days), or neutral volume (ignored).
What this means for you: Stop getting faked out by retail panic selling or FOMO buying. See only the volume that matters – institutional accumulation and distribution.
4.2 Detects Pressure Before Price Moves
While standard volume indicators react to what already happened, Volume Breaker calculates the normalized difference between buying and selling pressure over 30-40 days, then smooths it to reveal building momentum.
What this means for you: Enter breakout trades at the beginning, not the end. Position yourself alongside institutions before the crowd notices, giving you better entries and bigger profit potential.
4.3 Filters Out False Breakouts Automatically
The indicator only signals when institutional volume pressure crosses critical thresholds (+10 default) AND meets multiple confirmation criteria including RSI positioning and moving average alignment.
What this means for you: Dramatically fewer false signals compared to traditional volume indicators. Trade only the highest-probability setups where institutional money is actually flowing, not just price testing levels.
5. How to Trade With Volume Breaker (Actionable Guide)
Understanding the concept is one thing. Executing profitable trades is another. Here’s what you actually need to do:
Step 1: Add the Indicator and Mark Your Levels
Add Volume Breaker to your TradingView chart. Mark your key support and resistance levels where price typically consolidates. That’s it for setup.
Step 2: Watch for Pressure Building at Key Levels
When the price reaches your marked levels and consolidates, simply watch the Volume Breaker line. If it’s climbing toward +10, institutions are accumulating. If it stays flat or drops, they’re not interested.
Step 3: Enter When Threshold Crosses +10
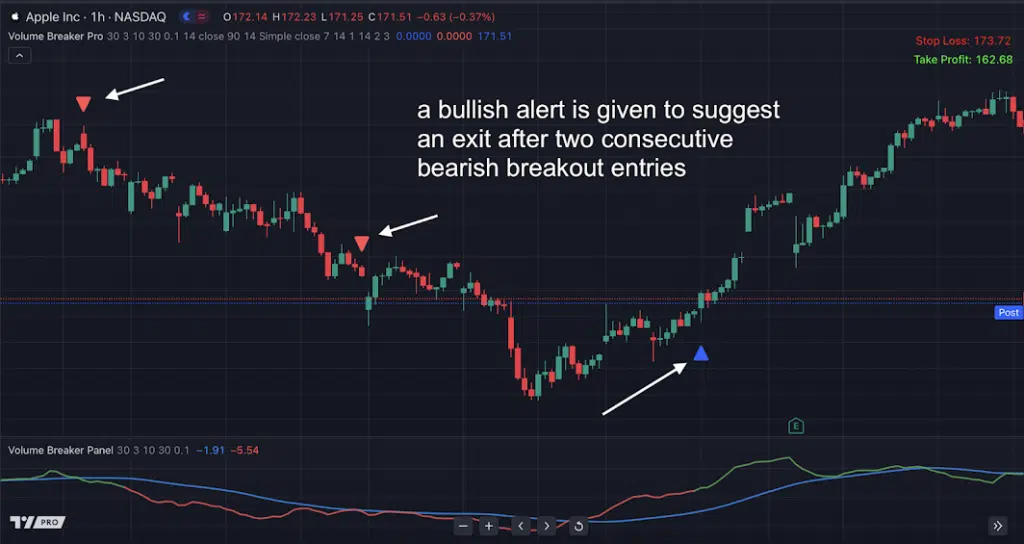
When all requirements are met – institutional pressure crosses +10, RSI aligns, and moving averages confirm – the indicator prints an arrow alert directly on your chart.
Place your stop below the consolidation zone (for long trades) or above it (for short trades).
Step 4: Take Profits at Logical Levels
Exit 30-50% at the first resistance level. Trail the rest using your preferred method or watch for the Volume Breaker line declining sharply – that’s institutions exiting.
6. The Bottom Line
Standard volume indicators show what HAPPENED. Volume Breaker shows what’s ABOUT TO HAPPEN.
The difference between those two things? That’s the difference between consistently losing on fake breakouts and consistently profiting on real ones.
Traditional volume indicators keep traders stuck in the cycle of chasing breakouts and getting trapped. Volume Breaker breaks that cycle by revealing institutional activity before the price explodes.