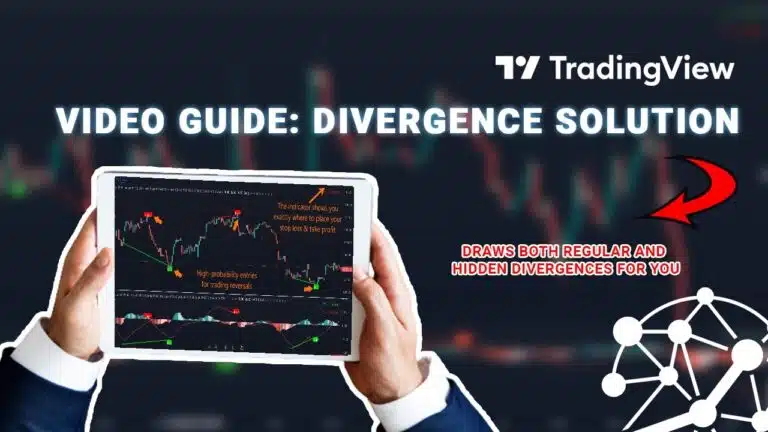
Power of Trading Divergence: Your Path to Smarter, More Profitable Trades
|

Power of Trading Divergence: Your Path to Smarter, More Profitable Trades

Table of Contents 1. The importance of trading divergence in your success Divergence occurs when the price moves in the opposite direction of a technical indicator, such as the Relative Strength Index (RSI), Moving Average Convergence Divergence (MACD), or Stochastic Oscillator. This difference can be a sign that the trend is losing strength or might…

Decoding Leading vs Lagging Indicators: 4 Game-Changing Tips Beginners Can’t Miss!
|

Decoding Leading vs Lagging Indicators: 4 Game-Changing Tips Beginners Can’t Miss!

Understanding the difference between leading vs lagging indicators is of significant value in any technical analysis strategy. This classification ensures a detailed understanding of market momentum and trend maturity during profit exploitation. But what exactly are leading vs lagging indicators? How can a trader make the most of them to anticipate moves versus confirming them?…

Video guide: A-RSI indicator for Tradingview 2.0

Video guide: A-RSI indicator for Tradingview 2.0

Have you ever looked at a trading chart, using your trusty RSI, but felt like you were always a step behind, or overwhelmed by confusing signals that just led to missed opportunities? You’re not alone. Manually identifying genuine turning points and differentiating between real signals and noise with traditional RSI can be incredibly difficult and…

RSI Divergence: Use RSI Also for Strong Reversals
|

RSI Divergence: Use RSI Also for Strong Reversals

The upgraded A-RSI indicator reveals both pullback entries and full-blown reversals using RSI divergence — so you can trade ahead of the trend, not behind it. Table of Contents 1. Think RSI Is Just for Pullbacks? Think Again Most traders use RSI to catch oversold dips in an uptrend… or to short overbought spikes in…

Crypto Indicators Guide: Dominating Crypto and Forex Trading With Smarter Strategies
| |

Crypto Indicators Guide: Dominating Crypto and Forex Trading With Smarter Strategies

Nowadays, crypto indicators are essential tools for traders navigating both crypto and forex markets. In this guide, discover how crypto indicators and proven trading strategies help professionals analyze volatility, spot opportunities, and trade both markets effectively. Table of Contents 1. Introduction The endless buzz around crypto and forex trading stirs ambitious questions regarding juggling both…

Video guide: Candlestick Pattern Pro for TradingView 2.0

Video guide: Candlestick Pattern Pro for TradingView 2.0

Have you ever looked at a trading chart, knowing candlestick patterns hold powerful clues, but felt overwhelmed trying to spot them in real-time? You’re not alone. Manually identifying dozens of complex patterns, often in fast-moving markets, can be incredibly difficult and time-consuming. You end up missing key entries or getting faked out by unreliable signals….

Simplify Candlestick Patterns Analysis and Easily Capture Price Moves
|

Simplify Candlestick Patterns Analysis and Easily Capture Price Moves

Apply the power of detecting over 30 candlestick patterns instantly on your chart with the Candlestick Pattern Pro indicator. Perfect for traders looking to spot trend reversals and continuations. Table of Contents 1. What are exactly candlestick patterns? Candlestick patterns are one of the most reliable tools in technical analysis. These patterns help you identify…

Day Trading vs Position Trading: Pros, Cons, & The Ultimate Guide to Your Winning Strategy

Day Trading vs Position Trading: Pros, Cons, & The Ultimate Guide to Your Winning Strategy

Table of Contents 1. Introduction One of the most critical questions to answer in any novel trading journey deals with one’s preferred strategy, duration-wise. Day trading and position trading are two distinct approaches from the limited options, but which method suits one best? Are there any pros or cons with either option? This article answers…