


Harmonic patterns can help traders find unique opportunities, like price movements and key turning or trend reversal points. Harmonic is a precise trading strategy, but mastery of these patterns takes time, effort, and study.
Harmonic patterns are geometric price patterns that utilize Fibonacci numbers to predict future movements. Using these patterns, you are able to define precise turning points, retracements, and extensions, as well as a series of swing high and swing low points.
To be considered a Harmonic pattern, the price movement of the pattern must follow the Fibonacci ratio relationships and its symmetry in markets. Such a complicated pattern provides extremely reliable information on price entries, stop-loss, and take-profit levels.
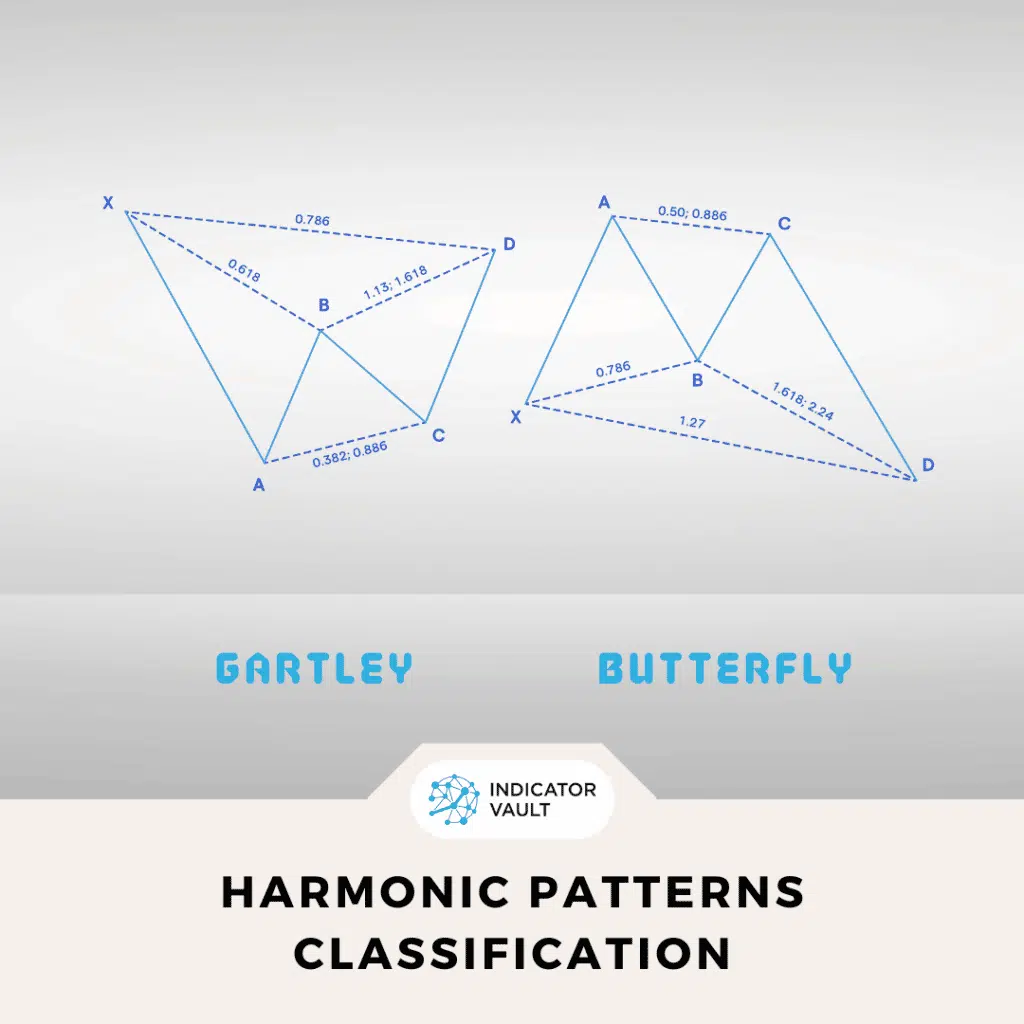
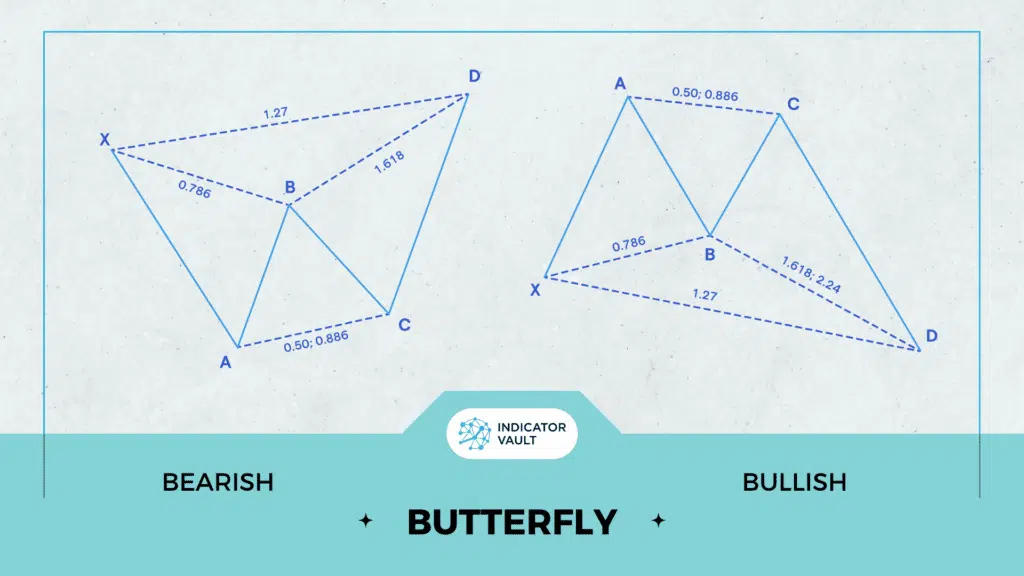
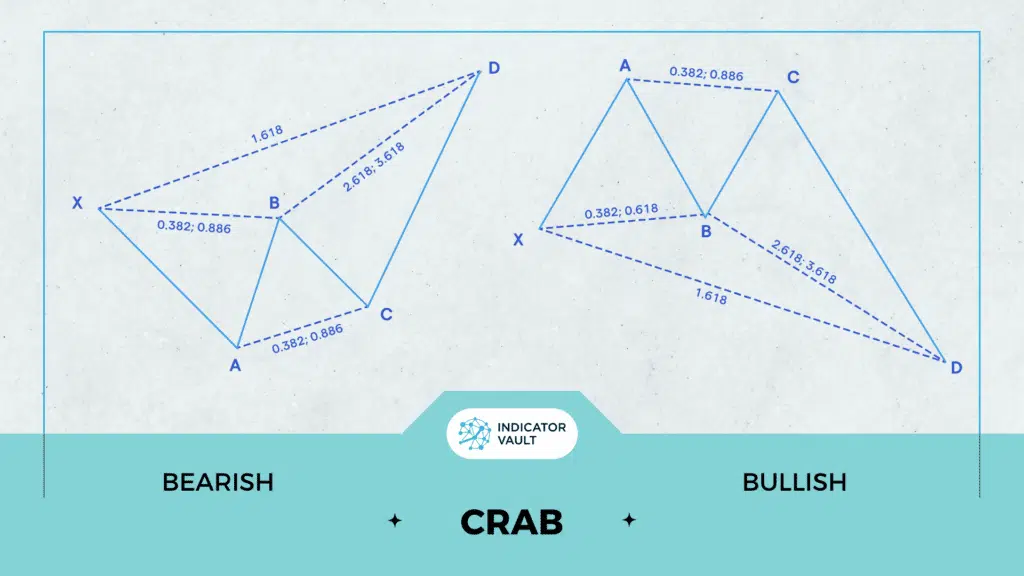
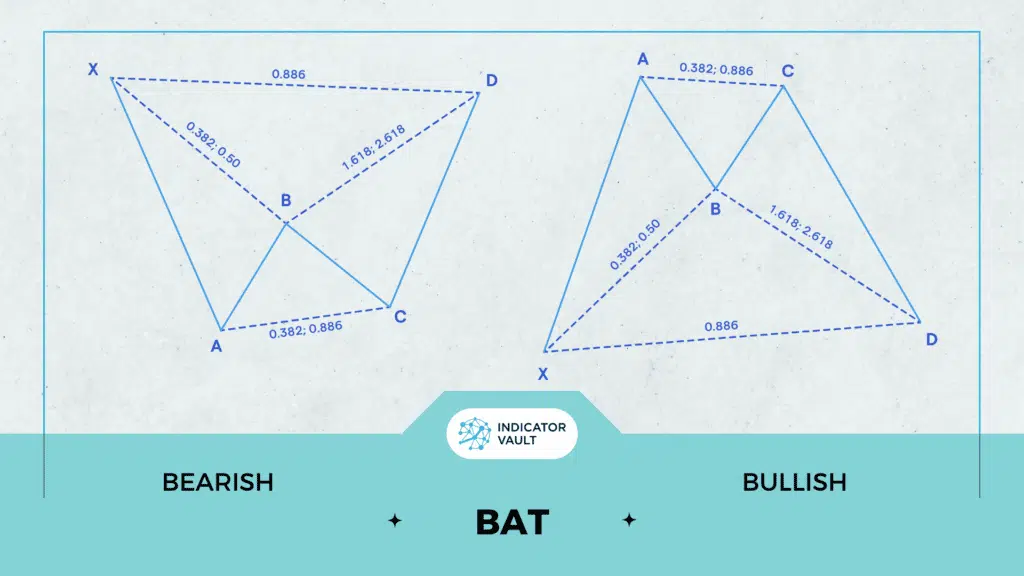
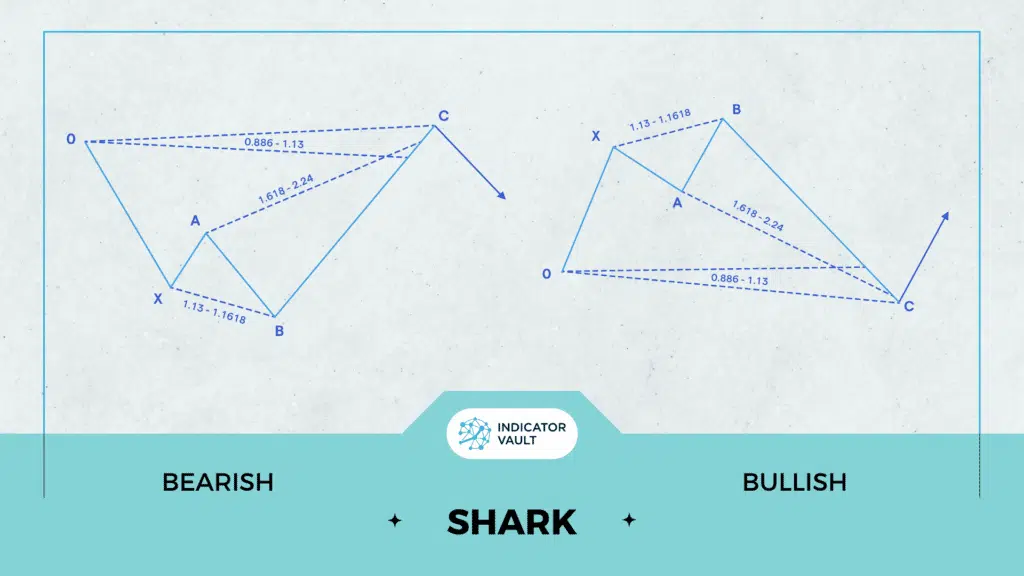
There is a wide variety of harmonic price patterns, but the 5-point patterns tend to be the most popular and may be used to recognize different types of trends. These patterns include: Gartley, Butterfly, Crab, Bat, Shark, and Cypher.
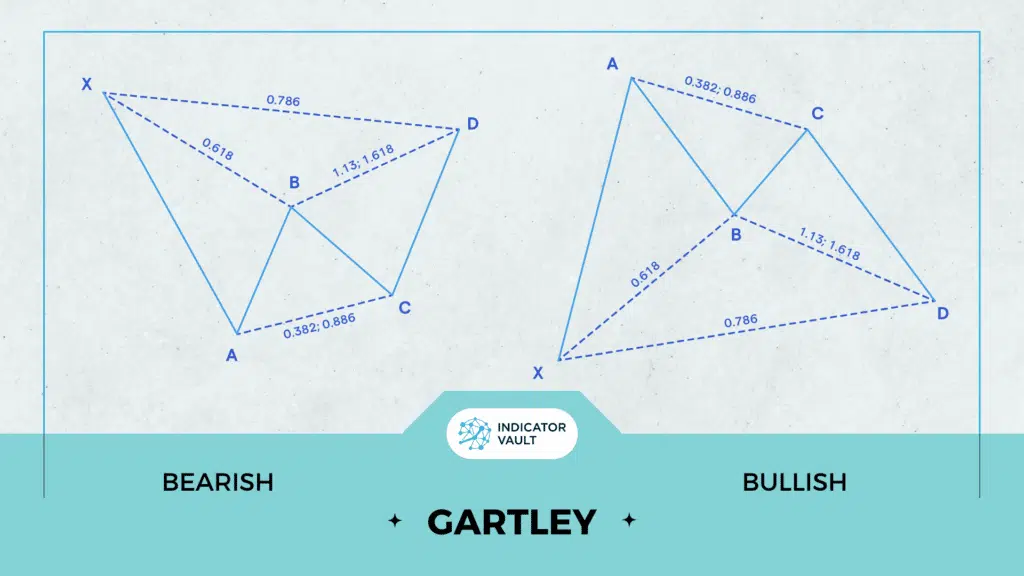
There are commonalities in the structure and concepts shared by all 5-point harmonic patterns. The ratio of their leg lengths and the position of their key nodes (X, A, B, C, D) are two significant ways in which they vary.
To help you see the patterns more clearly, I’ve included some pictures of them.
It is possible to mistake a common pattern for a harmonic price pattern due to a mismatch of Fibonacci levels, which would make harmonic analysis predictions wrong. Also, as mentioned earlier, spotting these patterns takes time and effort, which can lower your performance in trading.
Rather than trying to locate harmonic price patterns by yourself, it is recommended that you use automatic pattern recognition software to assist you in capturing these patterns.
You may utilize the Harmonic Pattern Pro indicator for TradingView, which is one of the suggested tools. As its name implies, this indicator can:
With this indicator in your toolkit, harmonic patterns will be automatically detected in real-time, so no more waiting and confusion.
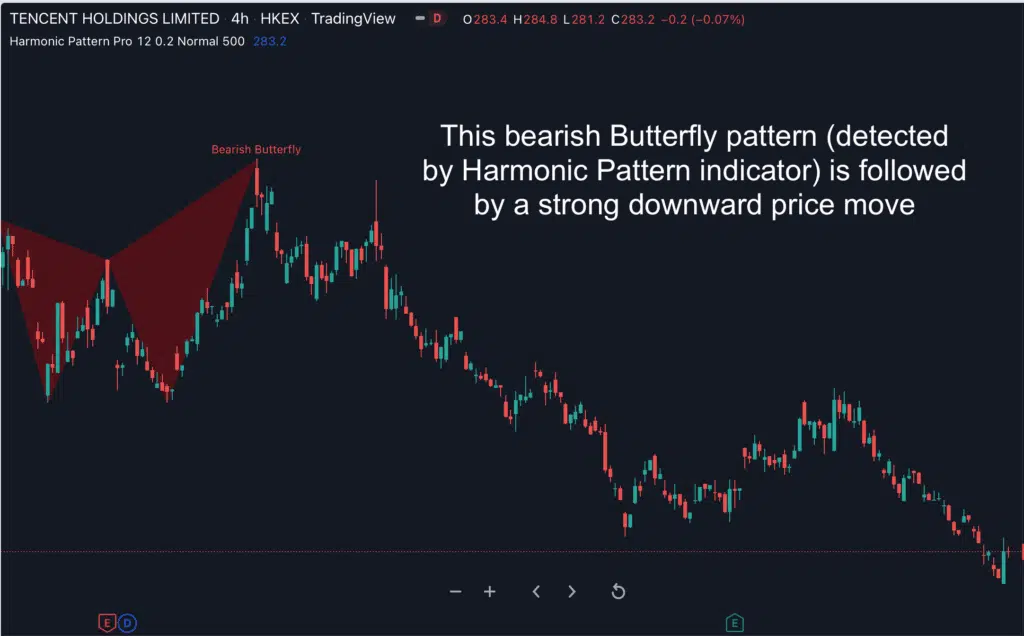
Spotting such a pattern is the first step in harmonic trading. Recognizing harmonic price patterns takes some training and experience, thus an automated pattern identification tool like the Harmonic Pattern Pro indicator can be helpful.
When trading a harmonic price pattern, the “D” point in the reversal zone is often where trade entries occur. Depending on the formation, it might be a Buy (in bullish patterns) or a Sell (in bearish patterns).
As long as the pattern is valid and the underlying trend is in agreement with the harmonic pattern reversal, you can determine Entry levels using price ranges, volatility, or some combination.
Place stop-loss above or below the previous major turning point (the D point in 5-point patterns). For the bullish pattern, SL should be below D and above D for bearish patterns.
Harmonic trading is a method that aims to predict future market movements by utilizing Fibonacci numbers. You can use these patterns to detect precise reversal points.
By spotting and identifying harmonic patterns, you are able to predict the duration of ongoing price trends and capture potential turning points. Using the Harmonic Pattern Pro indicator helps you quickly spot all important harmonic patterns, saving time and effort.
If you want to discover more incredible indicators like this, check out Indicator Vault’s other articles in our blog:
Also, follow us for all the promotions and other useful topics: