
Master Pullbacks: Spot the End, Enter with Confidence.
Powered by a volatility-based algorithm, the Pullback Factor Indicator detects when pullbacks end, helping you trade confidently without second-guessing.
In trading, a pullback refers to a temporary reversal in the direction of the price movement within a larger trend. Imagine a mountain climber ascending a steep slope: occasionally, they may need to pause and catch their breath before continuing their climb. Similarly, markets often experience pullbacks—short-term dips in price that can lead to significant buying opportunities when the trend resumes. Understanding pullbacks is crucial for traders who want to maximize profits while minimizing risks.
Identifying the end of a pullback can be one of the most challenging aspects of trading. Traditional indicators often lag and can leave you second-guessing your decisions. This is where the Pullback Factor Indicator shines.
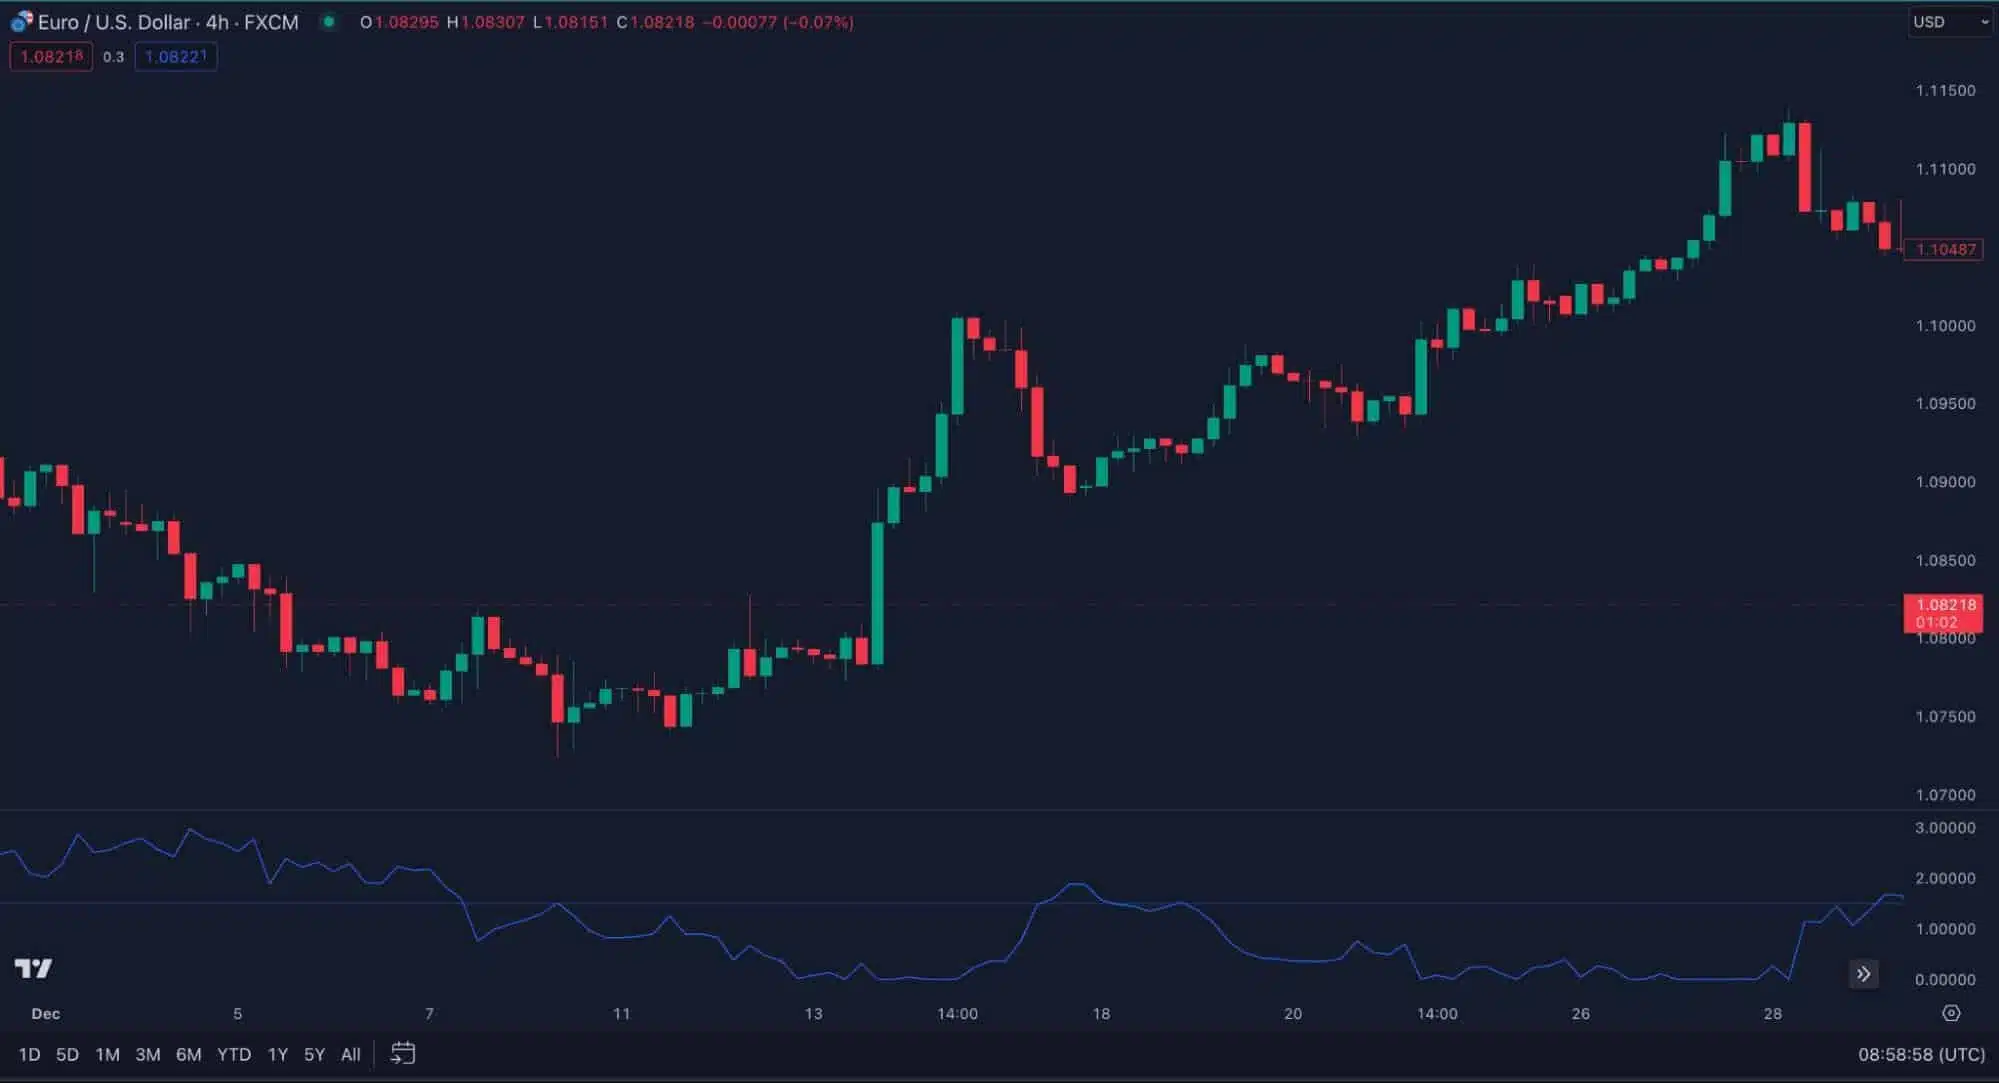
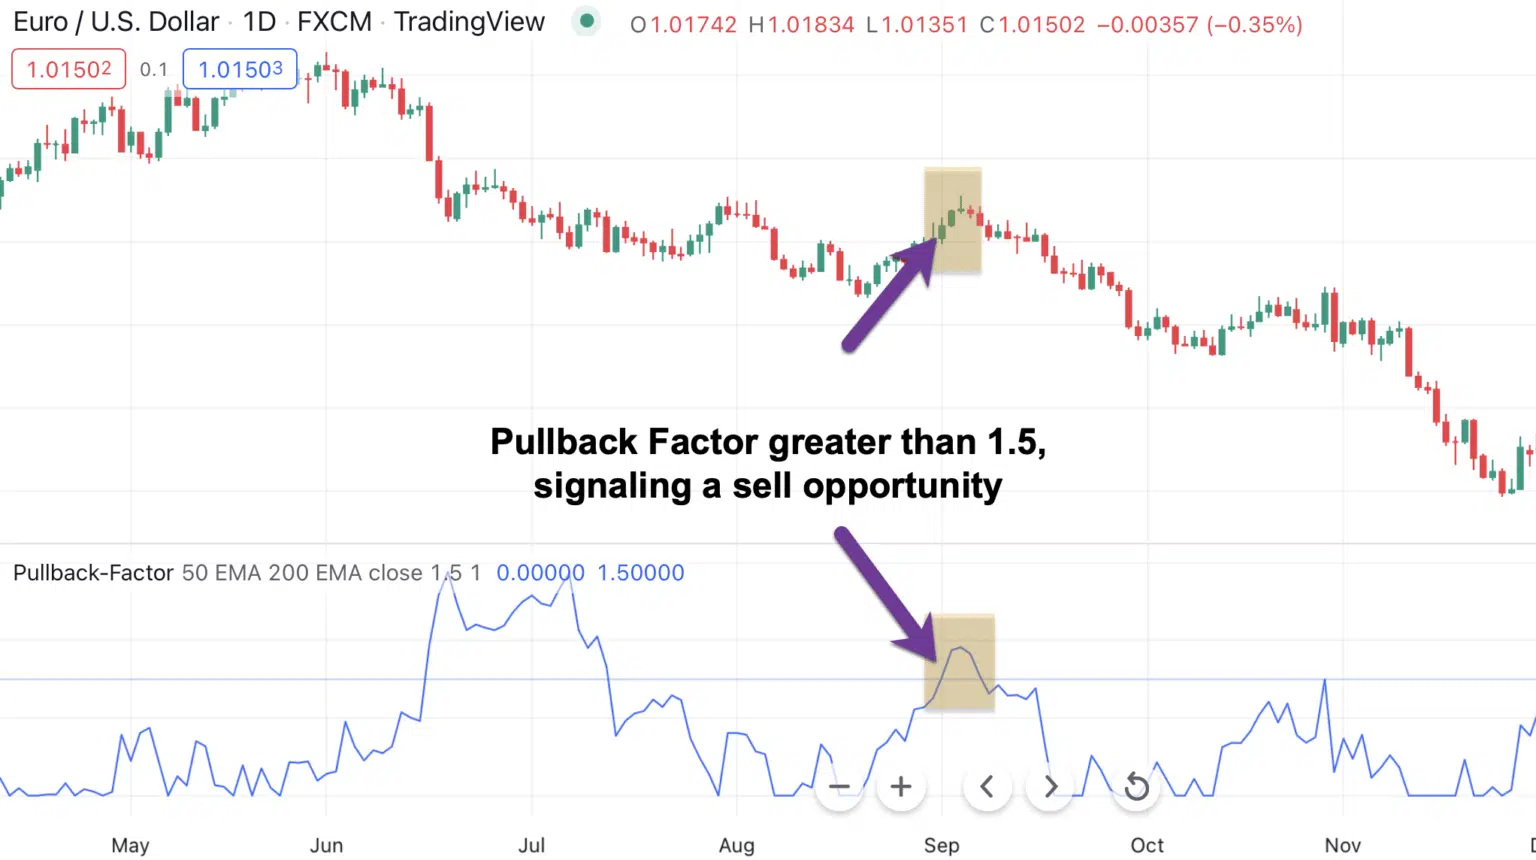
By utilizing a sophisticated volatility-based algorithm, the Pullback Factor Indicator provides clear signals when a pullback is likely coming to an end. With a simple value threshold (greater than 1.5), you can gain confidence in your trading decisions. Statistical testing shows that when the Pullback Factor indicates a pullback is complete, there’s a high probability that the original trend will resume immediately.
Imagine This Scenario:
You’re in an uptrend, and the price starts to pull back. Instead of wondering when to enter, you glance at the Pullback Factor. The indicator reads 1.6, signaling that the pullback is nearing its end. You don’t just guess; you act with confidence, knowing your chances of success are significantly higher.
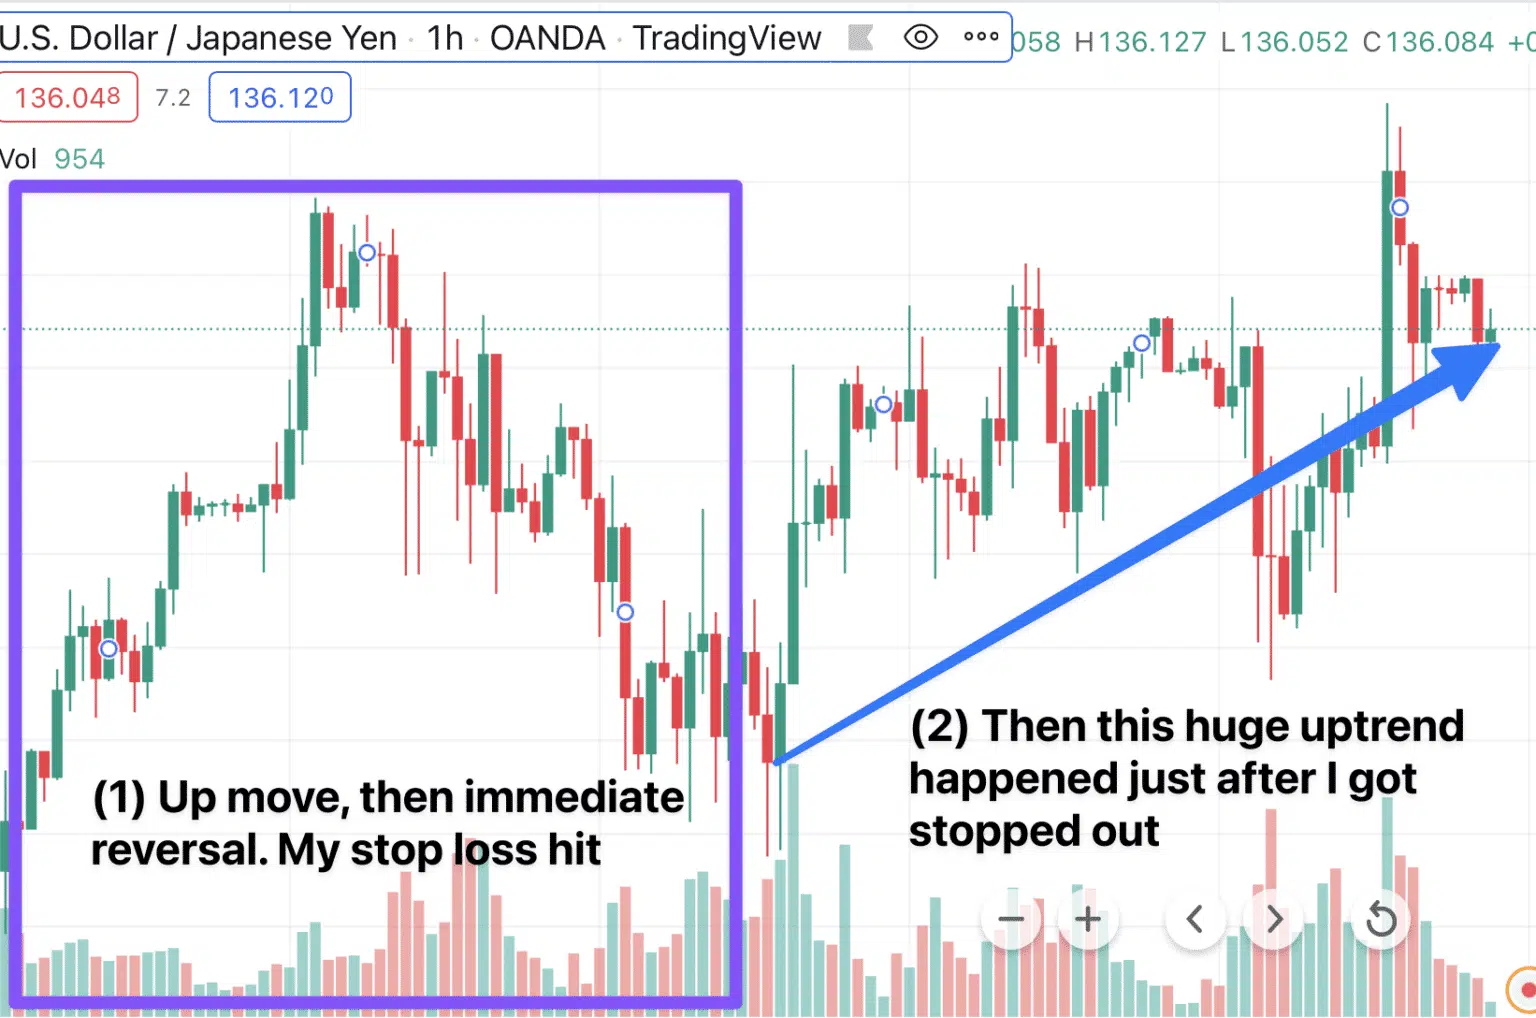
Timing is everything in trading. Entering too early can lead to getting stopped out, while waiting too long might cause you to miss out on profitable opportunities. The Pullback Factor Indicator eliminates that uncertainty.
By precisely identifying when a pullback is over, you can enter the trend at the optimal moment. No more second-guessing or missed opportunities! With this indicator, you’ll be equipped to ride the wave of momentum and secure your profits.
The Pullback Factor Indicator is your ticket to entering trends with precision. Click here to see this indicator in action.
Table of Contents 1. Say Goodbye to Outdated Concepts Are you tired of missing out on profitable trades because you relied on outdated support and resistance levels? Have you faced the frustration of blowing your account due to lagging indicators? You’re not alone. It’s time to leave those archaic 1920s concepts behind and embrace the…

Pullbacks happen all the time, and knowing how to apply useful pullback trading strategies can bring you big benefits. Table of Contents 1. Pullback Trading A pullback is a short-term, temporary pause or moderate drop in the direction of the current bullish or bearish trend. This phrase is commonly used to describe price changes in…

‘Market structure trading,’ a popular jargon in trading circles, may sound puzzling to newbies. Dive into this article today for its definition, types, & significance. Table of Contents 1. Introduction Market structure is one of the most reliable frameworks in technical analysis because it reveals the true rhythm of the market. Instead of reacting emotionally…
Table of Contents 1. Introduction One of the finest discoveries of technical analysis, the Supply Demand Pro, has proven successful among veteran and novice trading circles. Although functional as a stand-alone system, many may prefer more extensive combos for improved accuracy. This concise article shares a few such combination techniques with traditional indicators. Readers will…

What is a candlestick and why does it matter in trading? Technical analysts rely on candlestick charts and candlestick patterns to help them time their trades and see how investors’ emotions affect price movements. Based on a method established in Japan in the 1700s for monitoring rice prices, candlestick charting remains one of the most…

The Relative Strength Index (RSI) is one of the most widely used and trusted momentum indicators in technical analysis. While powerful, RSI often suffers from false signals, lag, and whipsaws that can frustrate traders. Learn how the RSI trading strategy works, what its biggest limitations are, and how the A-RSI indicator overcomes these challenges to…