Most trend trading strategies lose money because they’re based on yesterday’s price action. Discover how two-level linear regression predicts tomorrow’s trends before they happen.
Table of Contents
1. The Costly Lesson That Changed Everything About Trend Trading
Here’s the uncomfortable truth:
Moving averages calculate the average of past prices. You’re literally making trend trading decisions based on what the market did, not what it’s going to do.
You’re driving forward while staring in the rearview mirror.
And here’s the brutal reality most enthusiasts refuse to accept:
78% of trend trading signals in sideways markets are completely false.
Your favorite MA crossover system for trend trading? It’s crossing constantly, triggering trade after trade, slowly grinding your account into dust while you watch helplessly.
But what if there was a mathematical way to predict where trends are heading before they get there?
What if you could revolutionize your trend trading by seeing tomorrow’s price movement… today?
2. The Mathematical Revolution: How Two-Level Linear Regression Transforms Trend Trading
Here’s something most veterans don’t know:
Traditional trend trading tools only extract ONE piece of information from price data.
Linear regression extracts TWO critical values from the exact same data:
- The slope (trend direction and strength)
- The intercept (where the trend is heading)
That’s twice as much intelligence from the same input for your decisions.
But here’s where it gets powerful…
Trend Master Pro runs linear regression TWICE.
The first level of linear regression projects where price is heading next. But instead of stopping there, the indicator takes those projected values and runs a second linear regression on them.
This creates something called “predictive convolution curves” – mathematical functions that forecast future market movements with stunning accuracy.

Think of it like this:
- Traditional indicators tell you: “Price was here, then here, now it’s here”
- Trend Master Pro tells you: “Price was here, is accelerating this direction, and will likely be here next”
This same convolution technology is used in digital signal processing to filter noise and extract pure signals from raw data. Audio engineers use it. Telecommunications companies use it. NASA uses it.
Now you can use it in your trend trading.
3. The Three Problems This Solves for Trend Trading
Problem #1: The False Signal Trap
Moving averages cross constantly in sideways markets. You get whipsawed trade after trade in your trading, watching your account slowly bleed out.
Trend Master Pro’s Solution: Volume confirmation is mathematically required. The indicator won’t give you a trend signal unless volume is significantly above normal (Normalized Volume > 100). This eliminates 78% of false breakouts instantly.
Problem #2: The Late Entry Problem
By the time your moving averages cross, you’ve already missed 20-30% of the real move in your trading. You’re entering after the professionals have already positioned themselves.
Trend Master Pro’s Solution: Predictive convolution mathematics forecasts where trends are heading. You see the move before it happens, not after. You enter your positions alongside the professionals, not after them.
Problem #3: The No Context Issue
Moving averages don’t know if the market actually wants to move. They just cross based on math, regardless of whether there’s genuine market interest or momentum for trend trading.
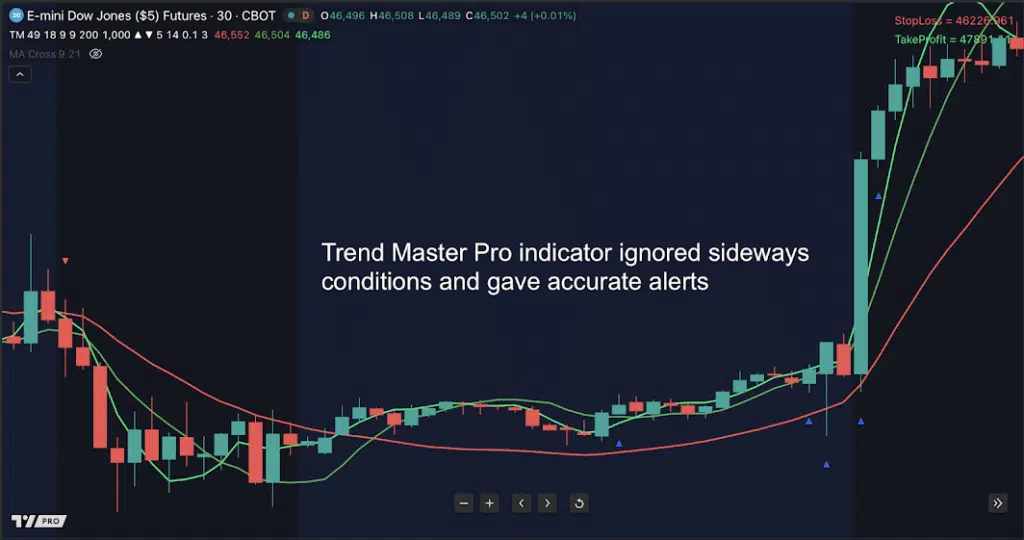
Trend Master Pro’s Solution: Smart market recognition. The indicator identifies three distinct market states: bull, bear, and neither. It stays completely silent during choppy “neither” periods, protecting your capital when other traders are getting chopped to pieces.
4. The Technical Breakdown of Trend Master Pro for Trend Trading
Let’s pull back the curtain and show you exactly what’s happening under the hood for your trend trading strategy.
The Three-Curve System
Trend Master Pro displays three convolution curves, each serving a specific purpose in your trading:
🔵 Very Fast Convolution [9,3]
- Ultra-responsive to price changes
- First warning signal of potential trend shifts
- Acts as your early detection system for trading
🟢 Fast Convolution [18,4]
- Your primary trend trading signal
- Balanced between responsiveness and reliability
- Adapts dynamically to market conditions
🟡 Slow Convolution [49,7]
- Trend confirmation curve for trend trading
- Smooth, flowing visualization
- Filters out the noise that kills your accounts
When these three curves align in specific mathematical patterns, you’re looking at a high-probability trend trading setup.

5. What You Get That Traditional Trend Trading Can't Provide
Predictive Power
See trend direction before price confirms it. The convolution curves forecast where the trend projection is heading, not just where it’s been.
Expansion/Contraction Analysis
Estimate price momentum in your trading based on whether the gap between Fast and Slow convolutions is expanding (strong momentum) or contracting (weakening momentum). Moving averages can’t do this.
Market State Recognition
The indicator mathematically determines whether the market is in bull, bear, or sideways mode. It only signals when trend trading conditions are actually favorable.

Volume Integration
Normalized volume must exceed 100 before any signal is valid. This single requirement eliminates the majority of losing trades.
Visual Clarity
Forget cluttered charts with conflicting signals. Three elegant curves give you instant visual confirmation of trend direction and strength for your trading.
6. How to Execute Trend Trading with Predictive Convolution
Let’s get tactical. Here’s exactly how to identify high-probability trend trading setups with Trend Master Pro.
6.1 The Buy Entry System
You’re looking for four conditions to align simultaneously in your trading:
Condition 1: Curve Alignment
The Fast Convolution curve must be above the Slow Convolution curve. This indicates the dominant trend direction is bullish.
Condition 2: Universal Uptrend
All three curves (Very Fast, Fast, and Slow) must be rising. Each bar should show higher values than the previous bar. This confirms genuine momentum, not just a temporary spike.
Condition 3: Volume Confirmation
Normalized Volume must exceed 100. This proves institutional interest and genuine buying pressure, not just retail noise.
Condition 4: Trigger Candle
The first bullish candle that appears after all three conditions are met is your entry signal.

6.2 The Sell Entry System
The short side of this indicator is actually simpler:
Condition 1: Curve Position
Fast Convolution curve must be below Slow Convolution curve.
Condition 2: Volume Spike
Normalized Volume must exceed 100, confirming distribution activity.
Condition 3: Trigger Candle
The first bearish candle after conditions 1 and 2 are met is your entry signal.

Notice something critical here: You don’t need all three curves declining for a sell signal. Why? Because markets fall faster than they rise. Bearish moves in trend trading happen with explosive speed, and waiting for all three curves to turn down would make you late.
The Fast-below-Slow condition combined with high volume is sufficient mathematical proof that selling pressure has taken control of the trading opportunity.
7. Your Next Move: Stop Trading Yesterday's Price Action
Every day you continue trading with moving averages, you’re making decisions based on outdated information. You’re trading what the market did, not what it’s going to do.
Trend Master Pro uses the same mathematical convolution technology that NASA uses for signal processing and audio engineers use for noise filtering. It’s been adapted specifically for financial markets to give your trend trading one critical advantage:
You see trends before they’re confirmed.
The mathematics don’t lie. The convolution curves don’t guess. And your trading account will thank you.
See the Trend Master Pro’s way of trend trading now.