
MACD Bollinger Pro for TradingView
Amazing “Hybrid” Engineering Feat Confirms Market Trends VERY Early, So You Can Be The First To The Party & Cash In On Big Trends…
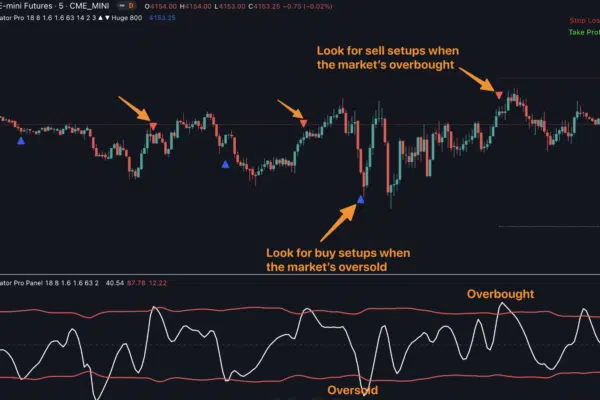
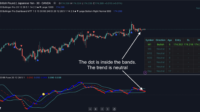
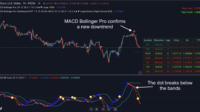
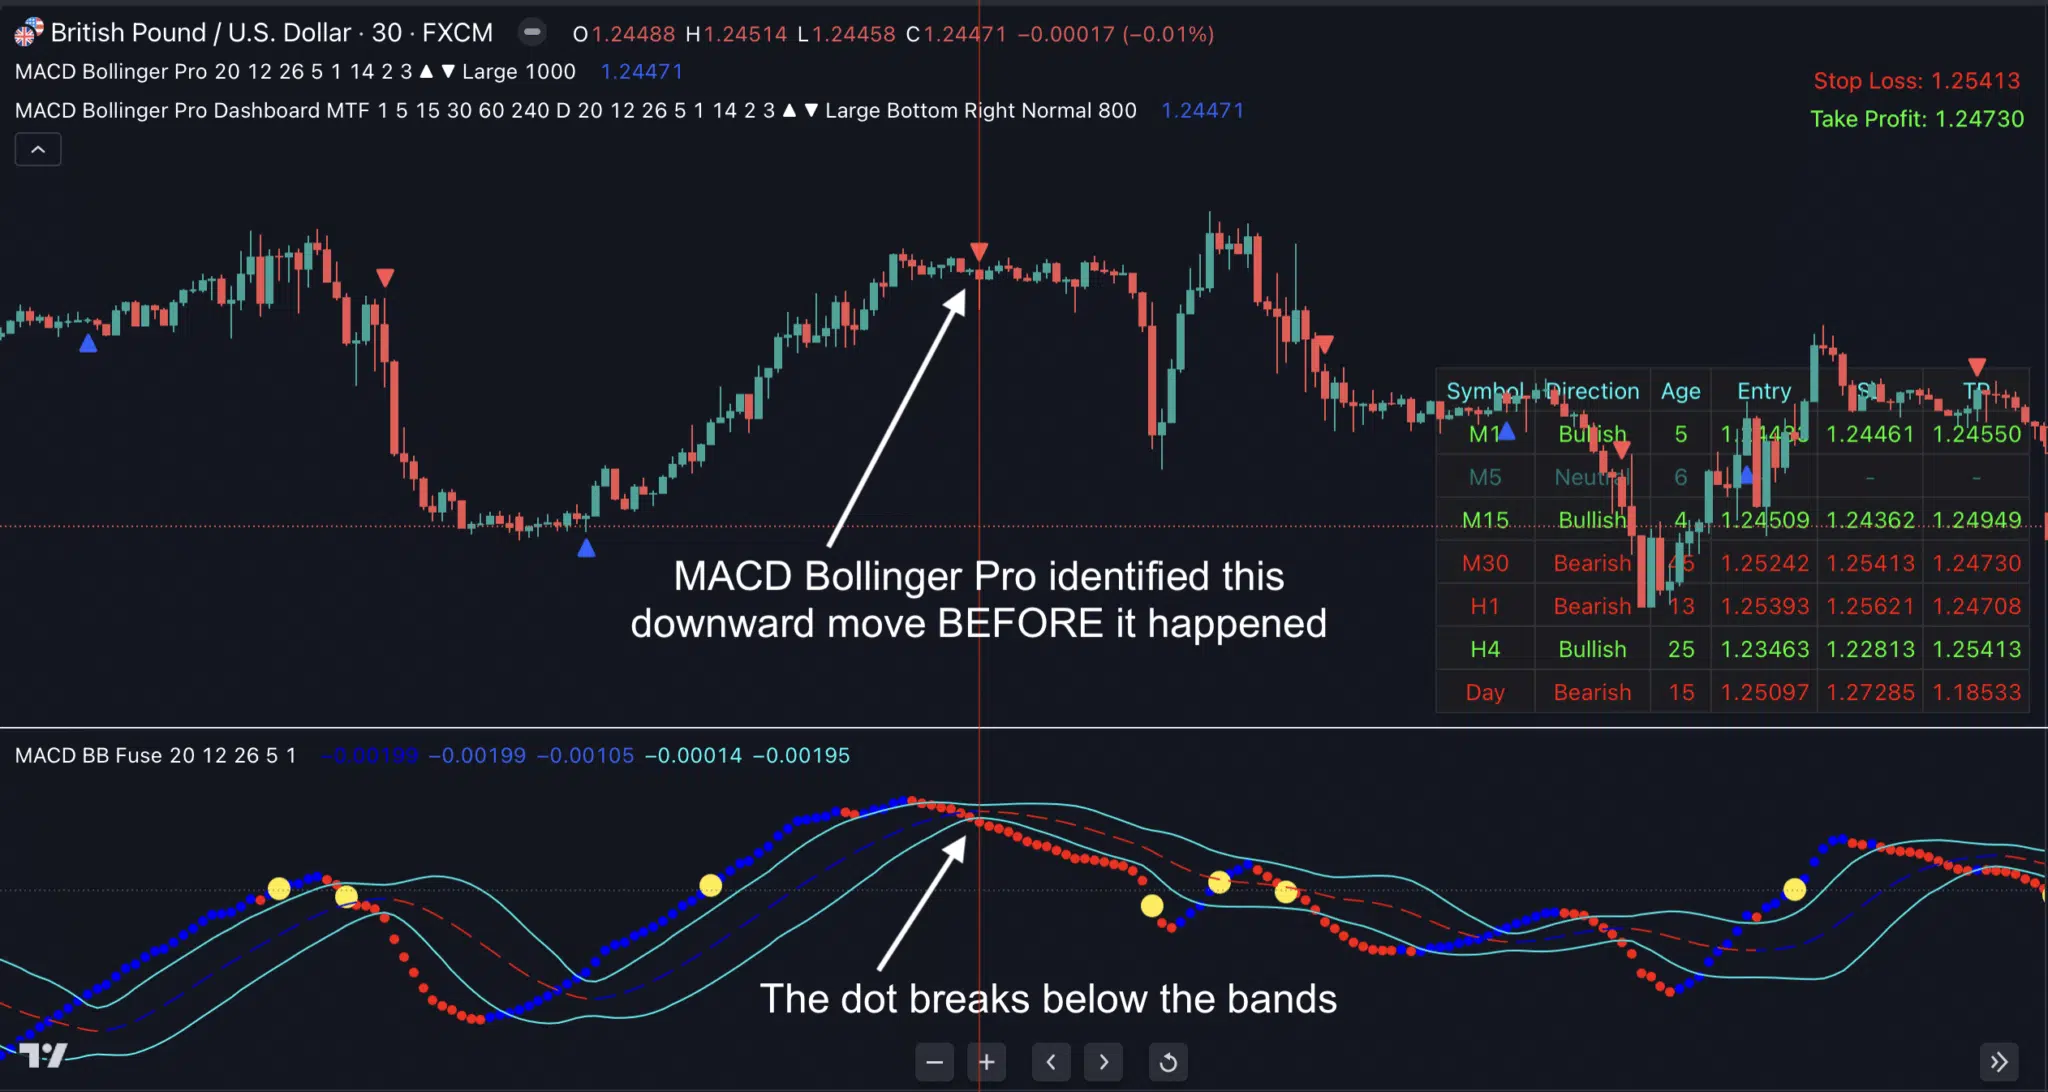
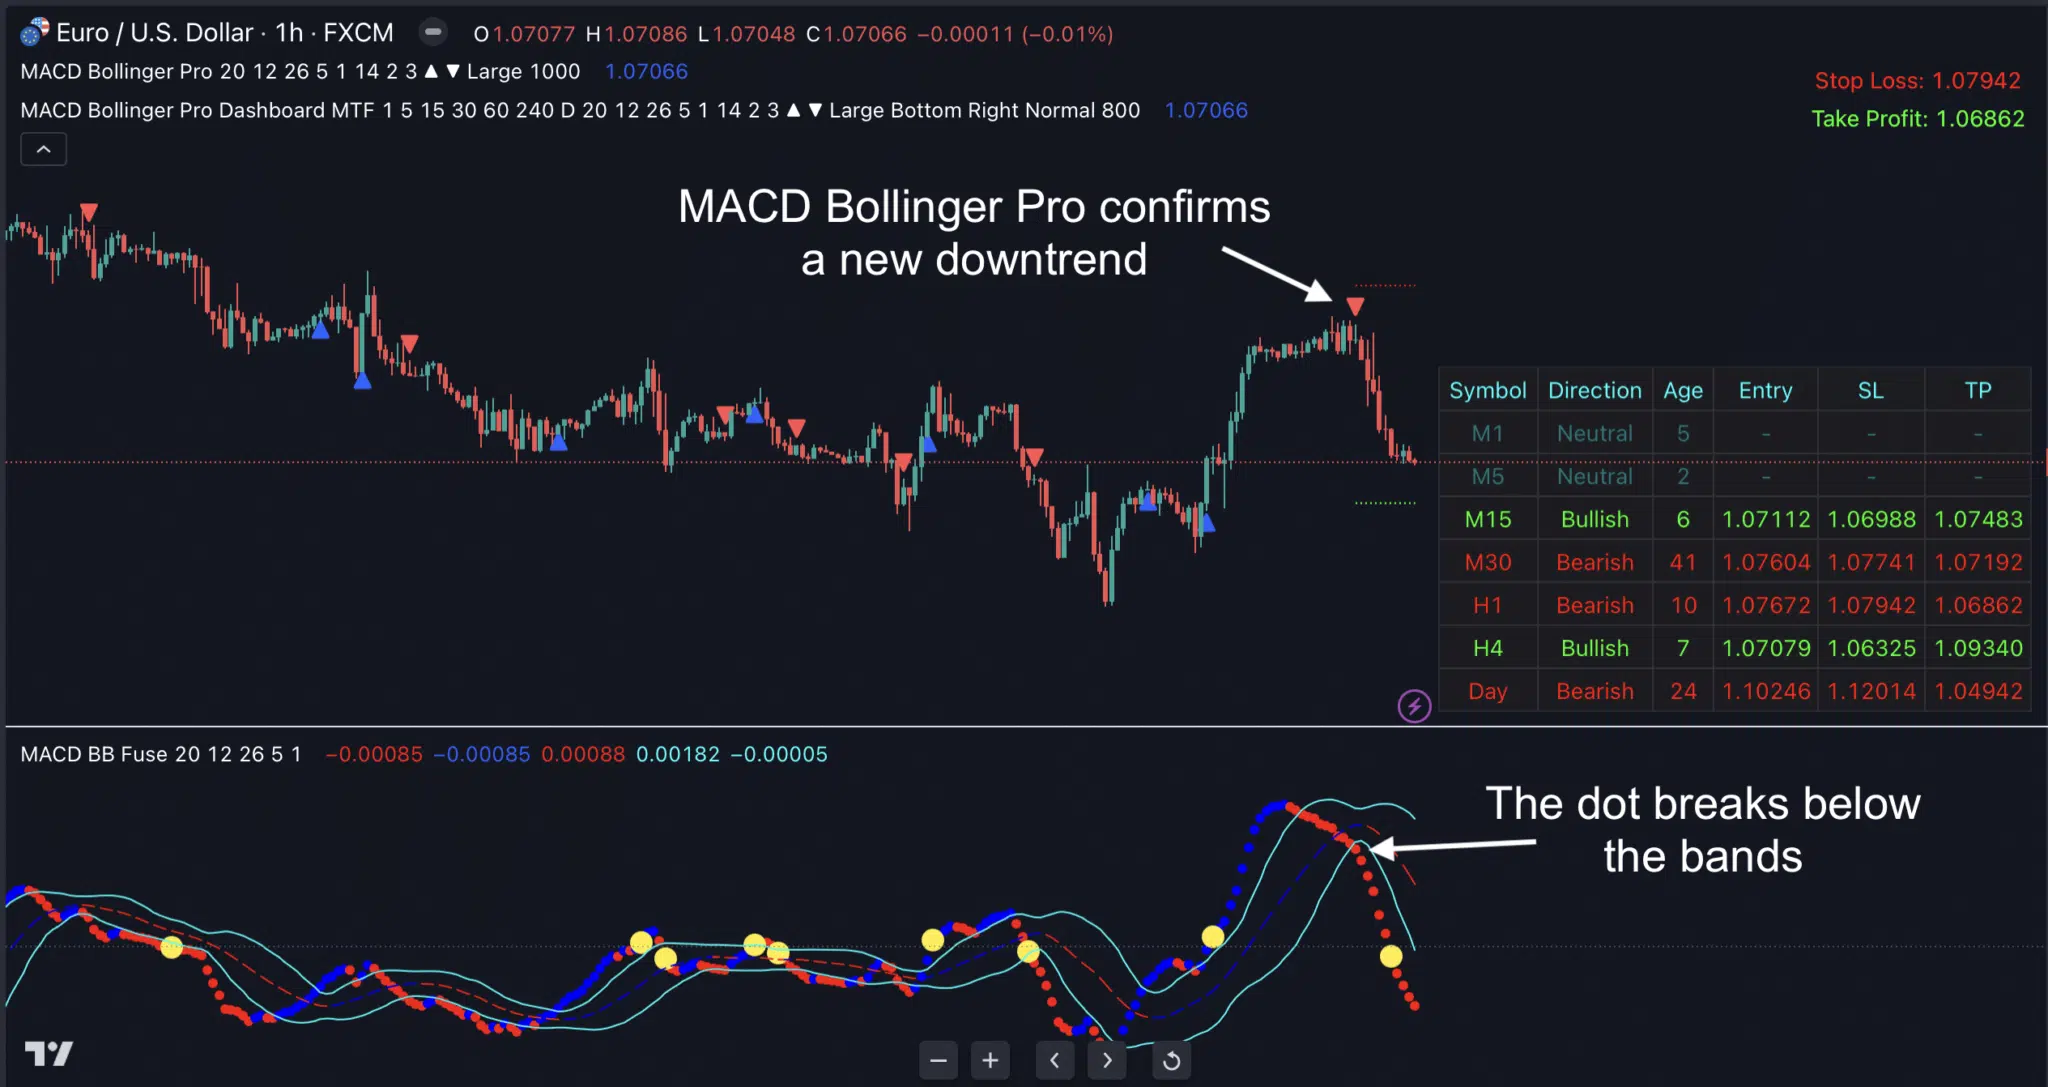
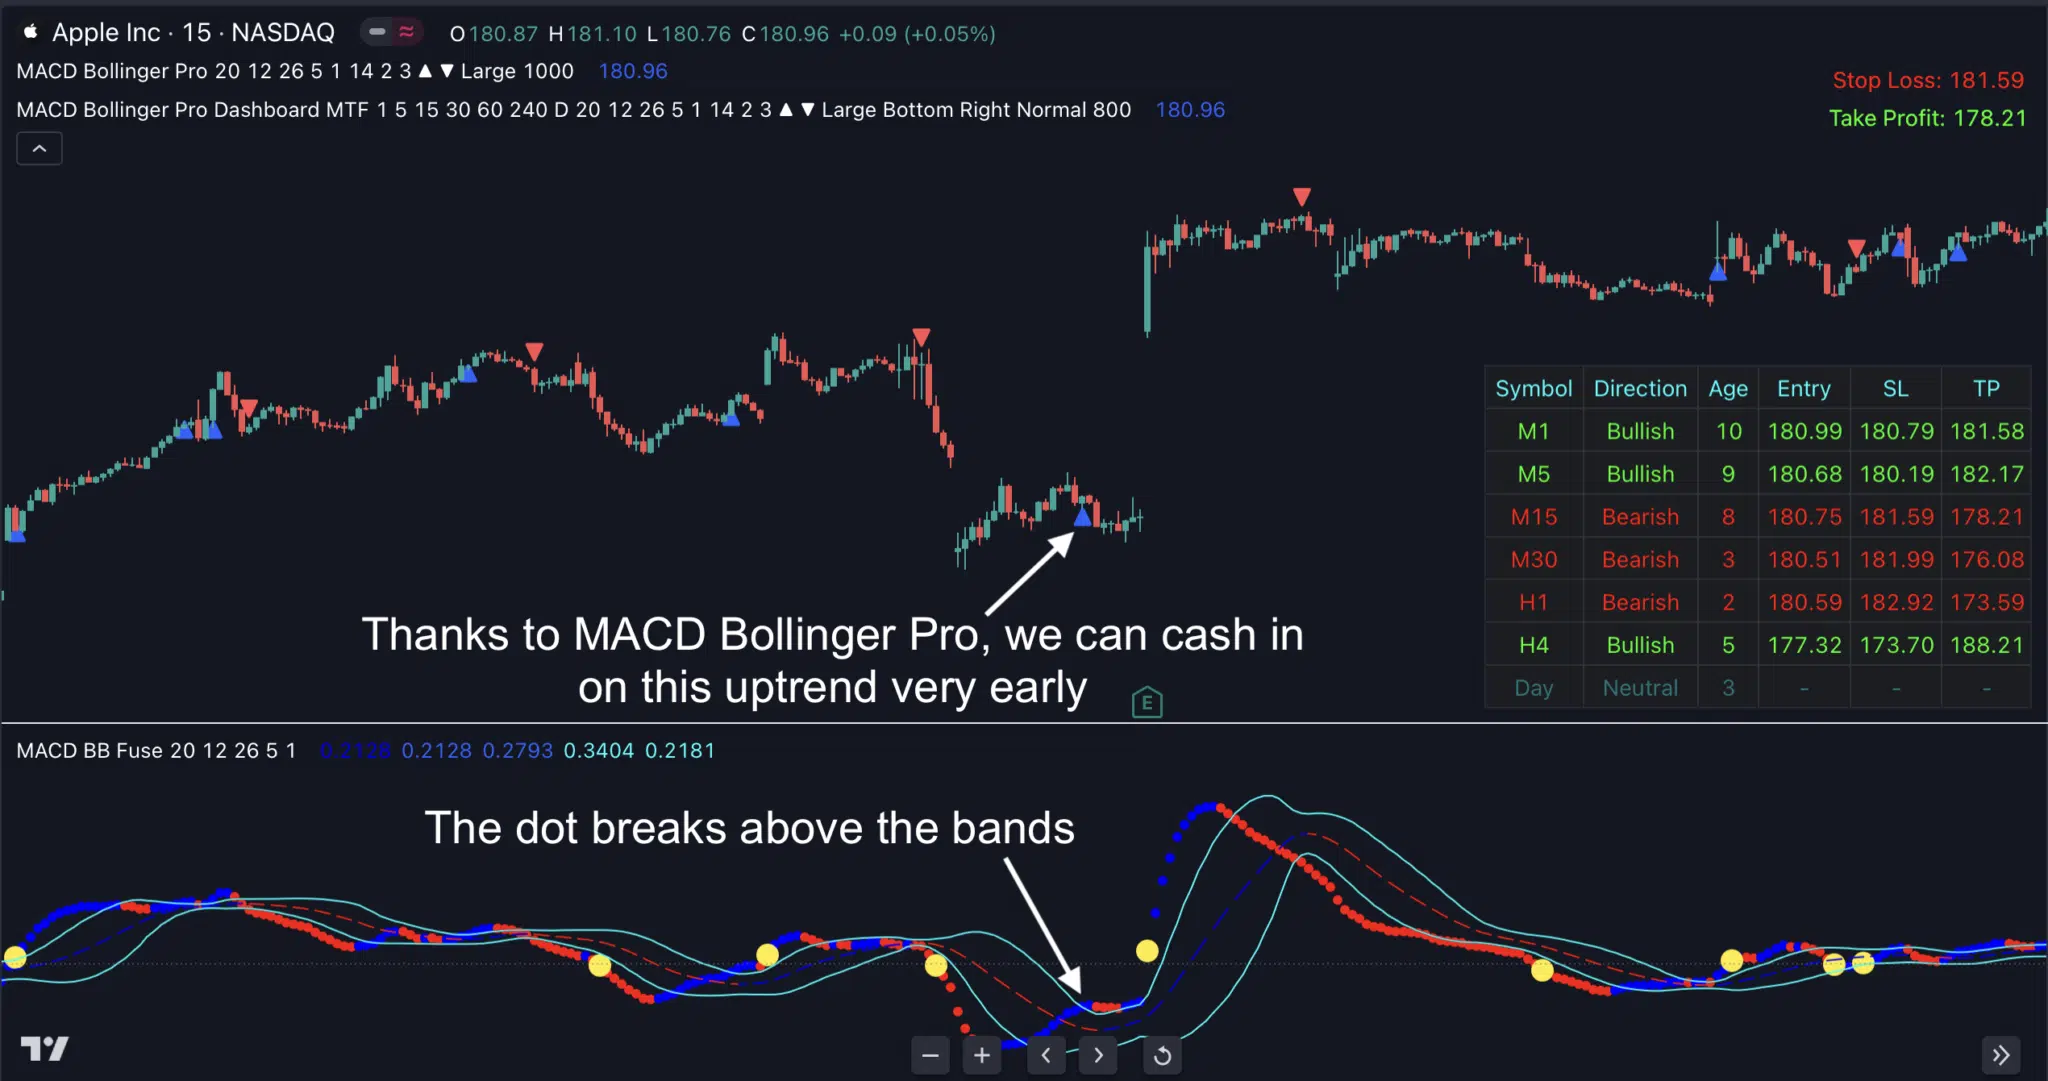
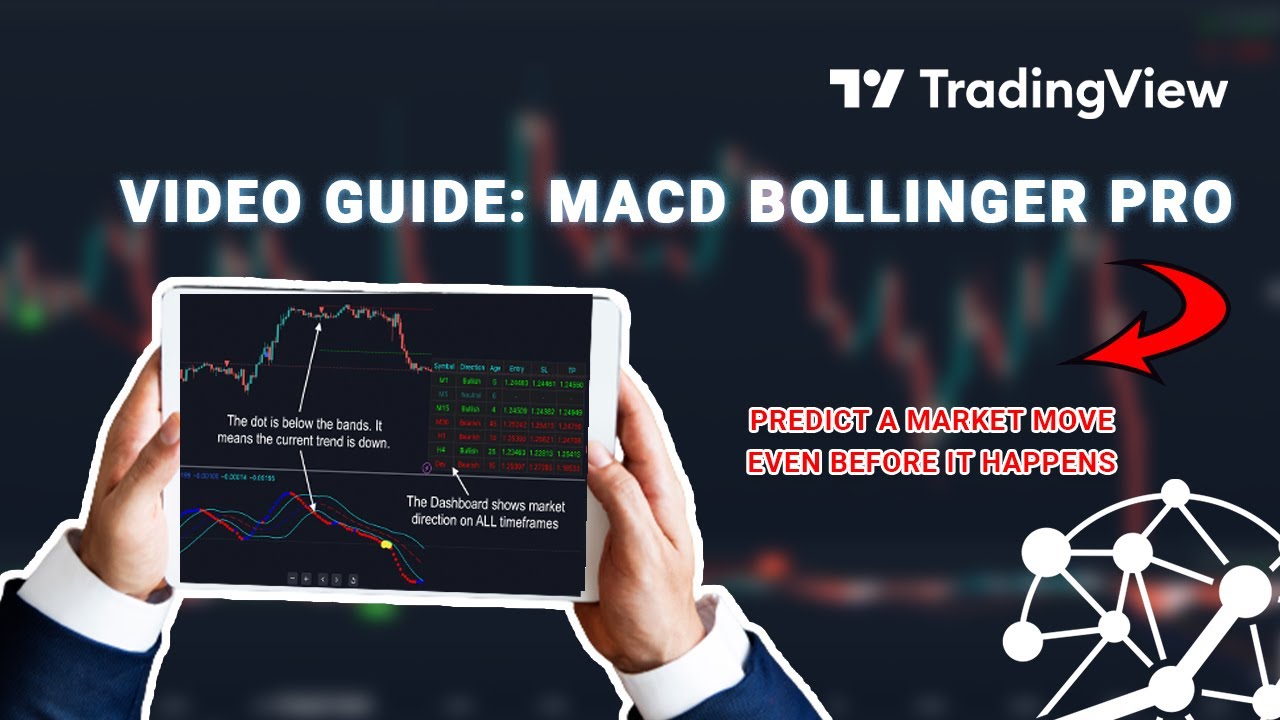
🔹 Combine the power of MACD + Bollinger Bands to spot high-probability trade setups.
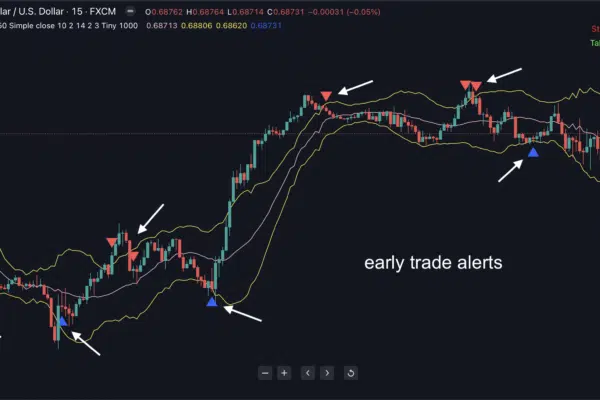
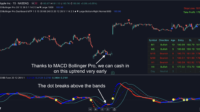
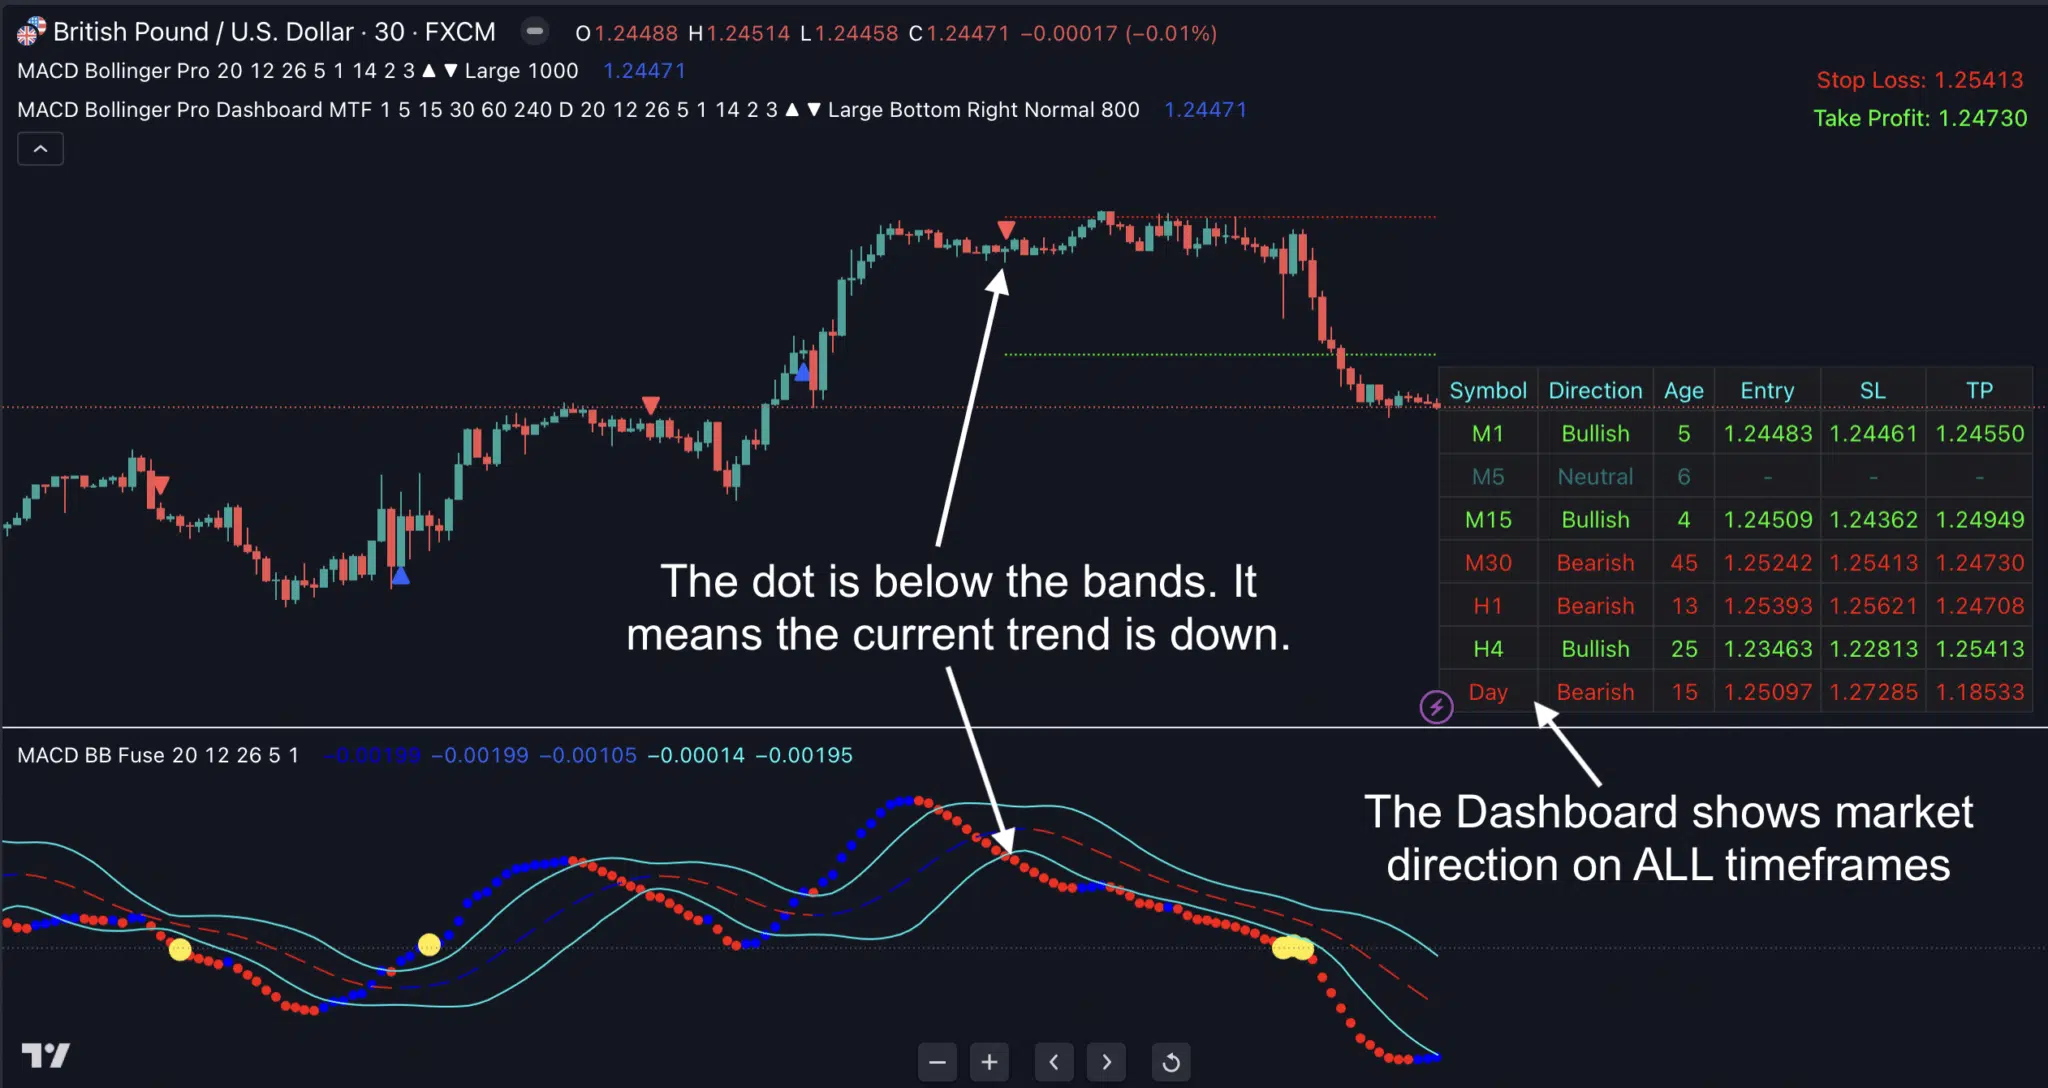
🔹 Detect new trends early — enter right as the move begins, not after it’s over.
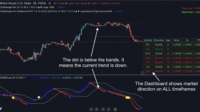
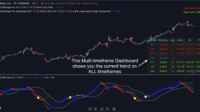
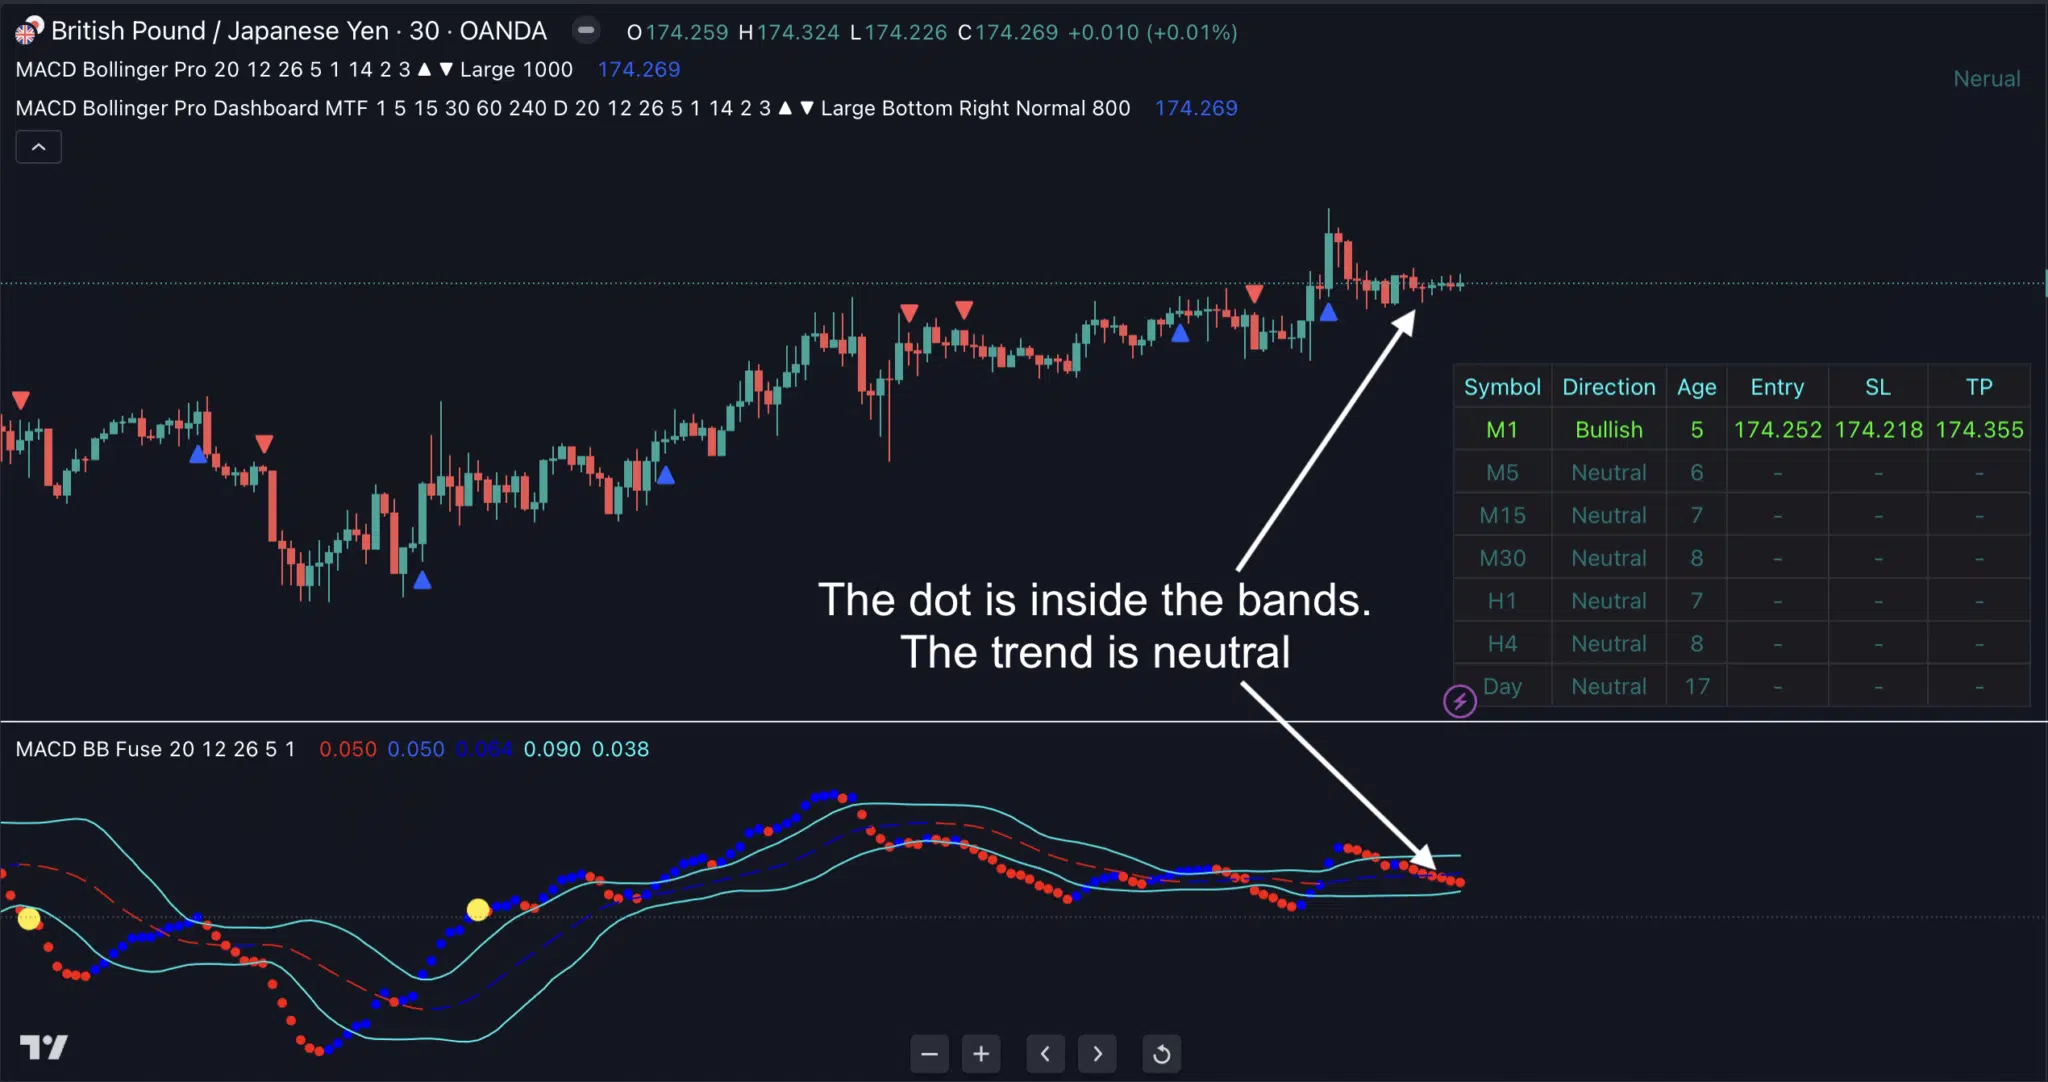
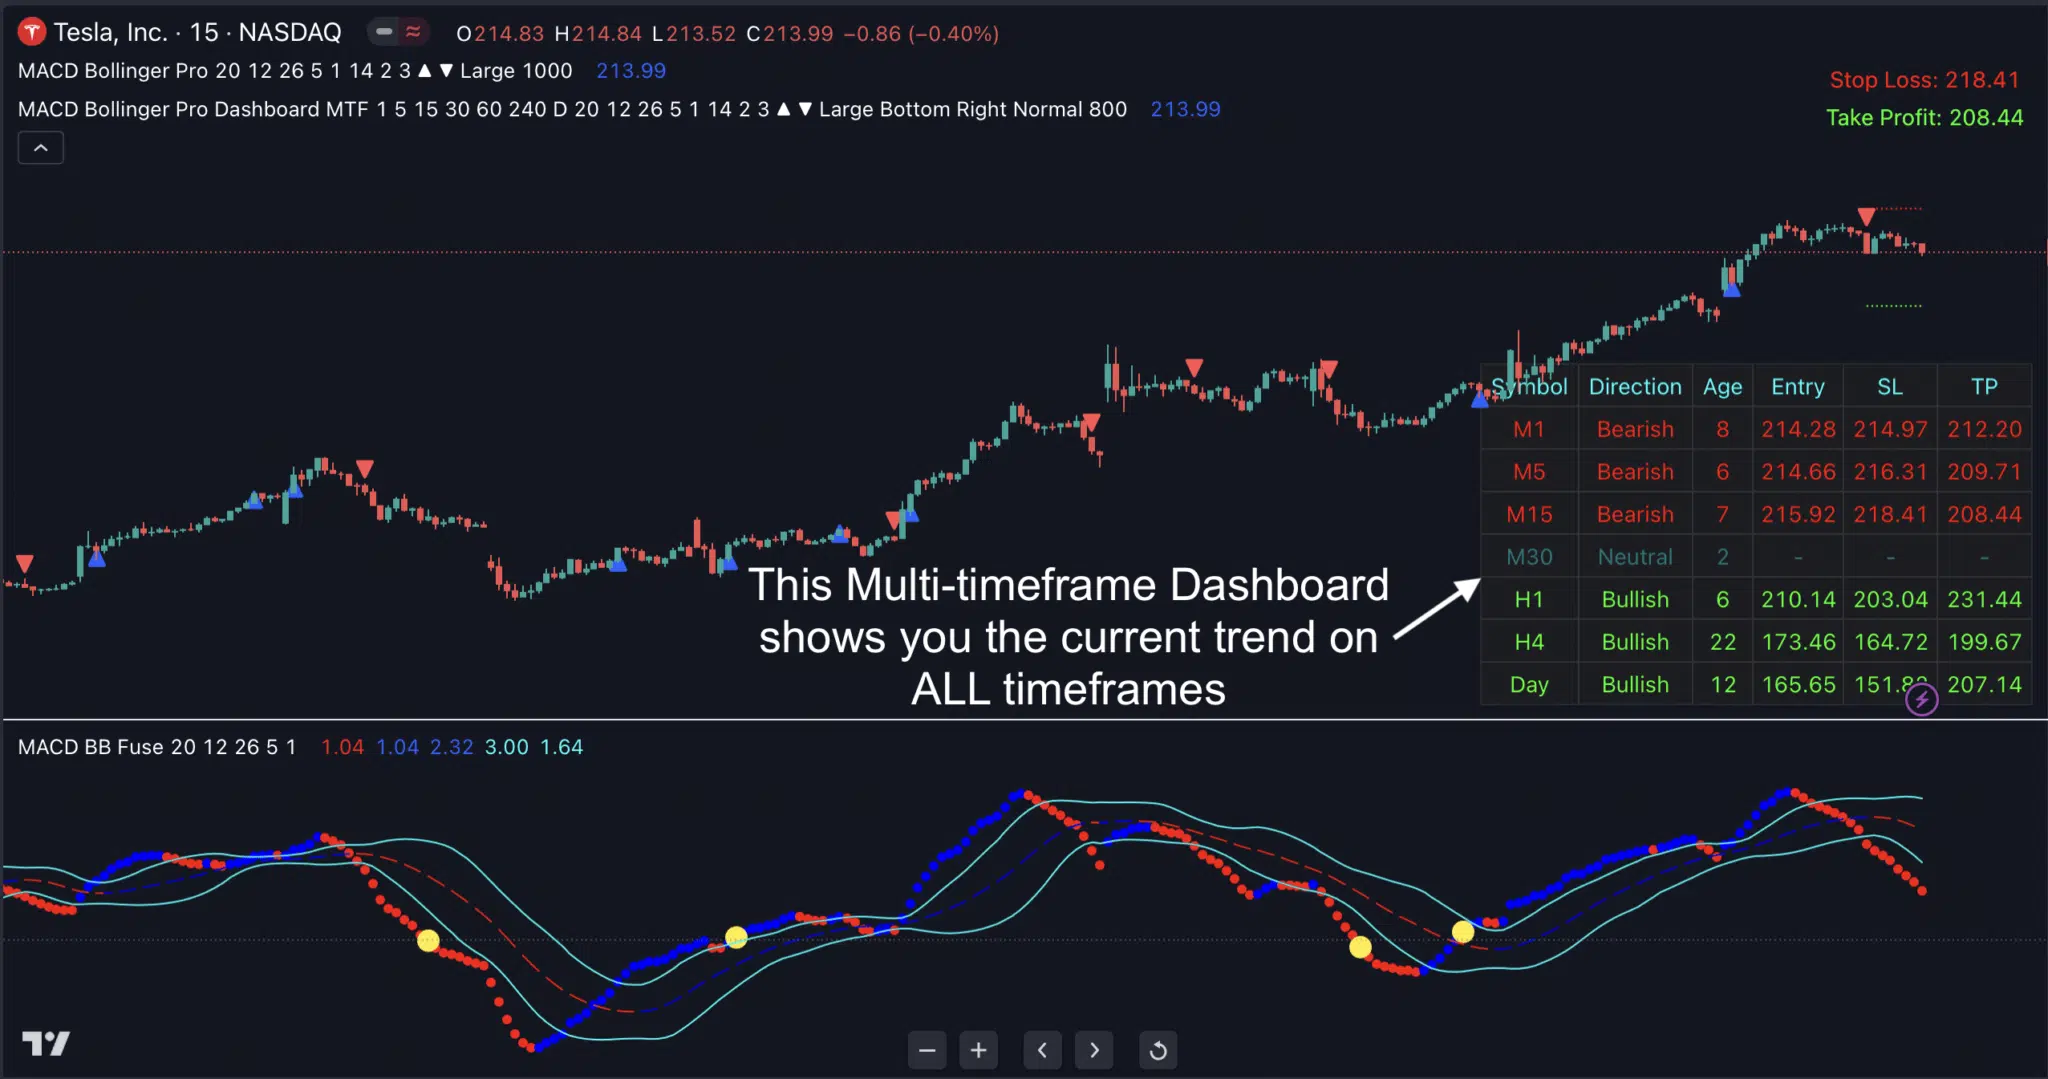
🔹 See all timeframes at a glance with a smart multi-TF dashboard for confident trading.
$299.00
MACD Bollinger Pro for TradingView
One-time payment. Lifetime access.