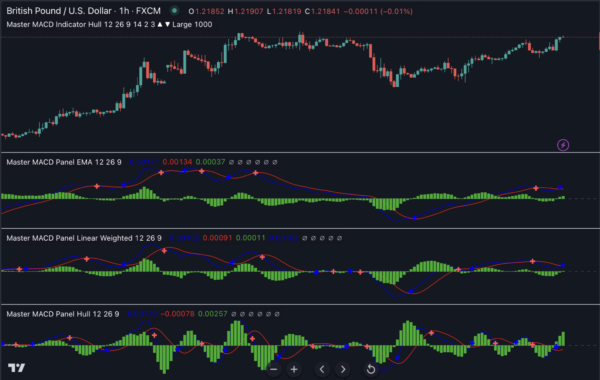
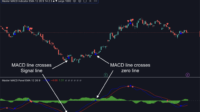
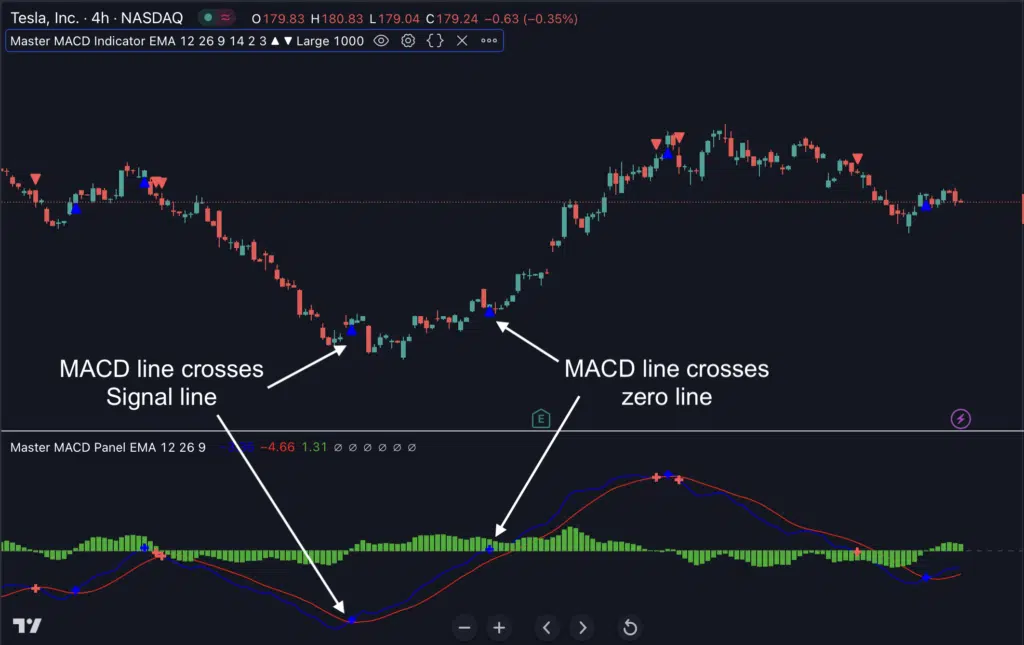
Here’s a new, advanced MACD indicator for Tradingview:
Master MACD: Less lag, faster, more responsive to market changes.
Impressive, no?
You’d think this is the backtest result of some amazing new trading system.
And you’d be wrong.
The truth? This is a modest, stupid-simple automated strategy that ships standard with the TradingView platform.
If you’re currently using Tradingview, you already have it.
A hidden gem in plain sight:

It’s the “MACD” Strategy that’s shipped standard with your TradingView…
A “Rocky Balboa” of our trading world.
Nobody respects it. Nobody pays attention to it. Nobody ever thought to use it.
They thought it was a joke.
Well… the joke is on them.
The backtest result you’ve just seen is of MACD Strategy applied to EUR/USD weekly time-frame.
And you know what? Other traders and researchers also reported the amazing results they got with MACD, across MULTIPLE markets, from stocks to Bitcoin (yes, Bitcoin)
For example:
Here’s a backtest of a MACD strategy applied in the stock market… (a quote from that page: “We ended up with $23,524.15, or a return of 135.24%”).
Here’s a reddit thread where the author reports his results of MACD applied on Bitcoin. (Summary: MACD beats “buy and hold” in terms of returns & drawdown)
You see, when I first read about these backtest results of the modest, seemingless harmless MACD, I was skeptical as hell.
So I decided to run tests on my own. Hundreds of tests. Just like the one you’ve seen above.
Once I’ve seen the results with my own two eyes, I became a believer. But that’s also when I discovered something else:
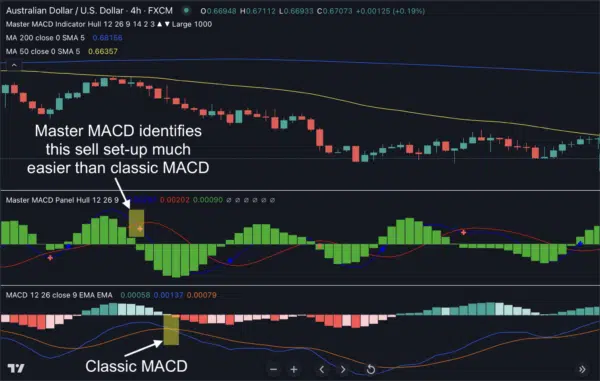
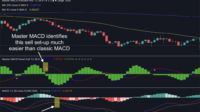
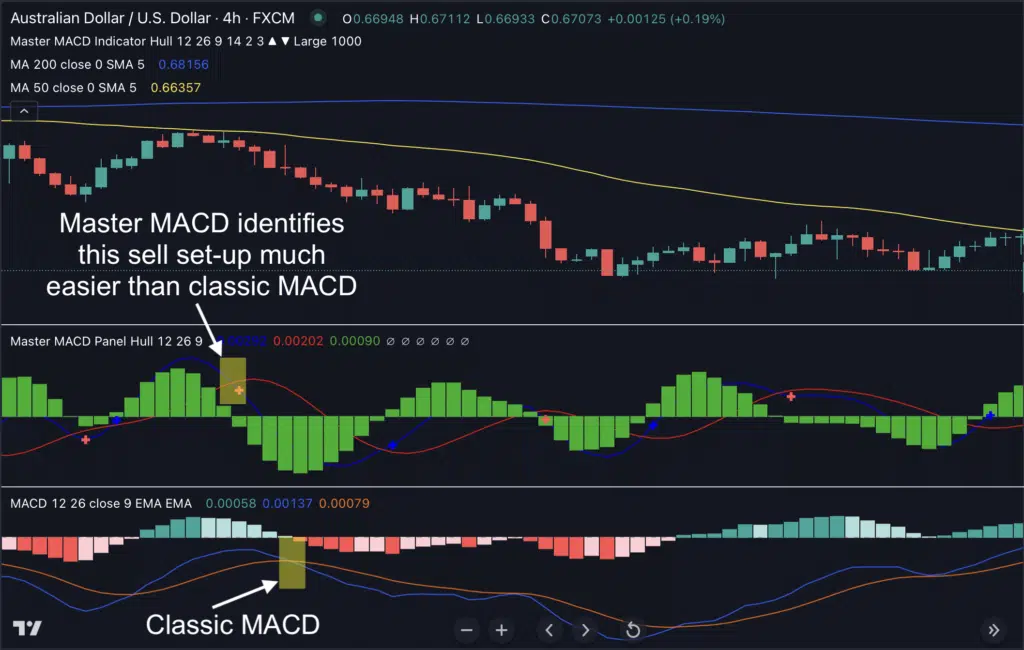
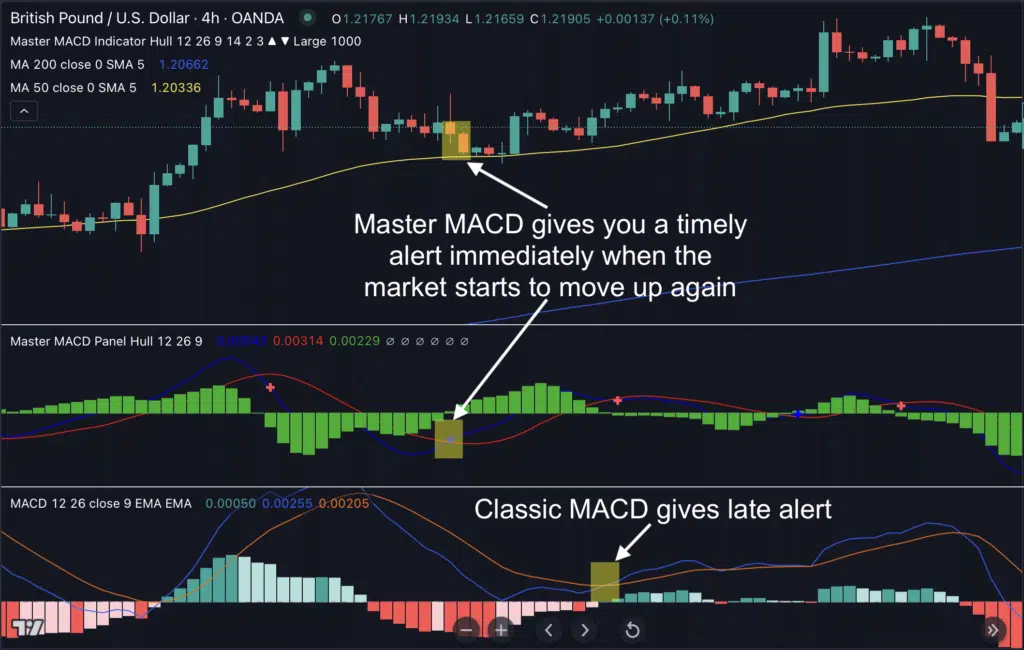
In this case, the market is in a downtrend (reflected by the 50-period Moving Average crosses below the 200-period Moving Average). And so we’re looking for the price to pull back. And wait for MACD to give us a sell signal.
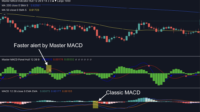
As you can see, since our Master MACD indicator uses a faster, more adaptive type of moving average, it gives us a sell alert much earlier than the traditional MACD. And so we’re able to enter this sell trade earlier and get more profits.
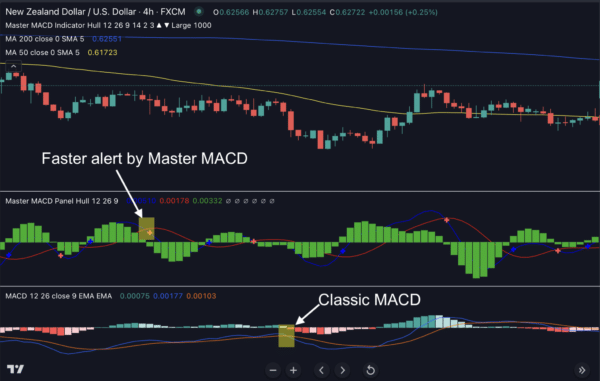
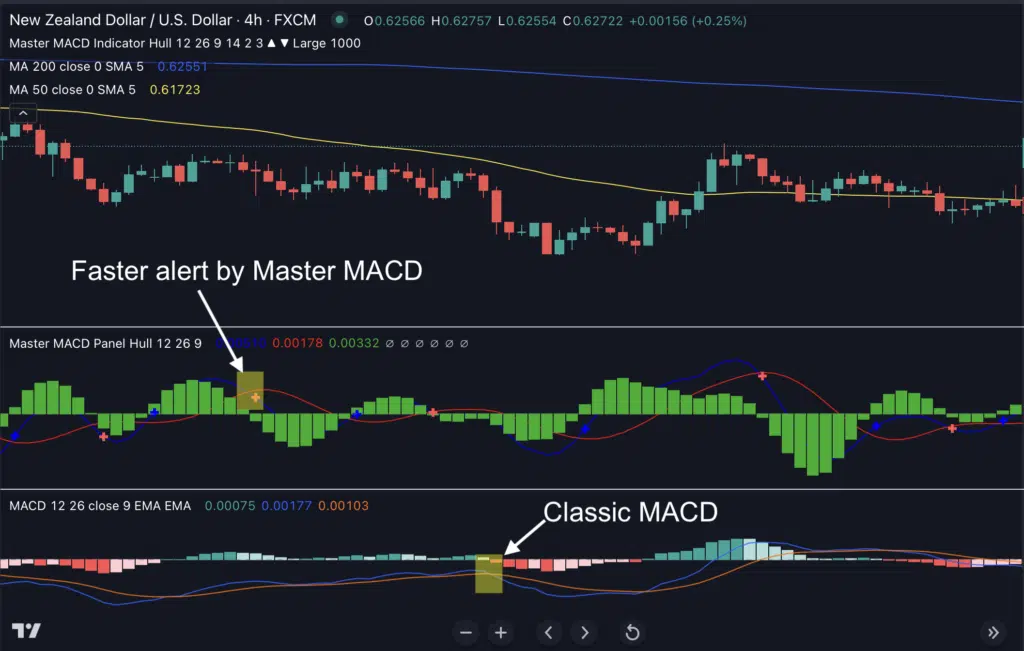
Here’s another similar situation where Master MACD gives much faster alert compared to classic MACD:
MACD is incredible, but not without its faults…
That’s why I set out to perfect this powerful indicator.
I’d love to think that I’ve achieved this almost-impossible task.
I call it the “Master MACD” indicator for Tradingview
And it is FASTER, less lagging, and more adaptive to market changes…
Because this new, improved Master MACD reacts FASTER to market changes, you’ll no longer miss out on big market moves.
No more jumping late in a trend, just to see the market turn against you.
And it works perfectly for trading trends. It also helps you identify legitimate breakouts. AND it tells you when a market reversal will likely happen…
Here’s how it works:
The Master MACD indicator incorporates a FASTER, more adaptive kind of moving average – the Hull Moving Average – in its algorithm. And because of this, Master MACD reacts faster to market changes.
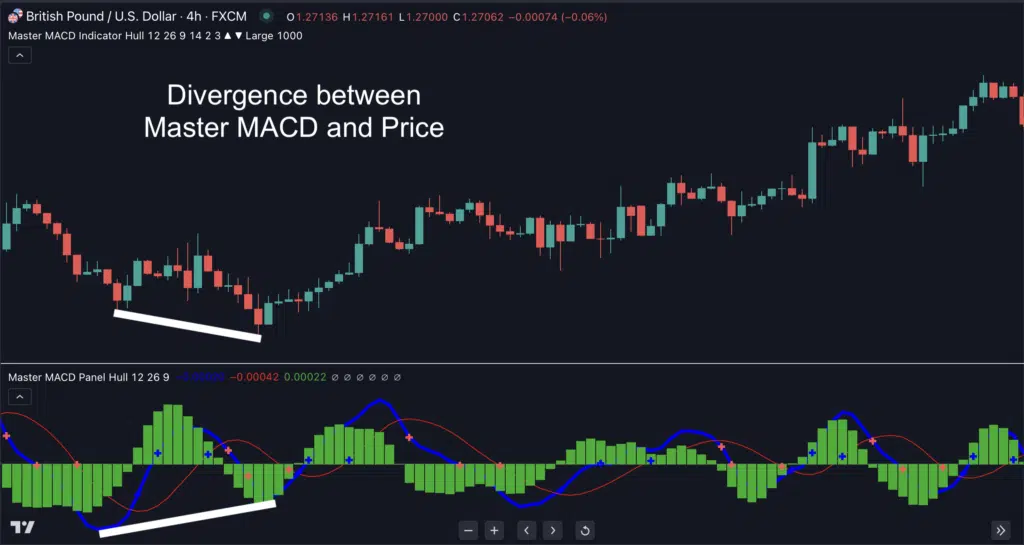
That way, it lets you enter the trend with near-perfect timing. It helps you identify explosive breakout moves with greater accuracy. And it spots divergences and market reversals earlier than traditional indicators.
Let’s see it in action. This is a AUD/USD chart, Master MACD plotted on the top panel, Classic MACD on the bottom panel:
Did you also notice that Master MACD gives you a visual alert and prints an arrow, so you can be sure you won’t miss out on an important trade?
And it also promptly gives you a pop-up and audio alert whenever there’s a signal.
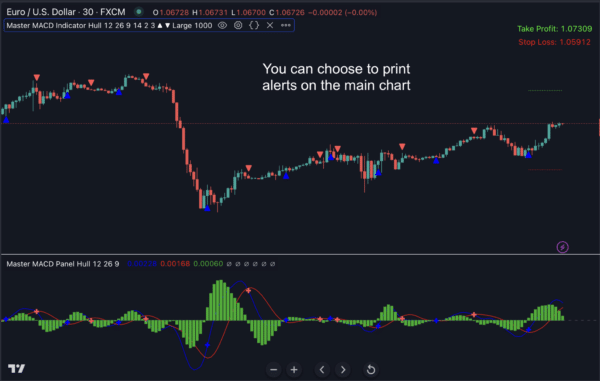
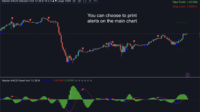
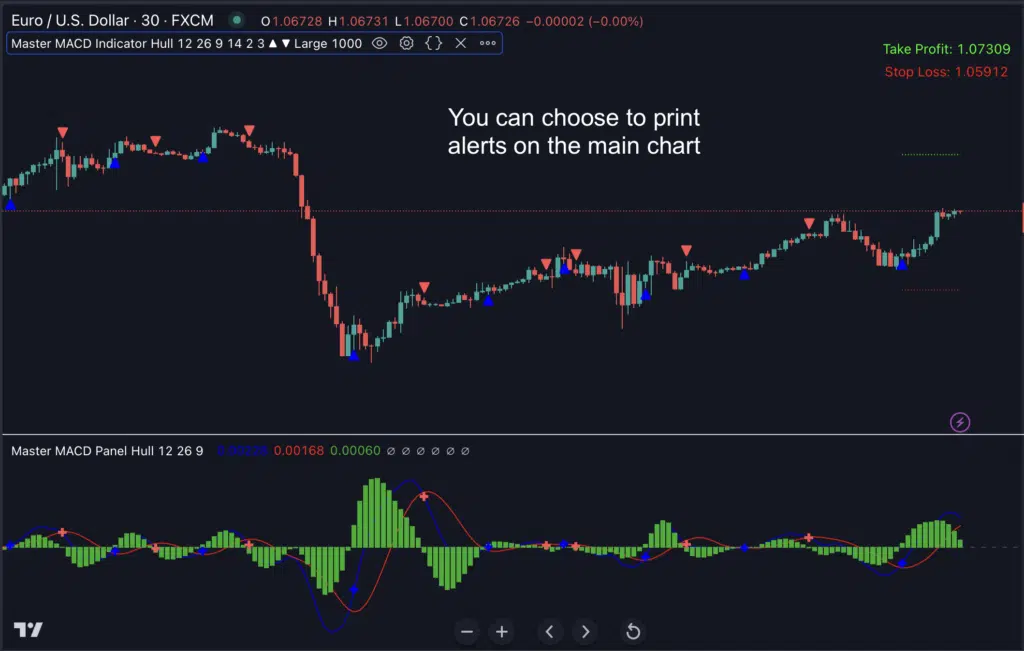
In addition, you can also choose whether you want these alerts to show up on your main chart. Like this:
So far I’ve told about the faster, more adaptive Hull Moving Average that we use in Master MACD’s algorithm. But did you know that:
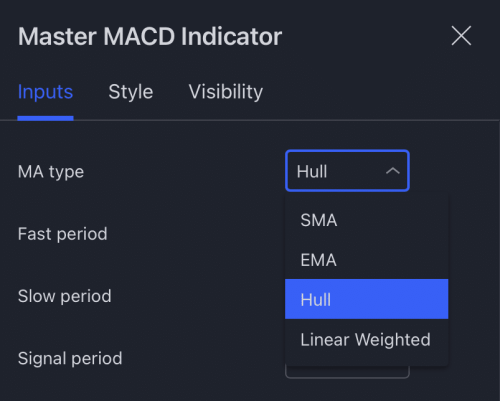
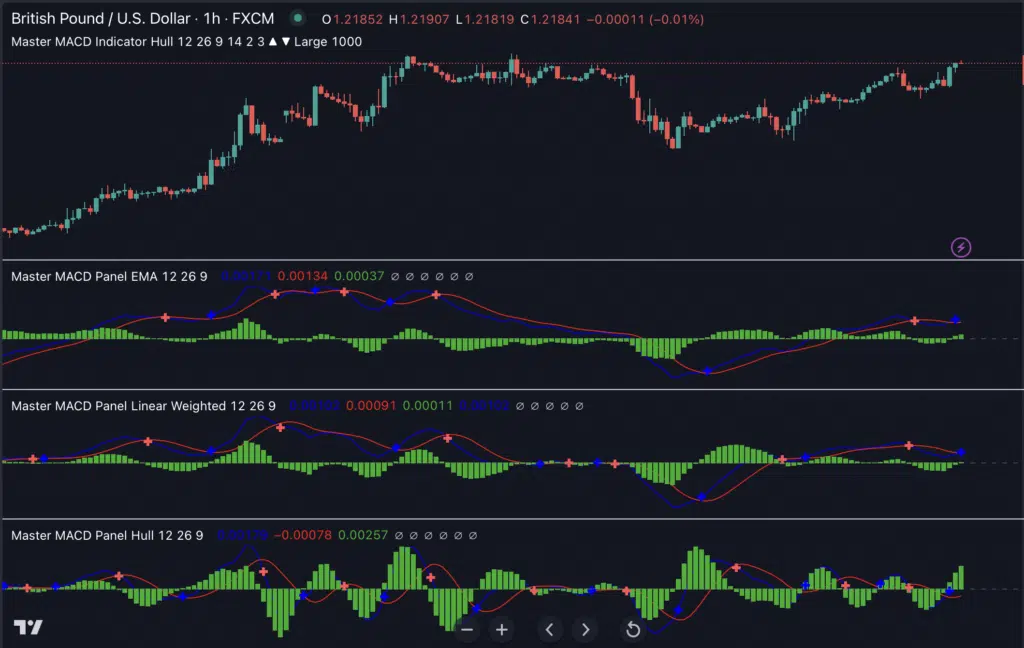
You can also choose whichever Moving Average type you want to use in the Master MACD
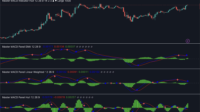
Yes, this Master MACD indicator gives you the ultimate flexibility to use whichever Moving Average type you like. You can choose from Simple Moving Average, Exponential Moving Average, Linear Weight Moving Average, or Hull Moving Average:
Now, let’s talk about perhaps the most interesting feature of the Master MACD:
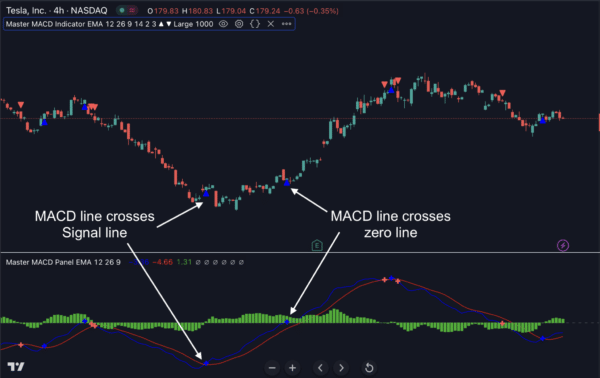
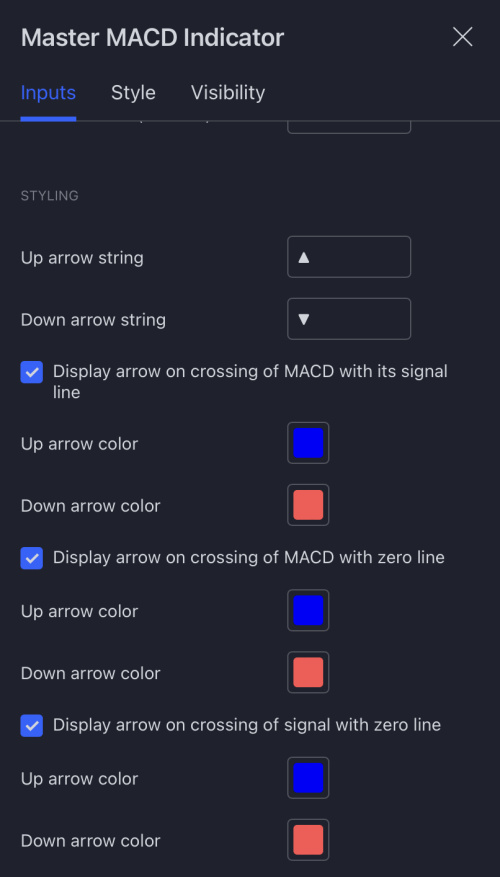
You can specify on which crossover situations should Master MACD give an alert…
Just tell the indicator which option you prefer:
+ Show alert whenever crossing of MACD line with the signal line occurs, or…
+ Show alert whenever crossing of MACD line with the zero line occurs, or…
+ Show alert whenever crossing of Signal line with zero line occurs, or…
+ Any combination of the above:
Now let me show you…
How you can use Master MACD to enter a trend with near-perfect timing…
Here’s the rules I’d personally use to trade the trends with Master MACD:
ONE: Identify the long-term underlying trend using 50-day and 200-day moving average.
TWO: Use Master MACD to trigger the trade.
For example, look at this chart:
In this example, the market is in the uptrend as the 50-day moving average is above the 200-day moving average.
So now we’re looking for a buy set-up identified by our Master MACD indicator.
And as expected, almost immediately after the Master MACD gives us a buy alert, the market starts to move up aggressively.
Easy trade, isn’t it?
But that’s just the beginning…
Master MACD is also extremely powerful when it comes to trading breakouts…
I admit, this is a pretty unorthodox way of using Master MACD. But I think it could be the most powerful way of all. Here’s how it works:
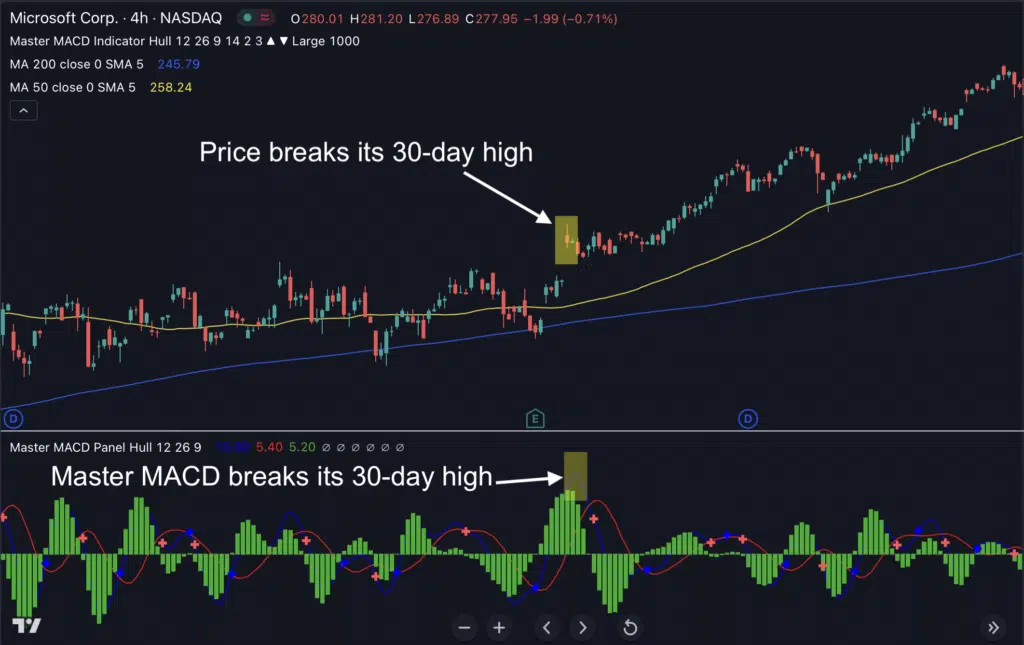
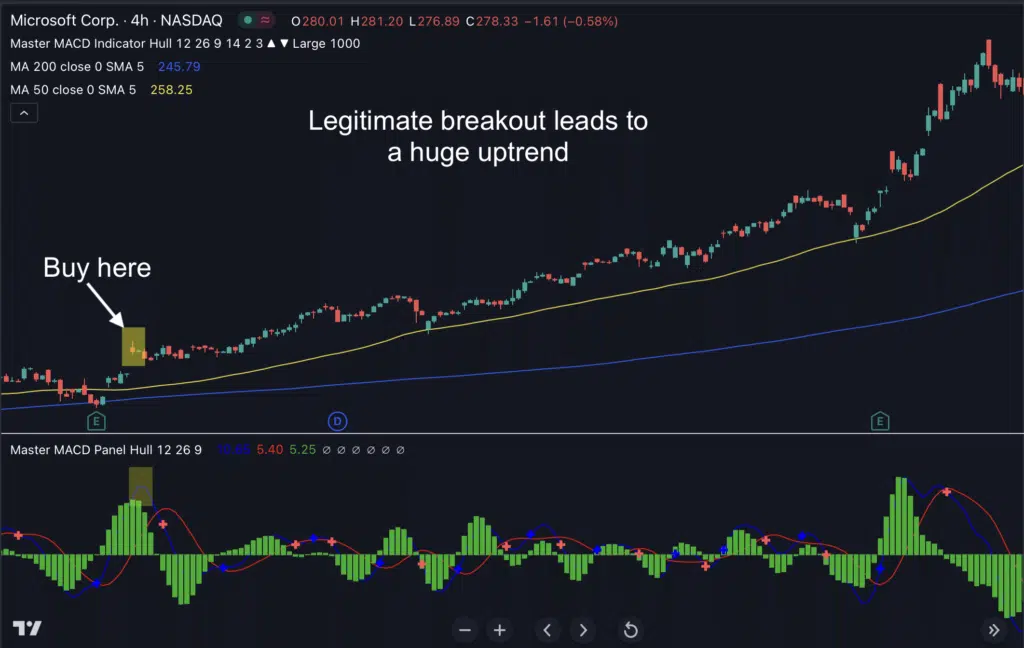
If the price breaks its 30-day high AND the Master MACD breaks its 30-day high, we’ll buy. if the price breaks its 30-day low AND the Master MACD breaks its 30-day low, we’ll sell.
To illustrate these rules, let’s look at a chart:
Frequently Asked Questions
After purchasing, you’ll fill out a short form that asks for your Tradingview username. And then, we’ll grant your username access to all our indicators within 24 hours.
It works on ALL markets internationally that are available on Tradingview: FX, stocks, indices, commodities, futures, etc…
Customer Reviews
-
Sale!
Smooth Trend Finder for TradingView
$299.00Original price was: $299.00.$269.00Current price is: $269.00. -
-
-

