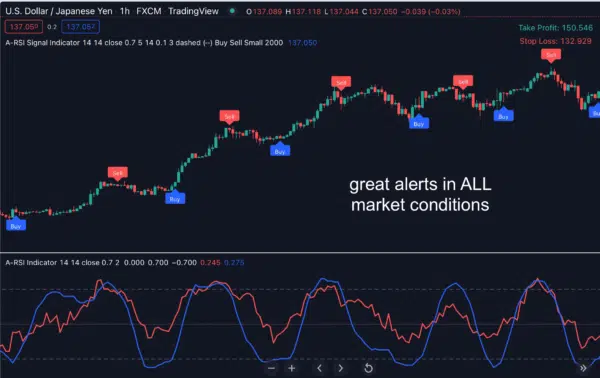
If you’re still using the traditional RSI, perhaps it’s time for a change:
Use this new “Advanced RSI (A-RSI) for Tradingview” indicator to find high-probability pullback trade setups AND divergence-based reversals
A silver bullet? Obviously NO. But it does help me find all the trade setups I’ll ever need. Check this out:
What exactly is this indicator?
Take the classic, well known RSI, fused with our peculiar tweaks, and here you have the A-RSI, an absolute beast that identifies when prices change direction with great timing.
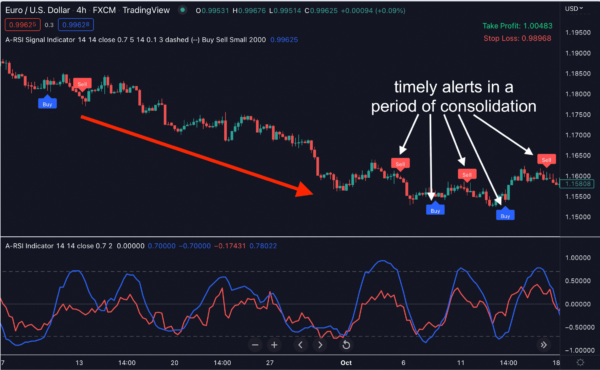
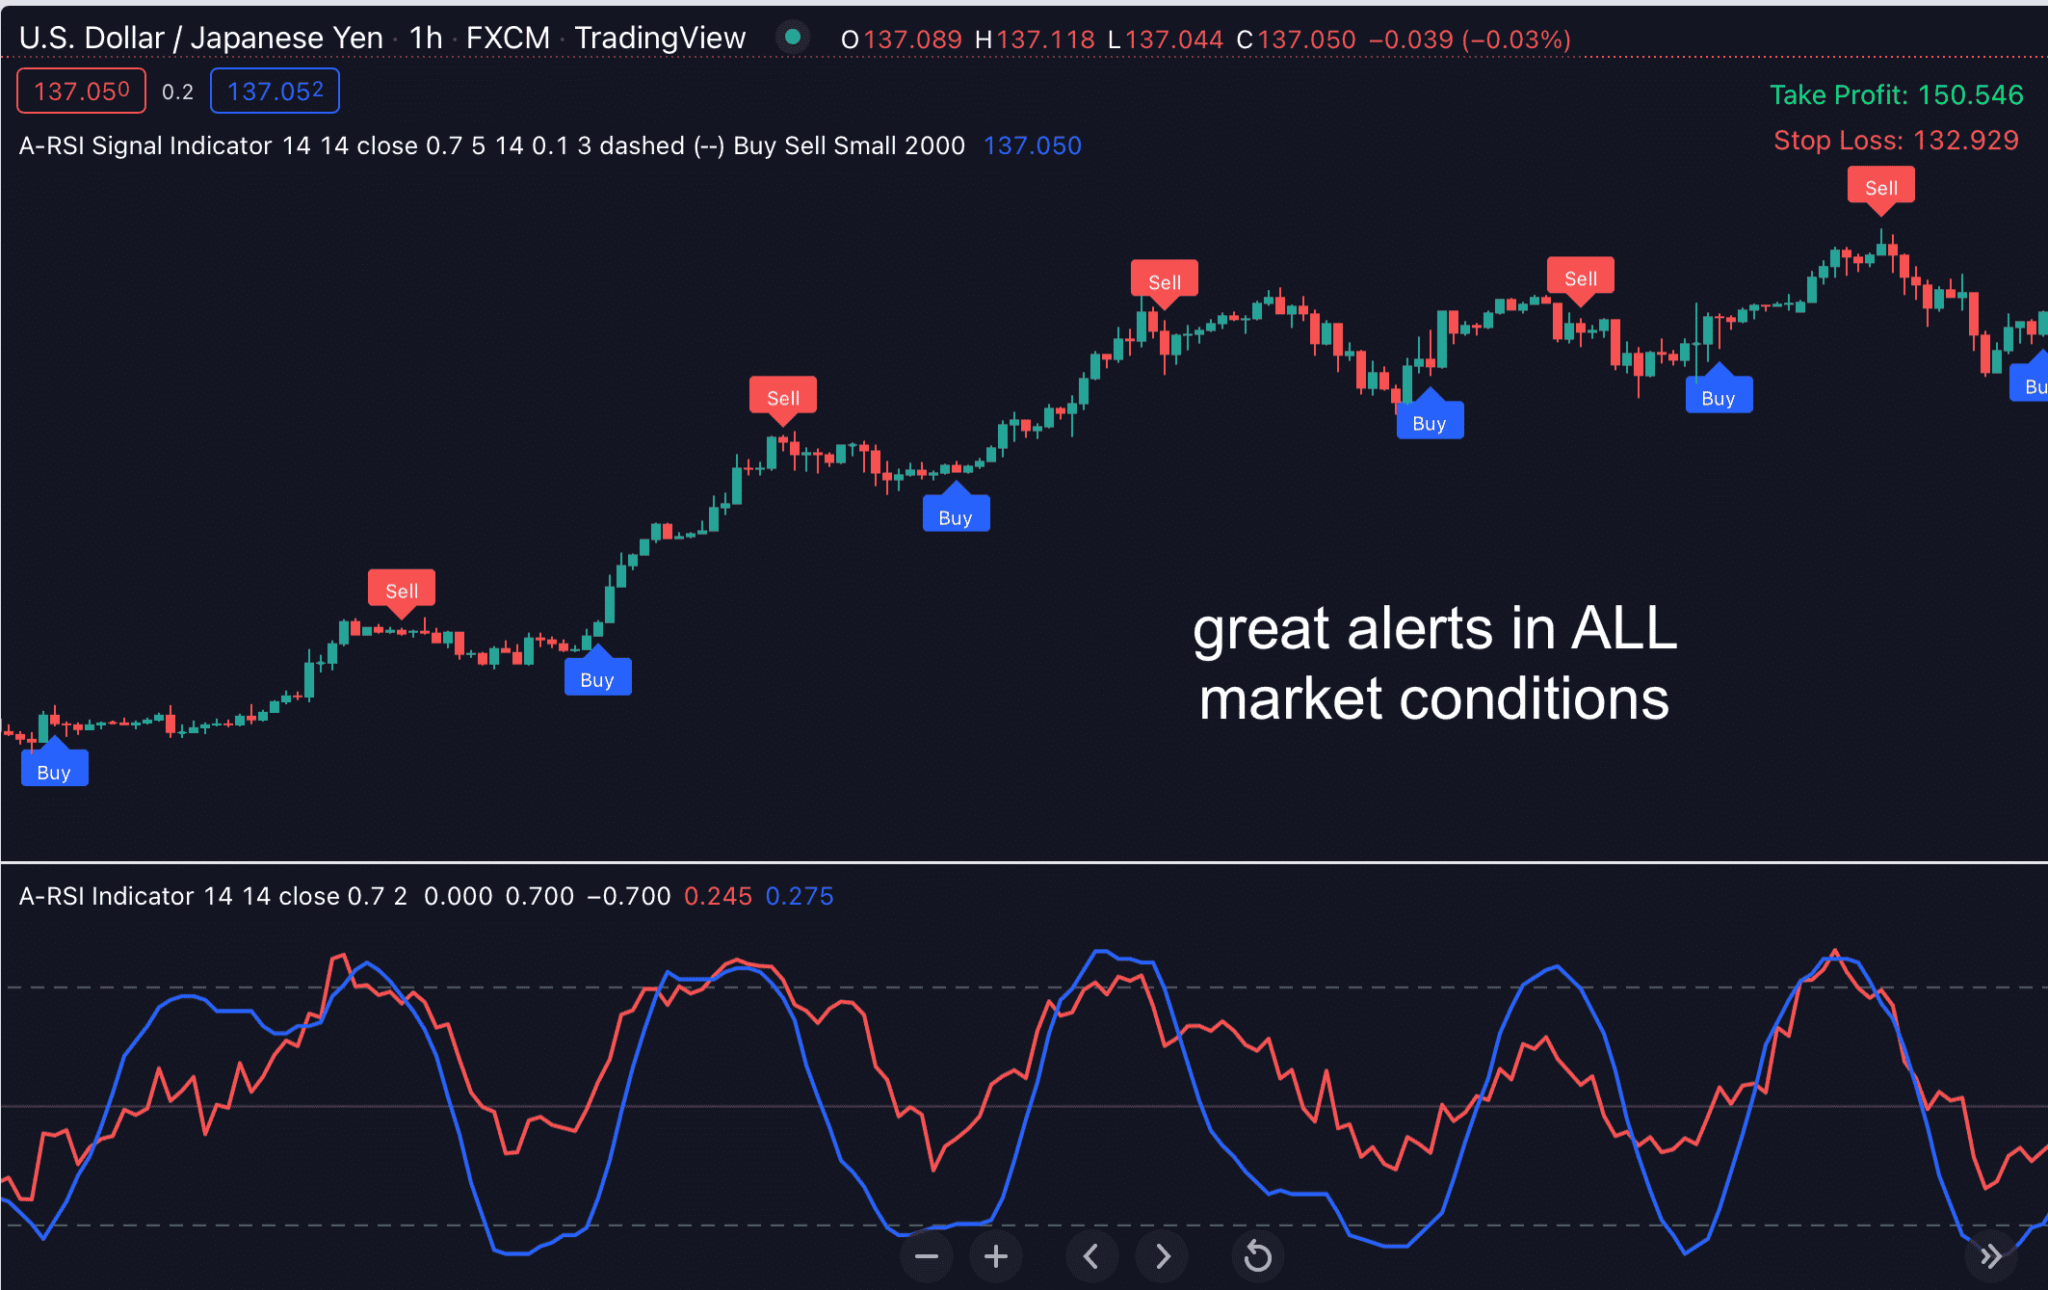
… and it works in both trending and sideways markets.
In a nutshell, A-RSI is the more advanced version of the classic RSI indicator empowered by our proprietary algorithm.
It is a great tool that fits perfectly in any trading strategy, be it reversal, range or trend trading.
Here’s how it works:
A-RSI is a VERSATILE tool for pinpointing when the price changes direction
When the market is moving sideways, it’s difficult to find good trade setups because of the small movements and low volatility.
When the market is trending, it’s tricky to identify good entry points which come after a short counter-trend move or a period of consolidation.
That’s exactly when A-RSI comes in handy, because…
It’s a versatile tool you may use to identify high-probability trade opportunities during ranging & trending markets
A-RSI is built on the classic, super well known Relative Strength Index (RSI), which first became a hit in 1978.
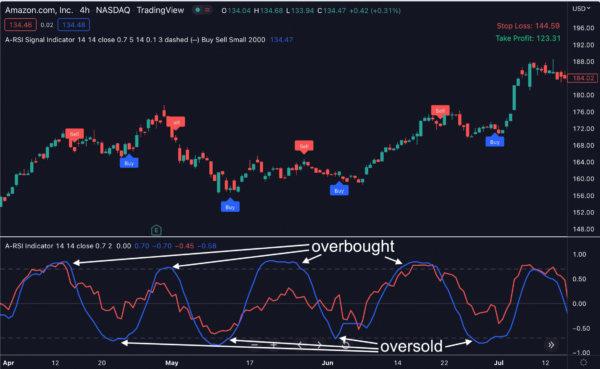
RSI measures recent price changes to identify overbought or oversold conditions, which signal an imminent price correction.
As simple as it seems, the idea behind it is so elegant, it works for decades in MULTIPLE markets.
But… our A-RSI really takes it to the NEXT level…
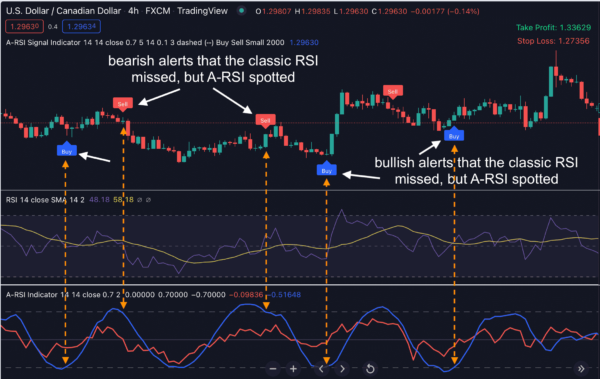
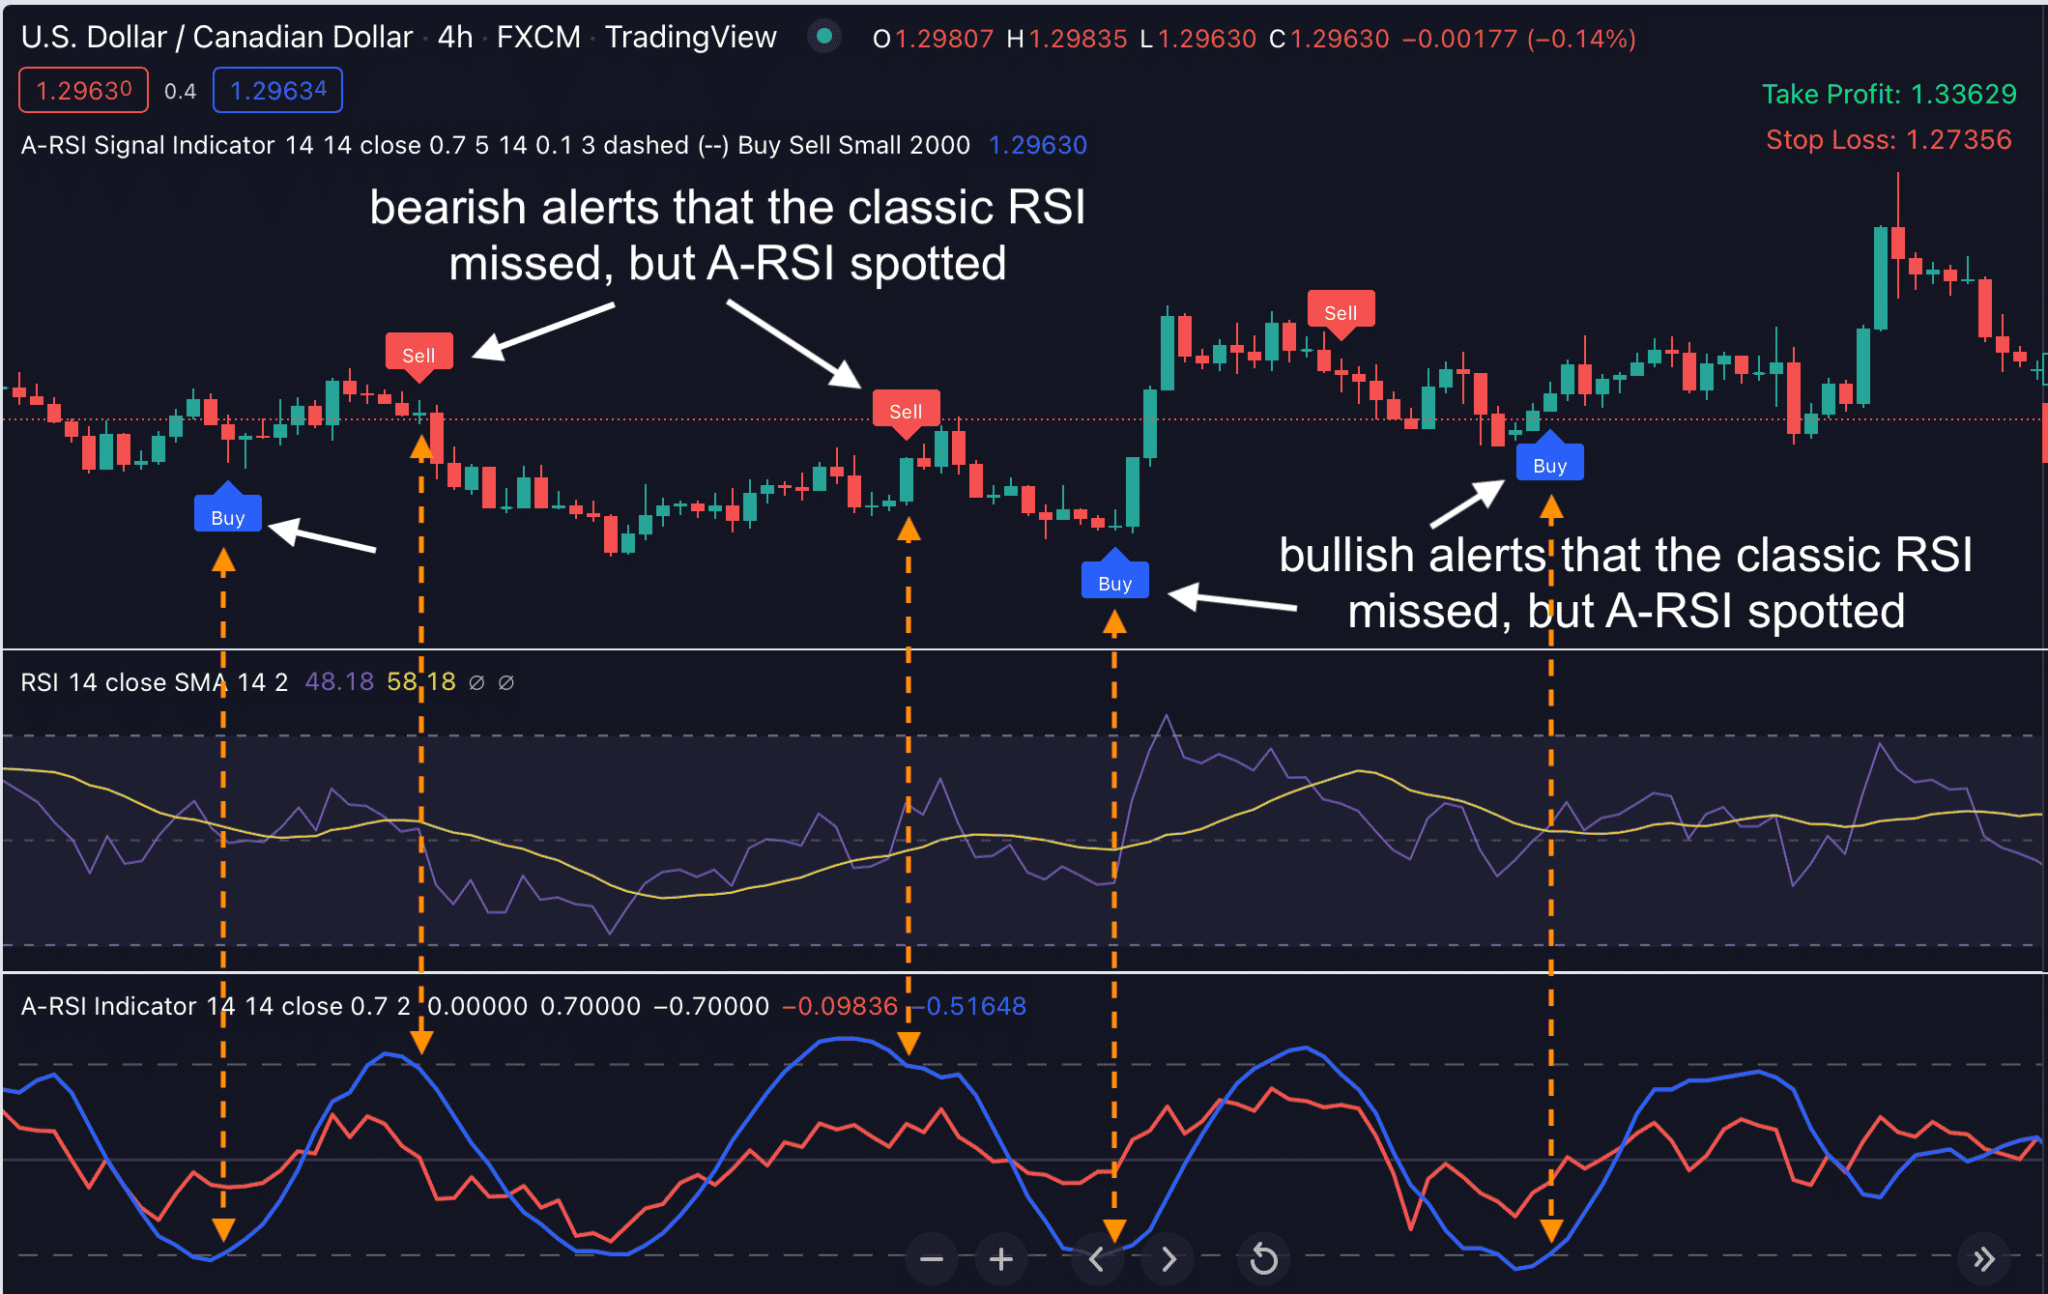
A-RSI spots many great trade setups that RSI may miss…
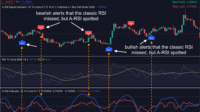
From the chart above, A-RSI identified the first bullish alert, while the classic RSI missed that trade setup. After that, A-RSI spotted 3 bearish alerts as pullback entries, but the classic RSI also missed those great trade setups.
Anyway, here’s another interesting feature of A-RSI
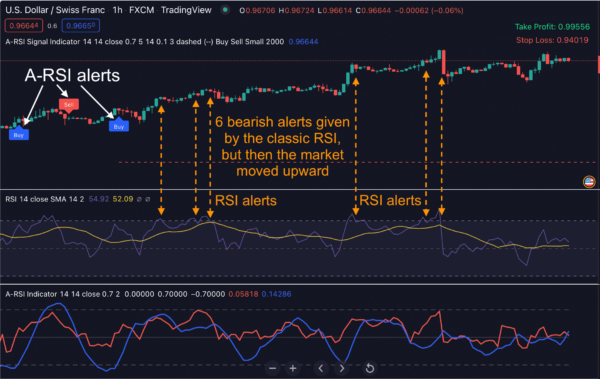
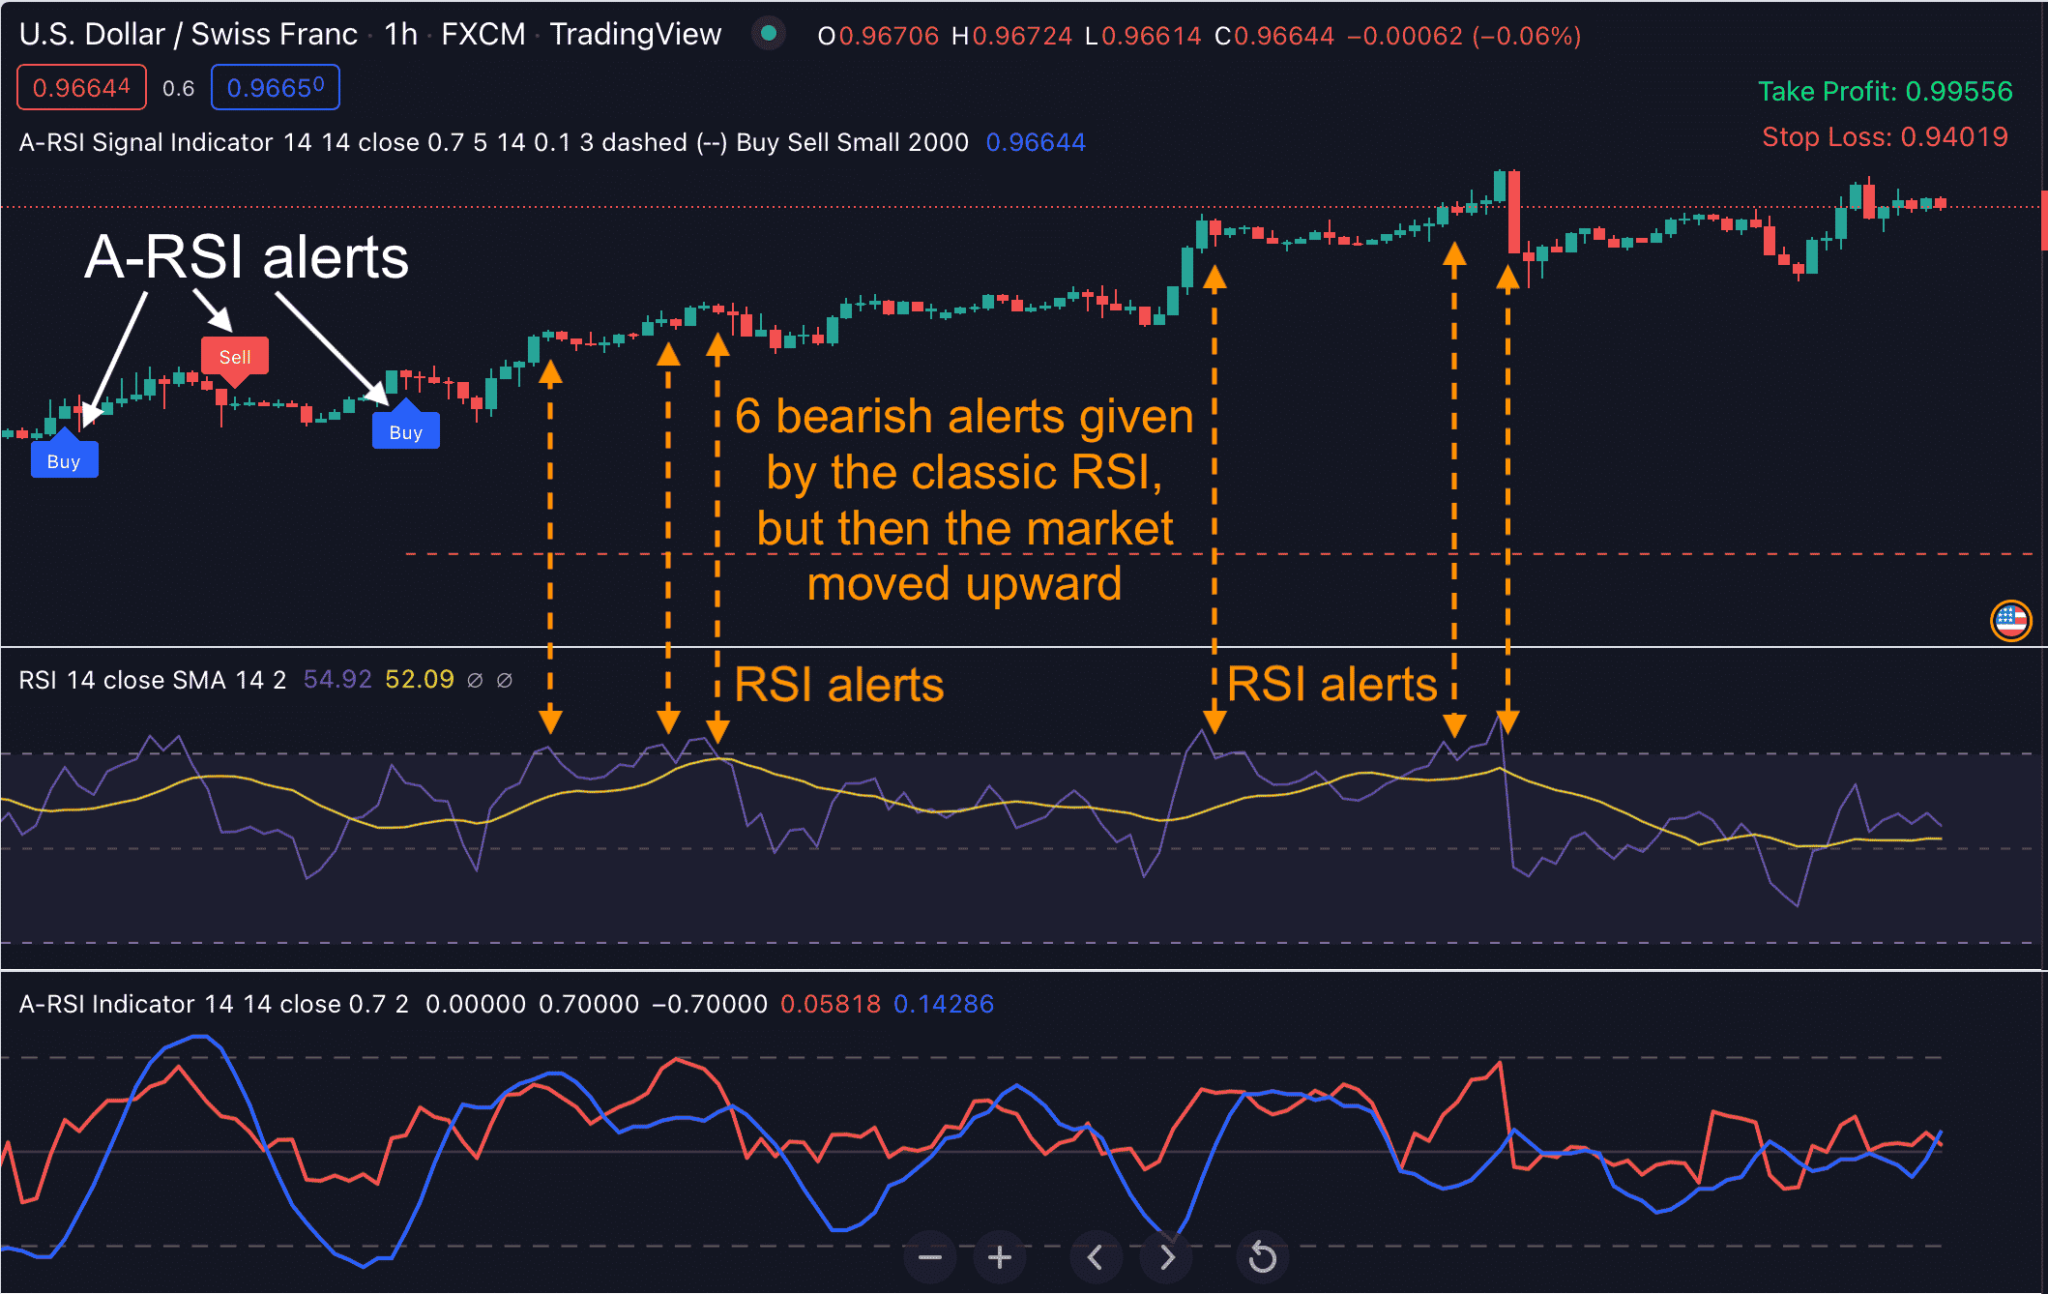
A-RSI is more sensitive to variations of price changes…
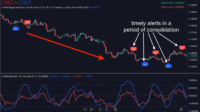
You can see from the chart above, the 2 bearish alerts given by the classic RSI were false signals, because the market moved sideways or upward right after the alerts. The 2 bullish alerts given by A-RSI were still accurate, because the price moved upward after that.
Take a look at this exciting chart below.
I’m so excited with this indicator, I could go on for days and nights about it.
But let me just share with you some of my personal trading strategies you can easily apply this to…
Identify great pullback entries when the market is trending…
Profiting with this classic pullback trading is harder than it looks.
However, A-RSI makes it much easier for you.
In trending markets, A-RSI give me an easy way to trade pullbacks. It gives you low-risk entries with good reward-to-risk ratio.
My personal trading rule is simple:
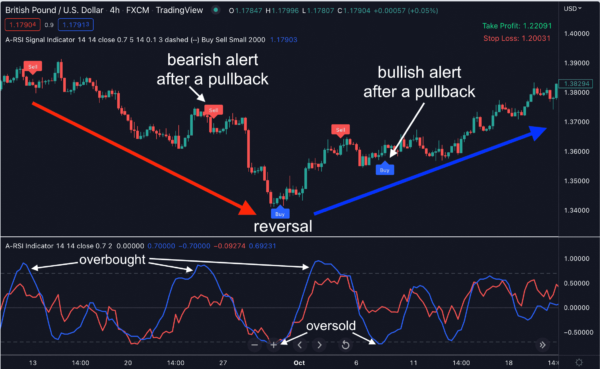
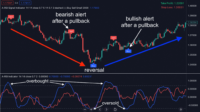
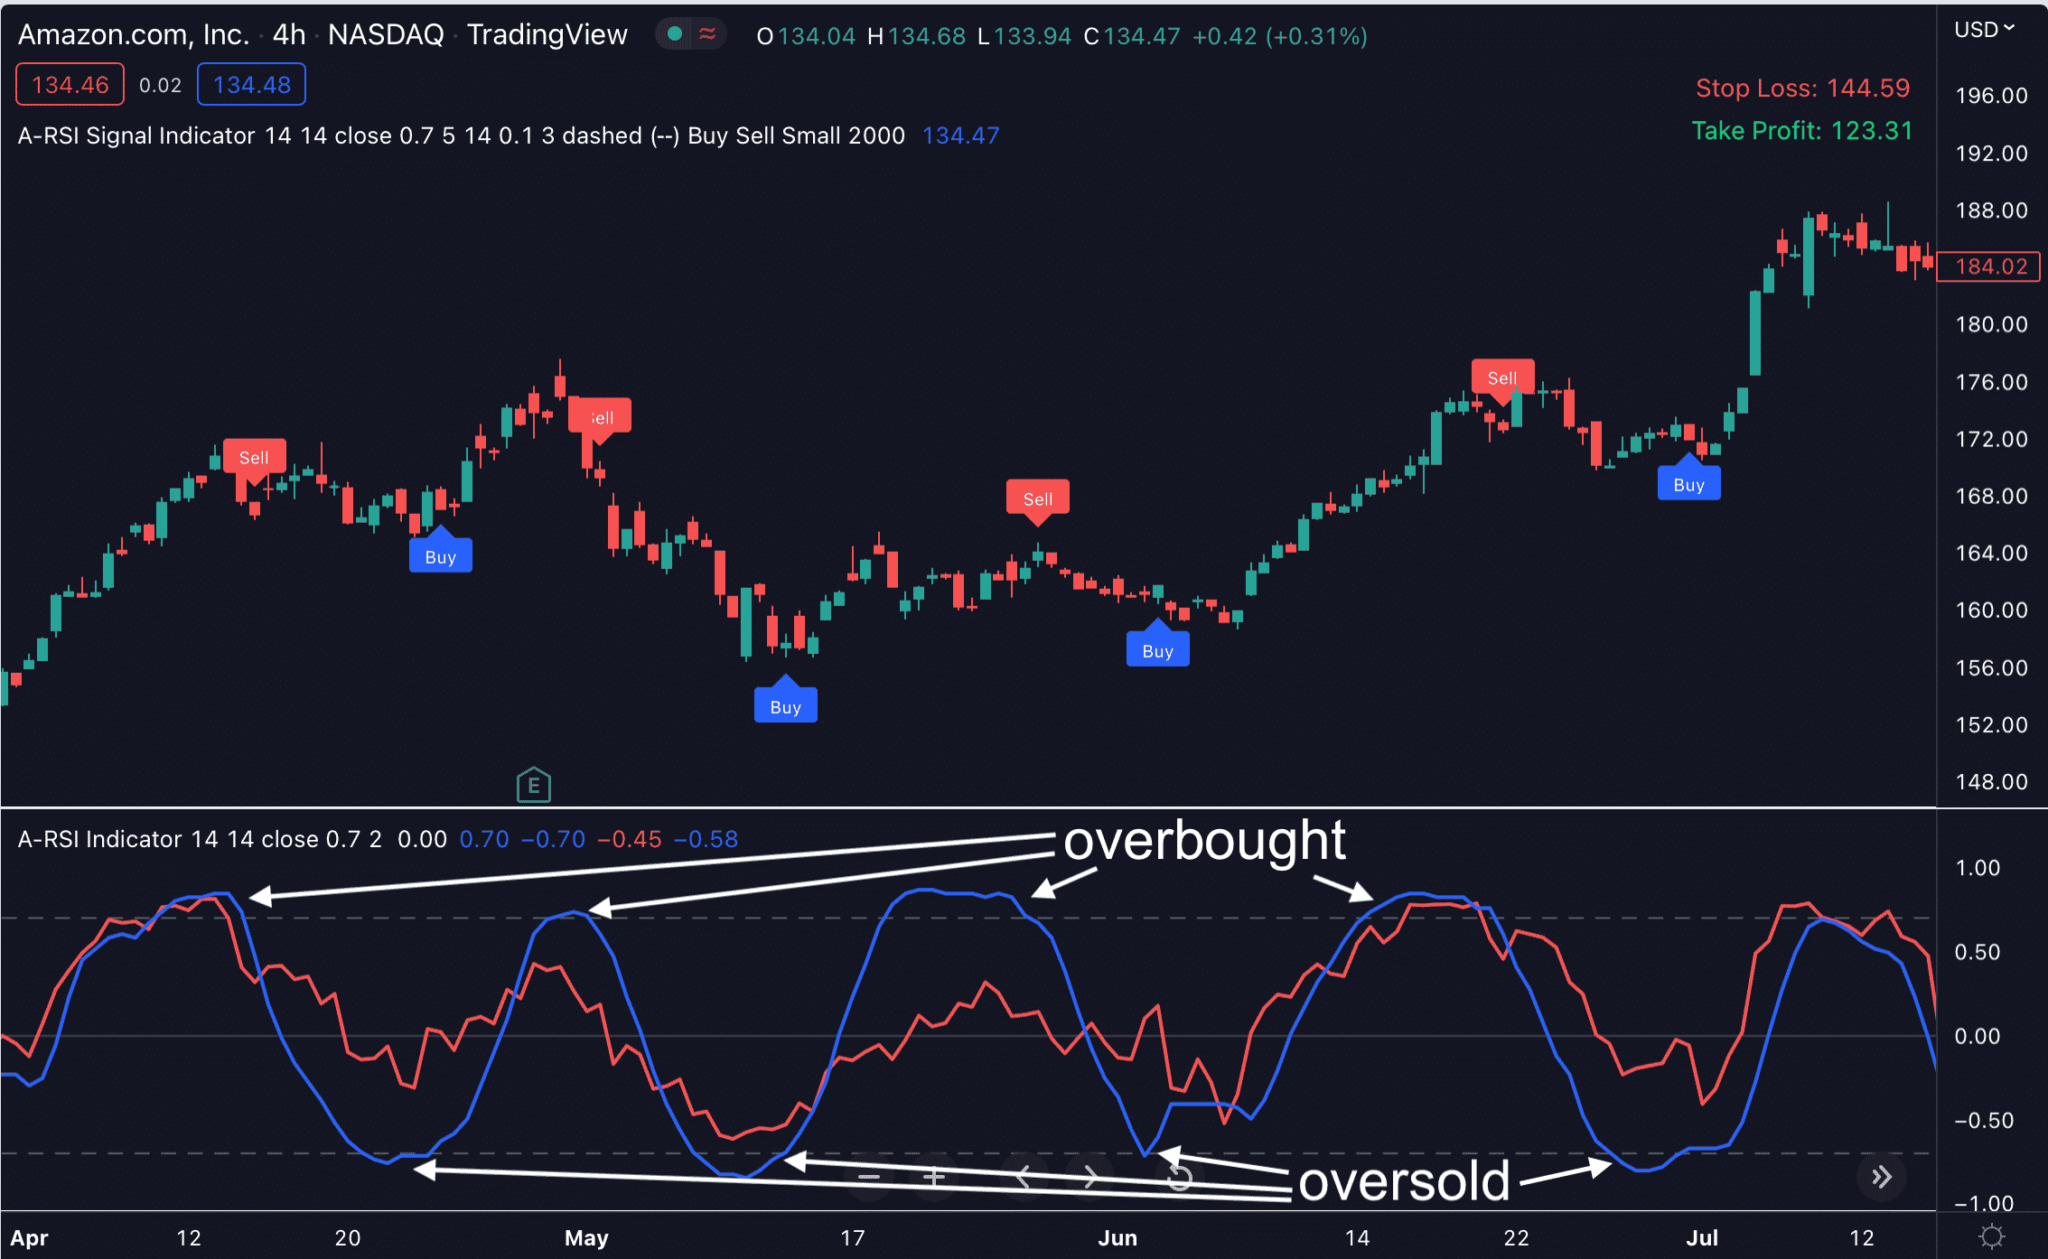
In an uptrend, enter when the A-RSI indicator signals oversold conditions (its value is below -0.7). And in a downtrend, enter when the indicator signals overbought conditions (its value is above +0.7).
The blue or red arrow flagged by A-RSI indicates the position where a price correction takes place. The price will reverse after a pullback and move in the direction of the prevailing trend.
A-RSI is particularly helpful when it comes to spotting divergences and trend reversals…
A-RSI is very useful for detecting divergences which may be great signals for the beginning of major uptrends/downtrends.
When a bullish divergence is detected, the current downtrend is exhausted and we can expect a trend reversal. That could be the beginning of a new major uptrend.
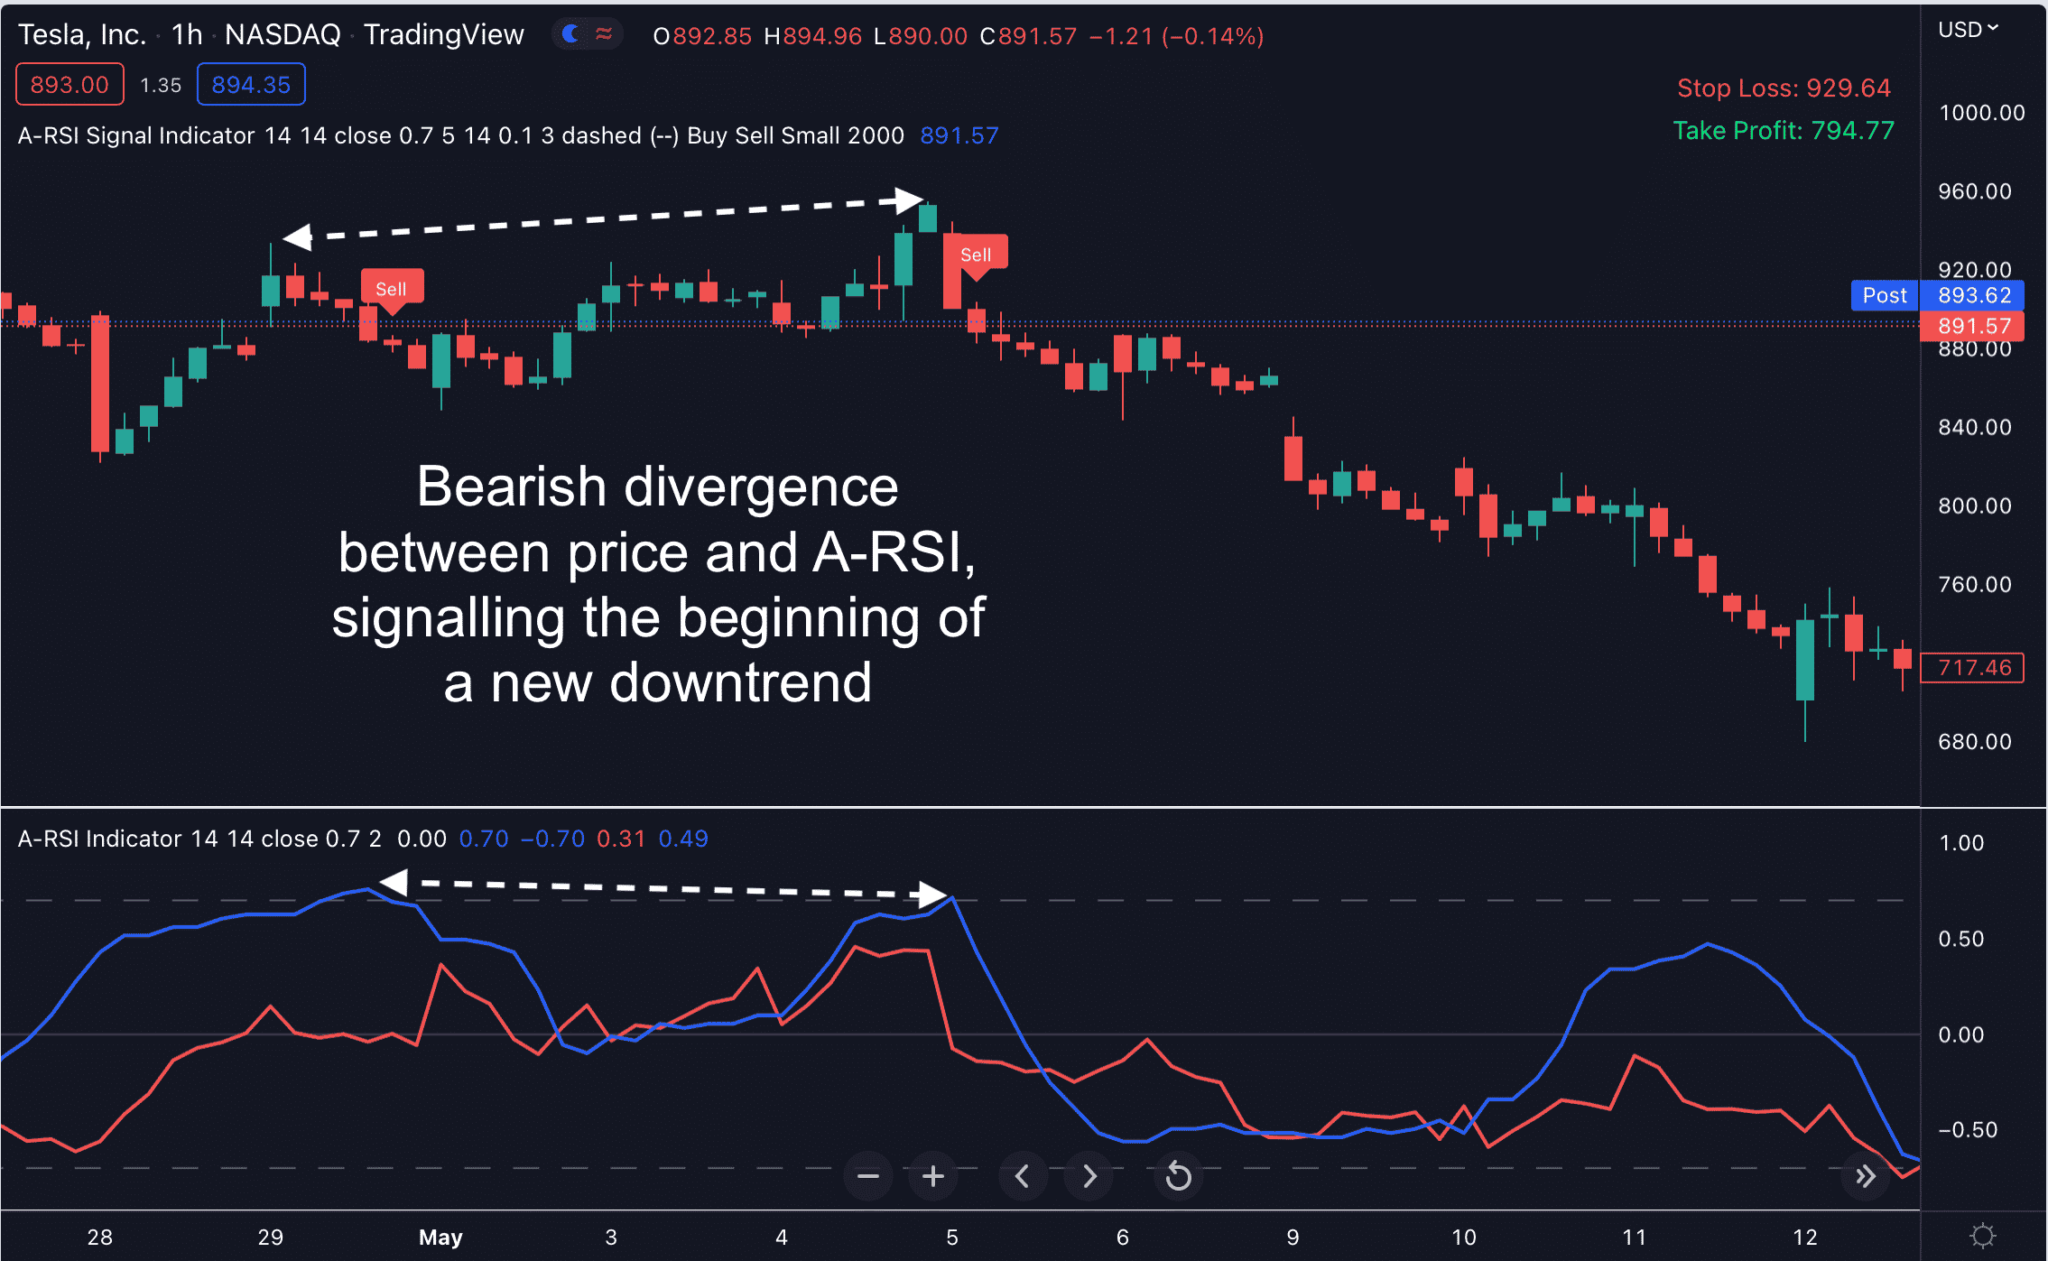
Likewise, when a bearish divergence is detected, the existing uptrend is weakened. And we can expect the price to reverse and start a new downtrend.
Being able to detect a trend reversal is about to happen, you can open a position right at the beginning of a new trend and rake in profit.
Have a look at this exciting chart to know how to spot divergences and trend reversals.
Frequently Asked Questions
After purchasing, you’ll fill out a short form that asks for your Tradingview username. And then, we’ll grant your username access to all our indicators within 24 hours.
It works on ALL markets internationally that are available on Tradingview: FX, stocks, indices, commodities, futures, etc…

