Frequently Bought Together

+
Buy all these together to get this price: Original price was: $598.00.Current price is: $418.60. Save $179.40

Market Mode Finder for TradingView

$299.00

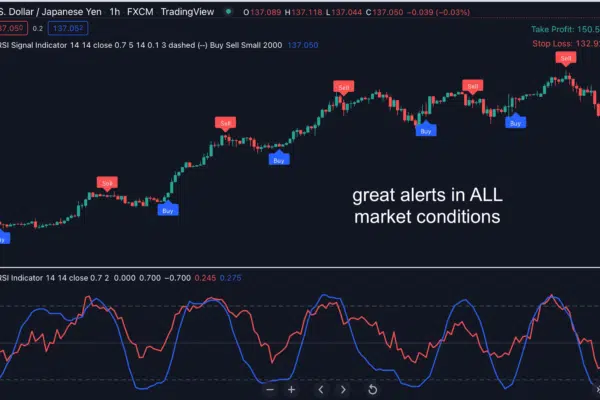
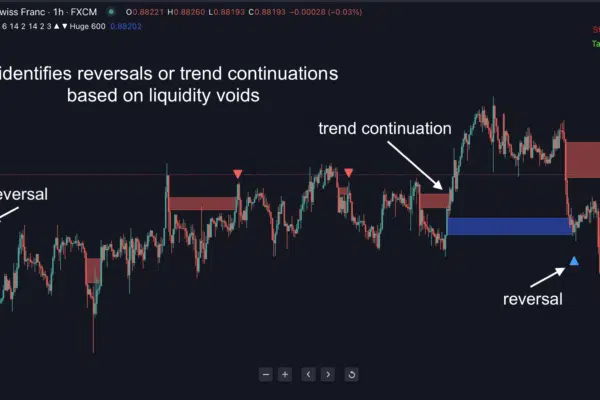
✅ It gives accurate readings that can tell the market condition. You can then expect the price to be choppy with abrupt moves, or steady with a clear trend.

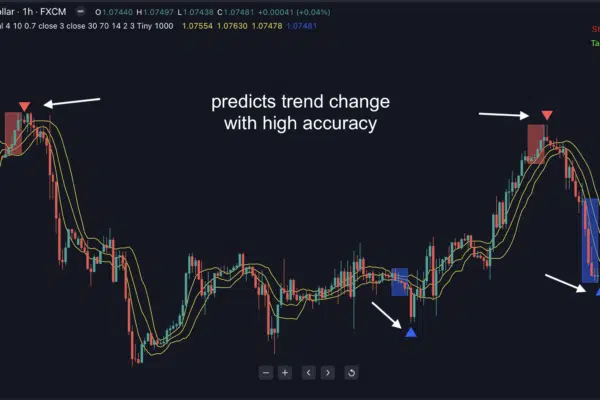
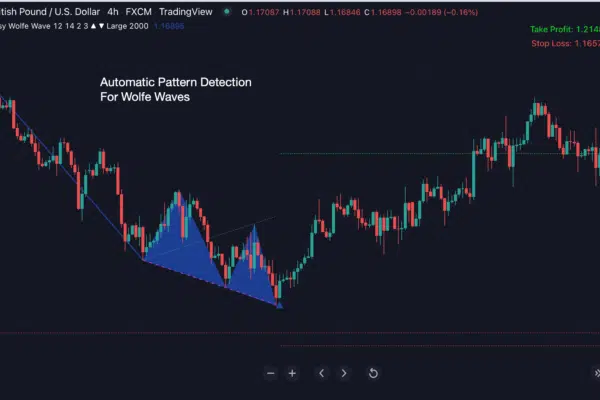
✅ It precisely identifies right time to enter the market, based on the accurate determination of the market to be ranging (mean-reverting) or trending.

✅ It works in all market conditions, be it ranging, uptrend or downtrend; and identifies great entry points for you. Makes your trading become easier.

What exactly is this indicator?

Mean reversion strategies help capture profits when the price returns to normal levels or the average. Normal traders measure the distance between the price and the SMA, or use Bollinger Bands, regression channels, Keltner channels… to identify when the price is near extreme levels and may reverse. These indicators cannot work when the price is moving in an uptrend or downtrend.

On the other hand, trend-following indicators will tell if the price is in an uptrend or downtrend, but is useless when the market is moving in a range (or mean-reverting).

That is where the Market Mode Finder comes in. This Market Mode Finder indicator is developed to work in both market conditions: trending or ranging.

Its complex algorithm helps evaluate the market conditions based on the volatility of relative difference between adjacent close prices. Rising value indicates uncertainty and choppy price movements. Falling value indicates less anxiety and increased certainty in market direction.

It then uses the appropriate trading strategies to identify accurate entries. When the price oscillates around the mean, it will use range (mean reversion) trading strategies. When the price accelerates away from the mean, it will use trend trading strategies.

What exactly does it do?

The indicator determines the conditions of the market based on standard deviation of relative price difference between adjacent candles, using large historical data. Its readings can be interpreted as follows:

When its reading is high, the relative price differences are spread out over a wide range, the price is choppy, the market is in ranging (mean-reverting) mode.

When its reading is low, the relative price differences tend to be close to the mean, the price is steady, the market is in trending mode.
In ranging (mean-reverting) markets, the indicator uses RSI to identify entries.

In trending markets, the indicator uses SMA to determine the crossing between SMA and the price, and from that it identifies entries.

It gives accurate readings that can tell the market condition. You can then expect the price to be choppy with abrupt moves, or steady with a clear trend.

Reading is below 0.5 and the color of the graph/histogram is blue: trending mode

Reading is above 0.5 and the color of the graph/histogram is yellow: ranging (mean-reverting) mode

It precisely identifies right time to enter the market, based on the accurate determination of the market to be ranging (mean-reverting) or trending.

It works in all market conditions, be it ranging, uptrend or downtrend; and identifies great entry points for you. Makes your trading become easier.

You can use it on multiple time frames and pairs to identify as many trade setups as you can.

Below is the 15-minute timeframe…

Below is the 4-hour timeframe…

Timely alerts, so you won’t miss out on important trades.


You’ll get all kinds of alerts: Pop-up, Sound, Email, and Push Notifications as soon as a new zone appears…

And you can customize these alerts in any way you want.

Frequently Asked Questions

After purchasing, you’ll fill out a short form that asks for your Tradingview username. And then, we’ll grant your username access to all our indicators within 24 hours.

It works on ALL markets internationally that are available on Tradingview: FX, stocks, indices, commodities, futures, etc…

Customer Reviews

0