


Market Mode Finder for TradingView
Know when the market is about to shift — whether it’s chopping around or ready to trend hard 🚀
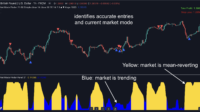
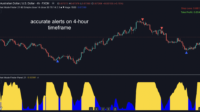
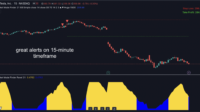
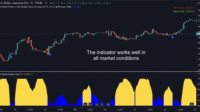
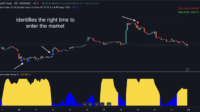
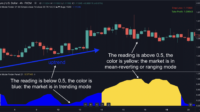
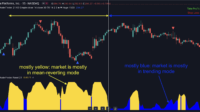
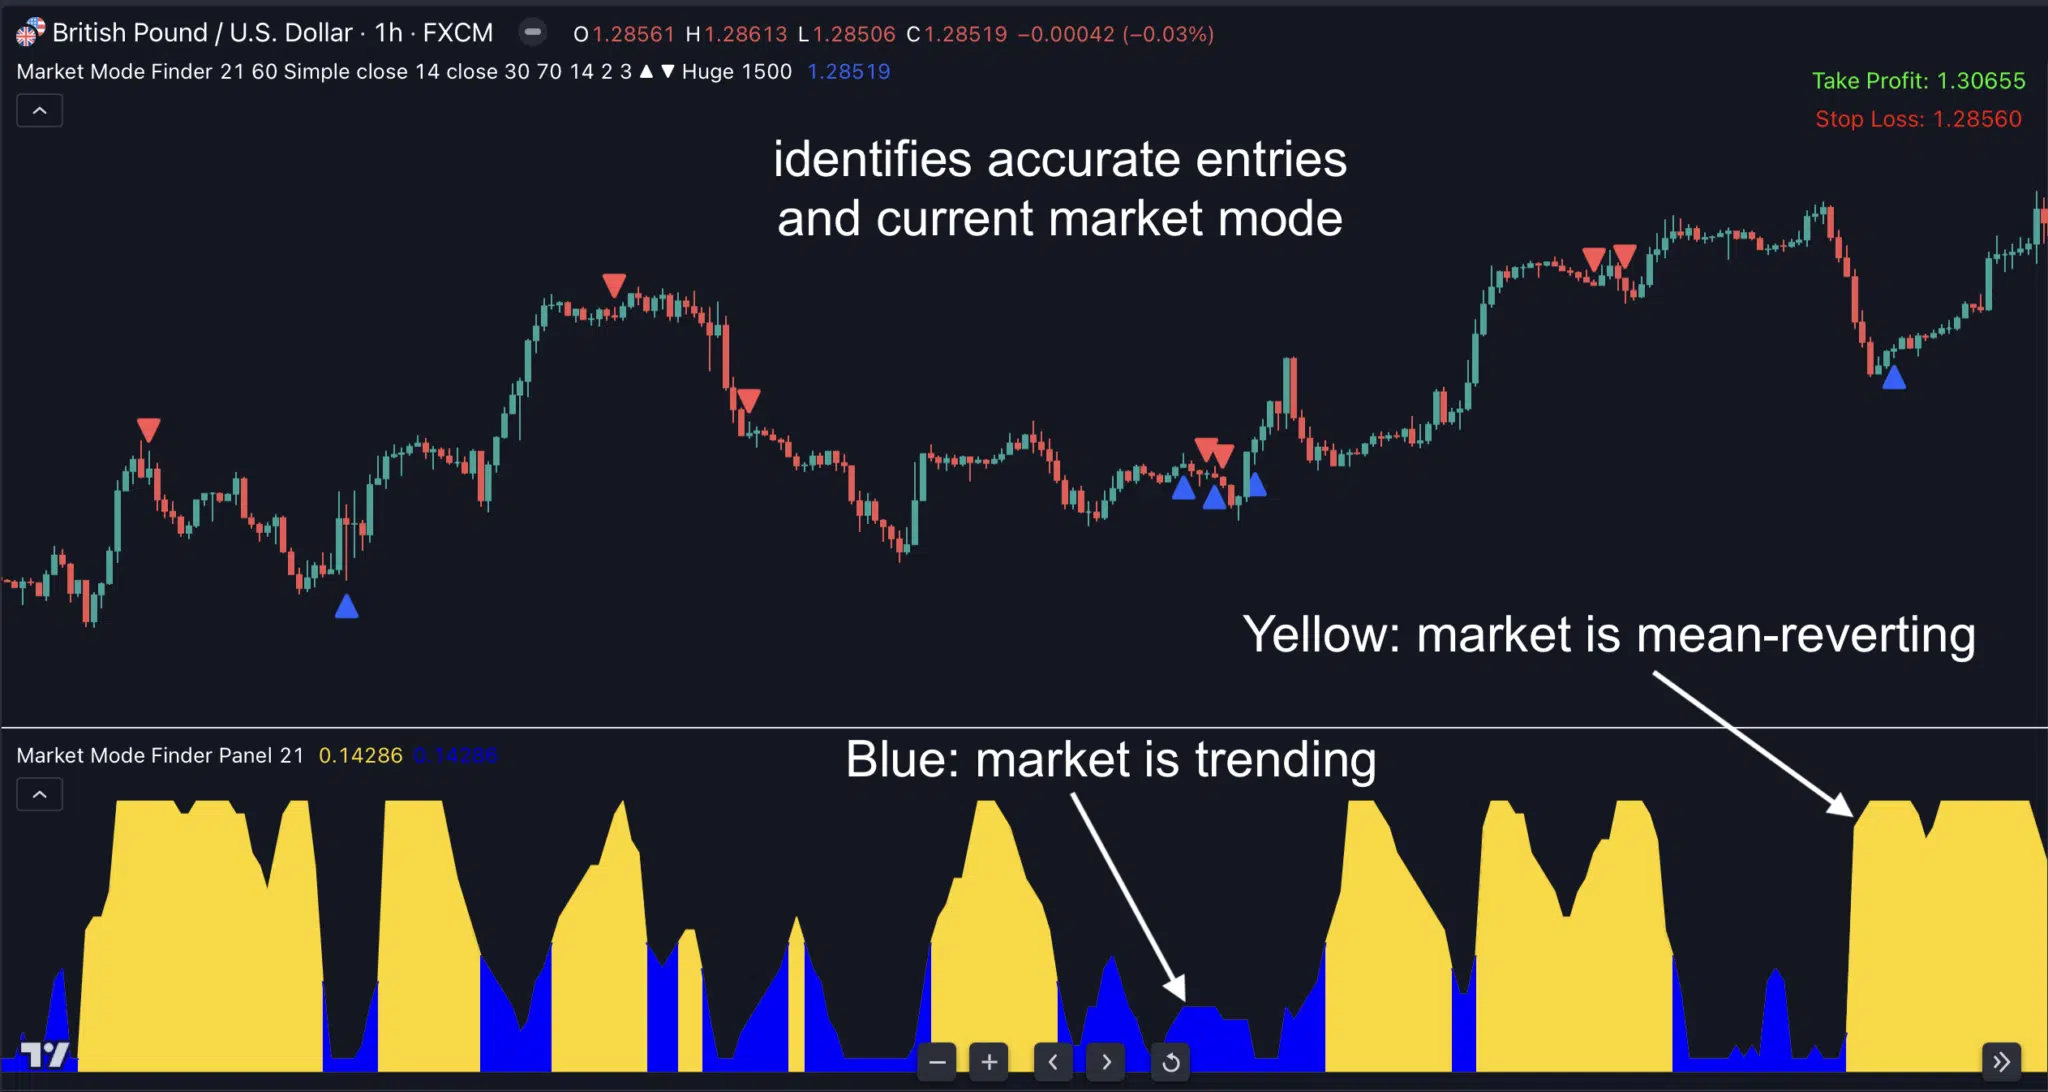
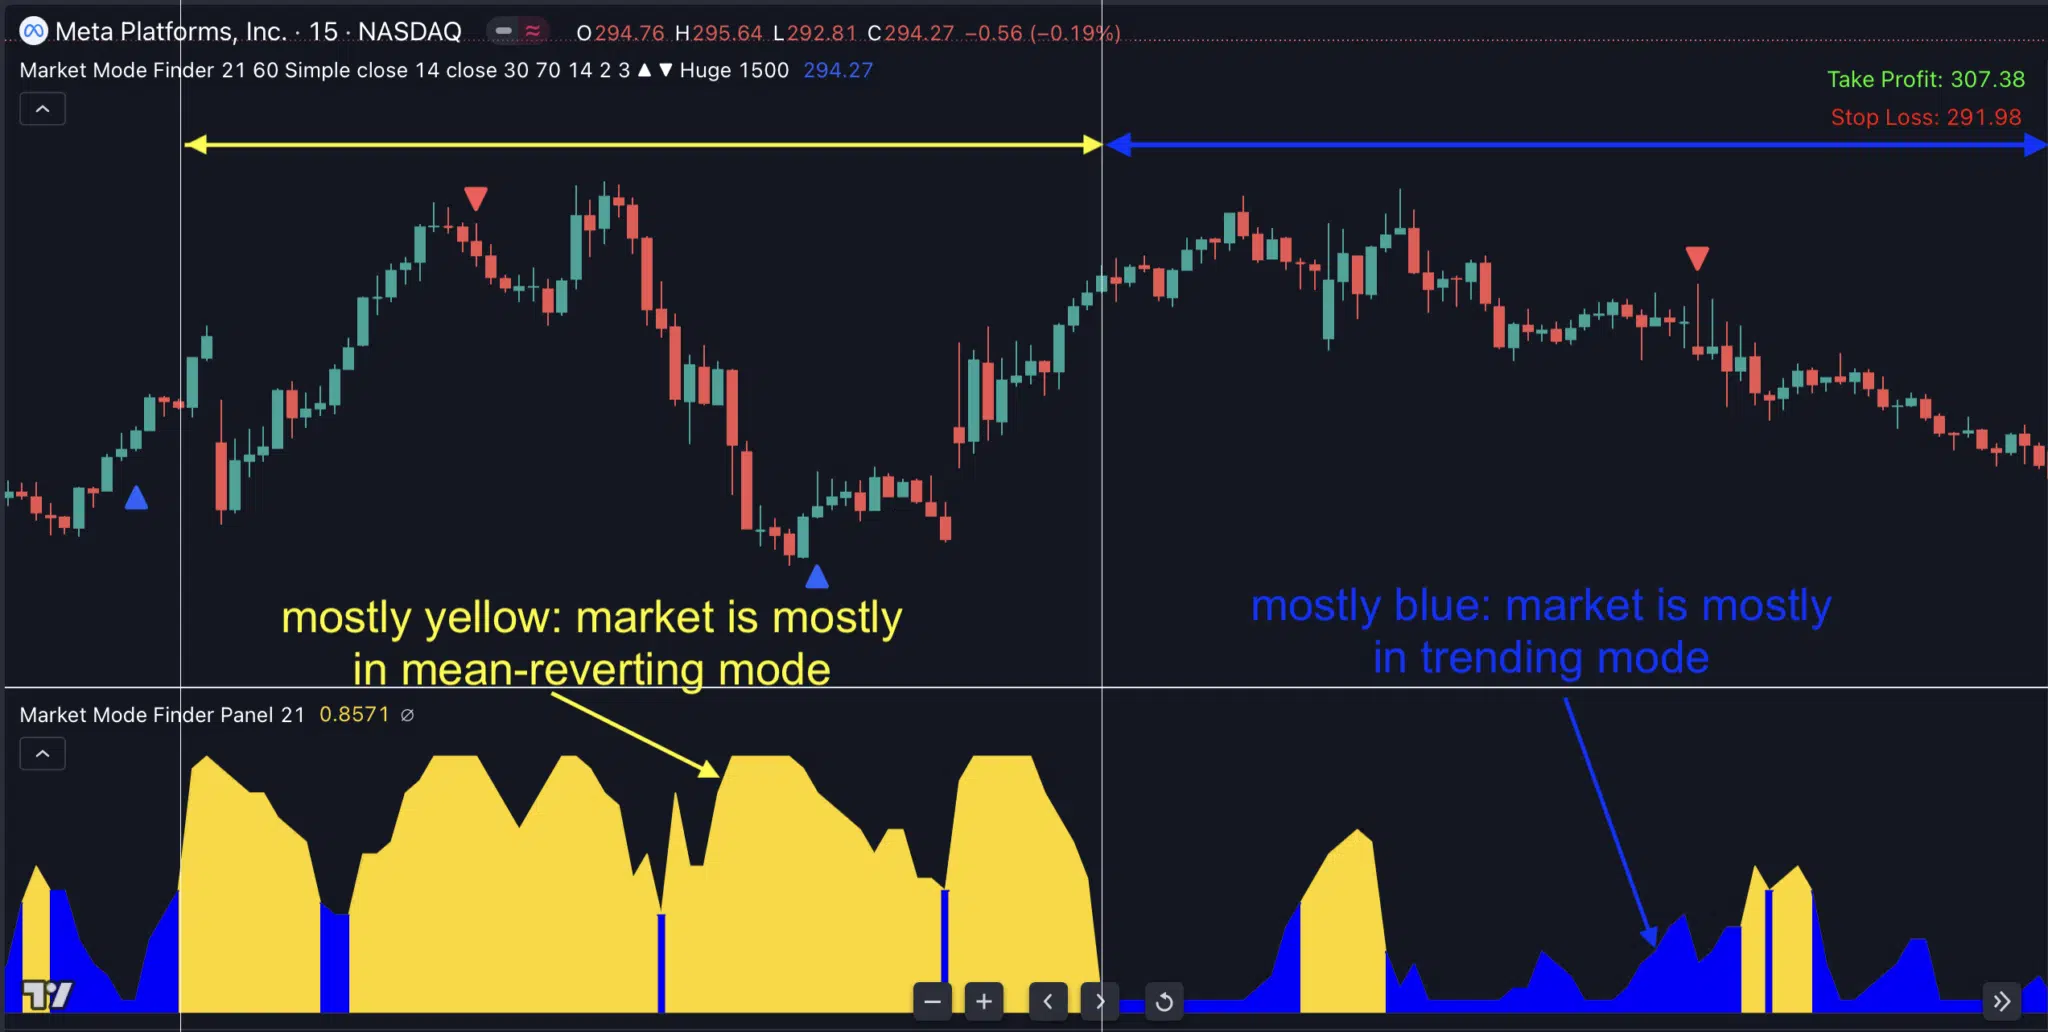
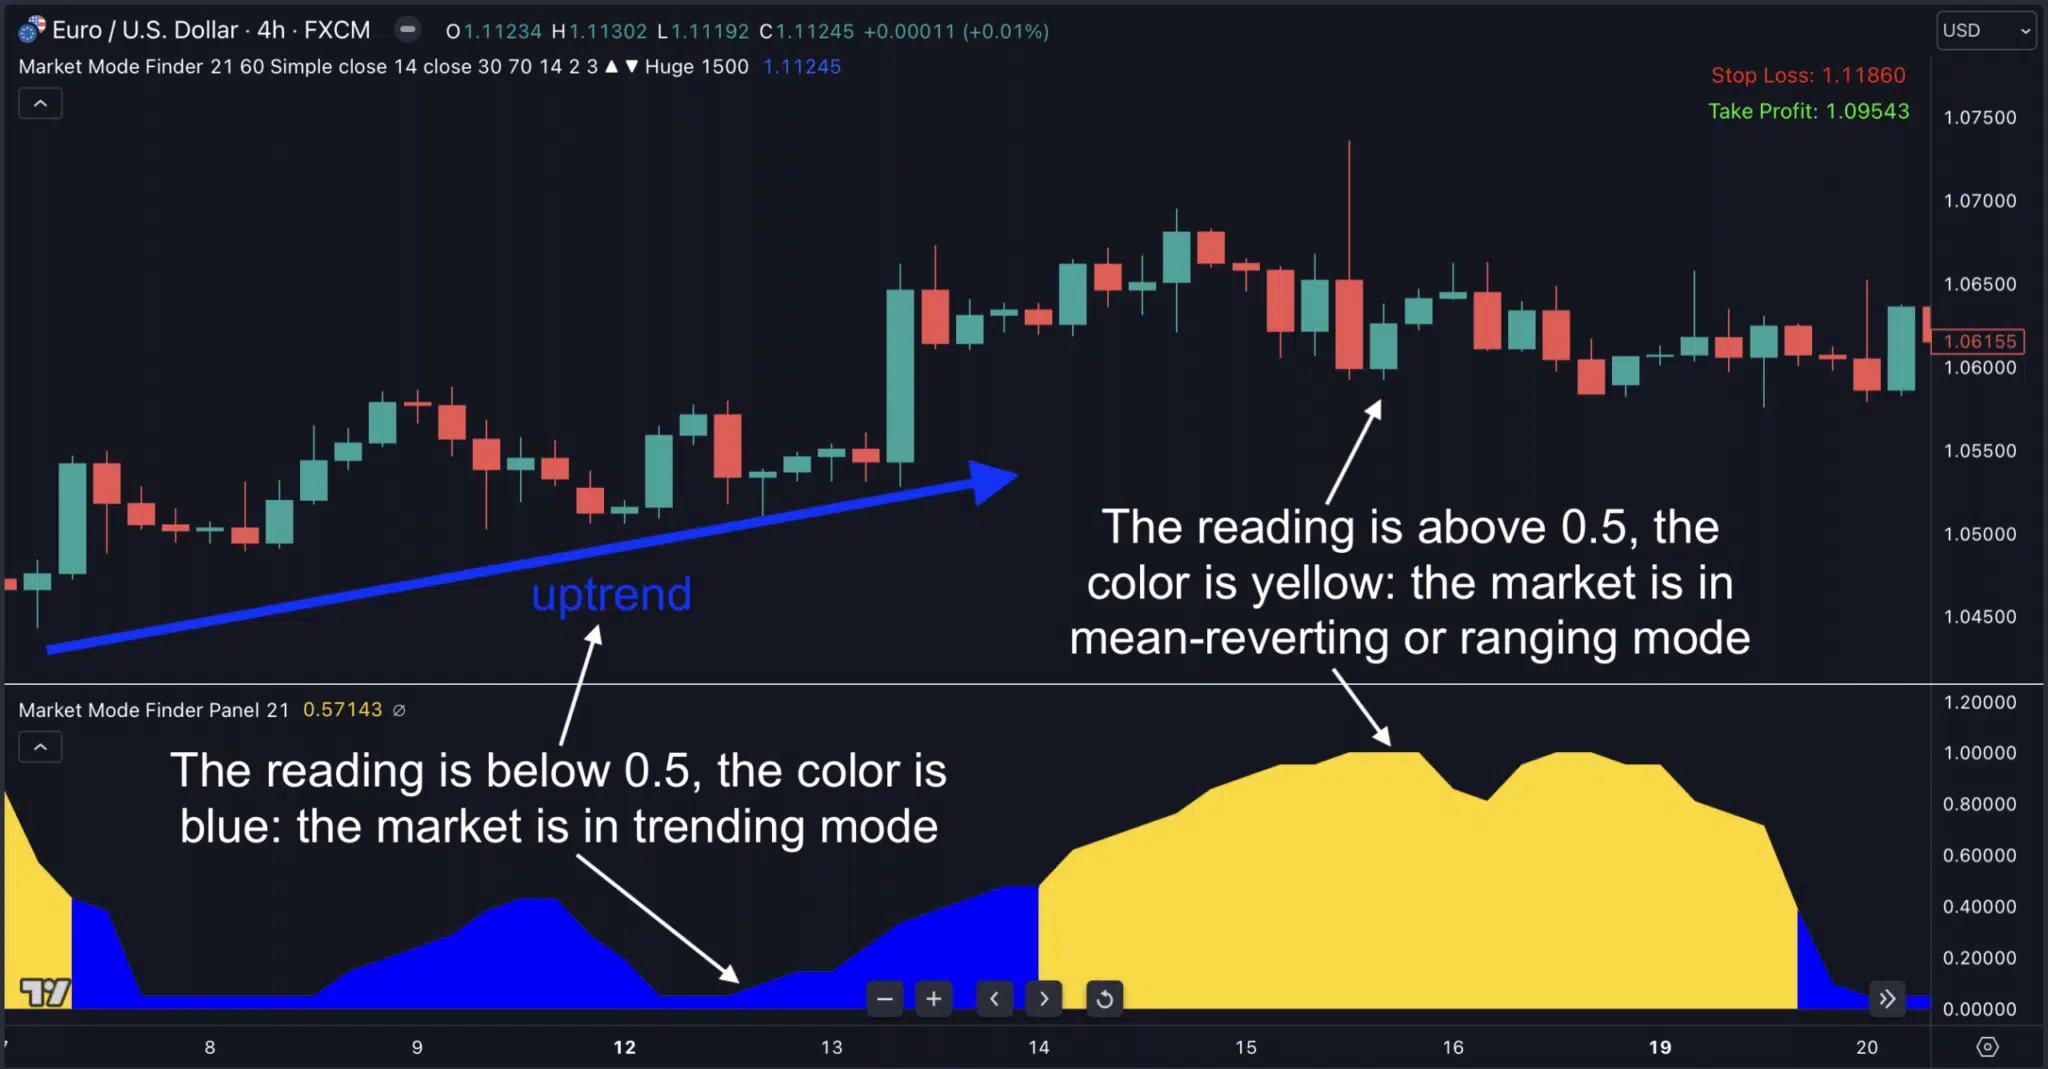
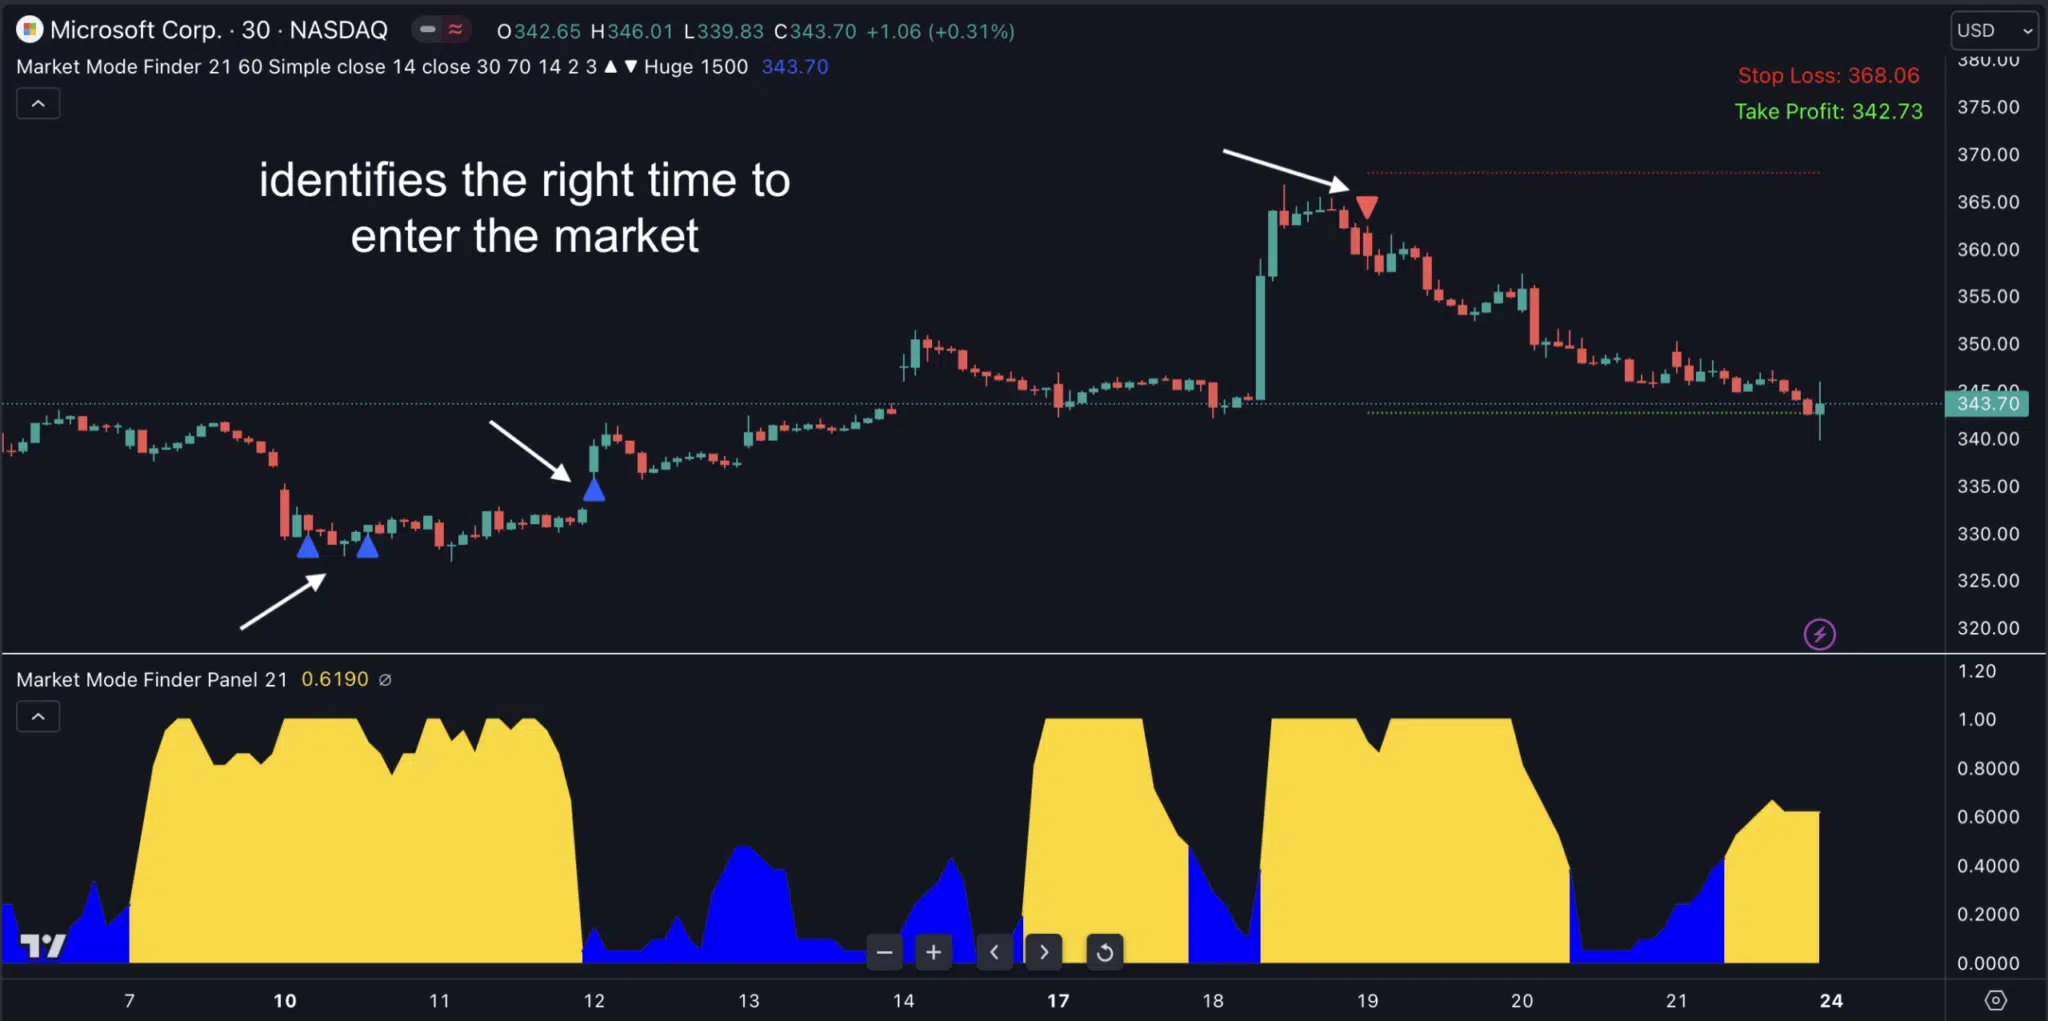
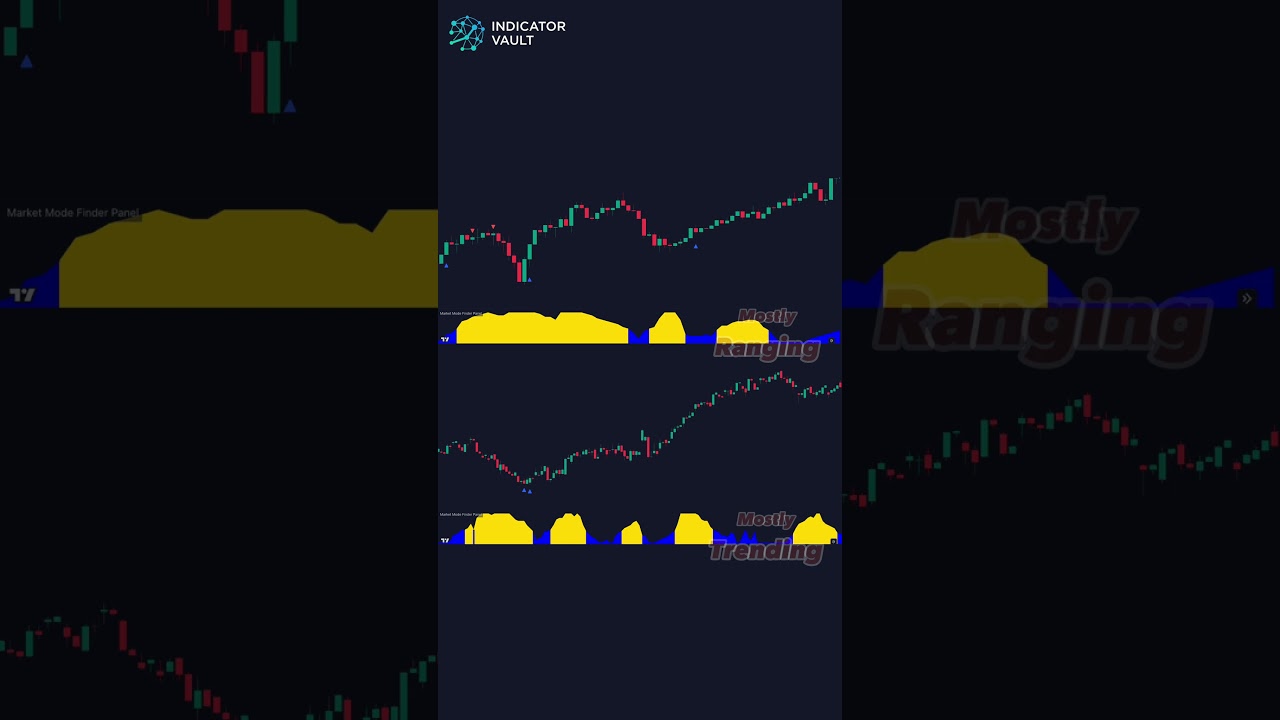
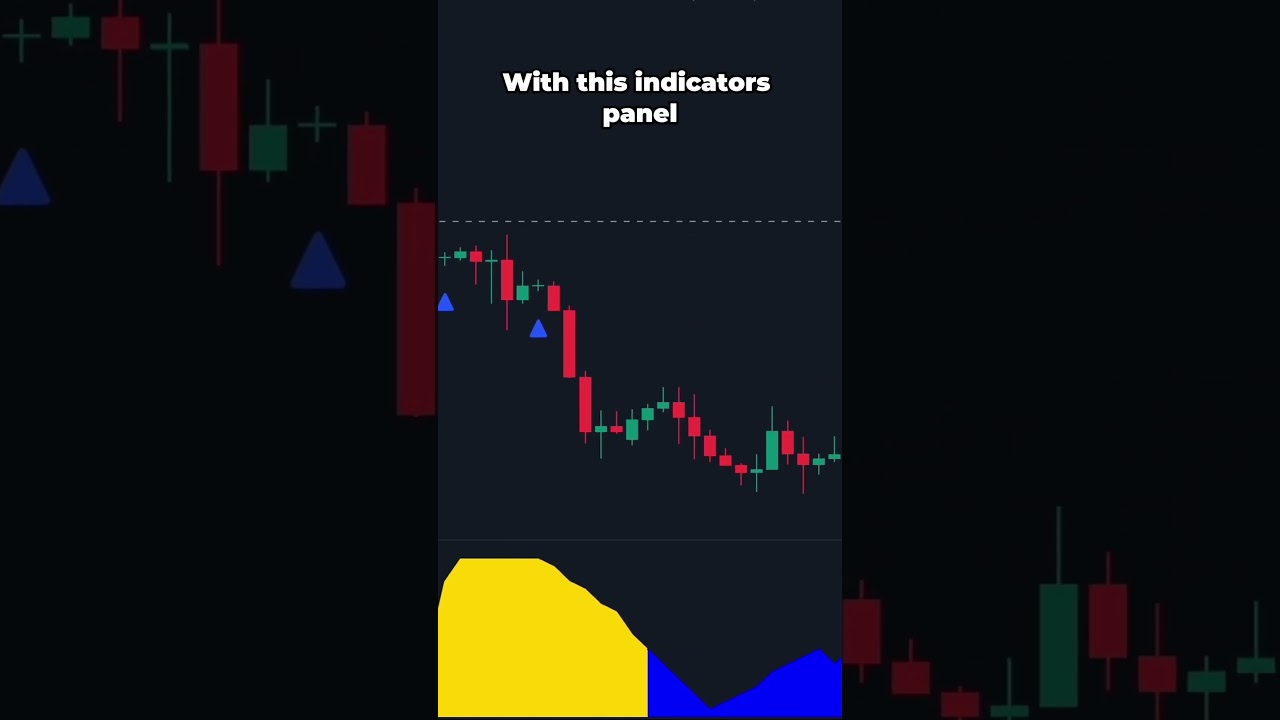
📌 Instantly identify market mode — ranging vs trending — so you stop guessing and start trading with clarity.
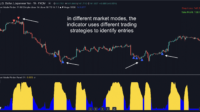
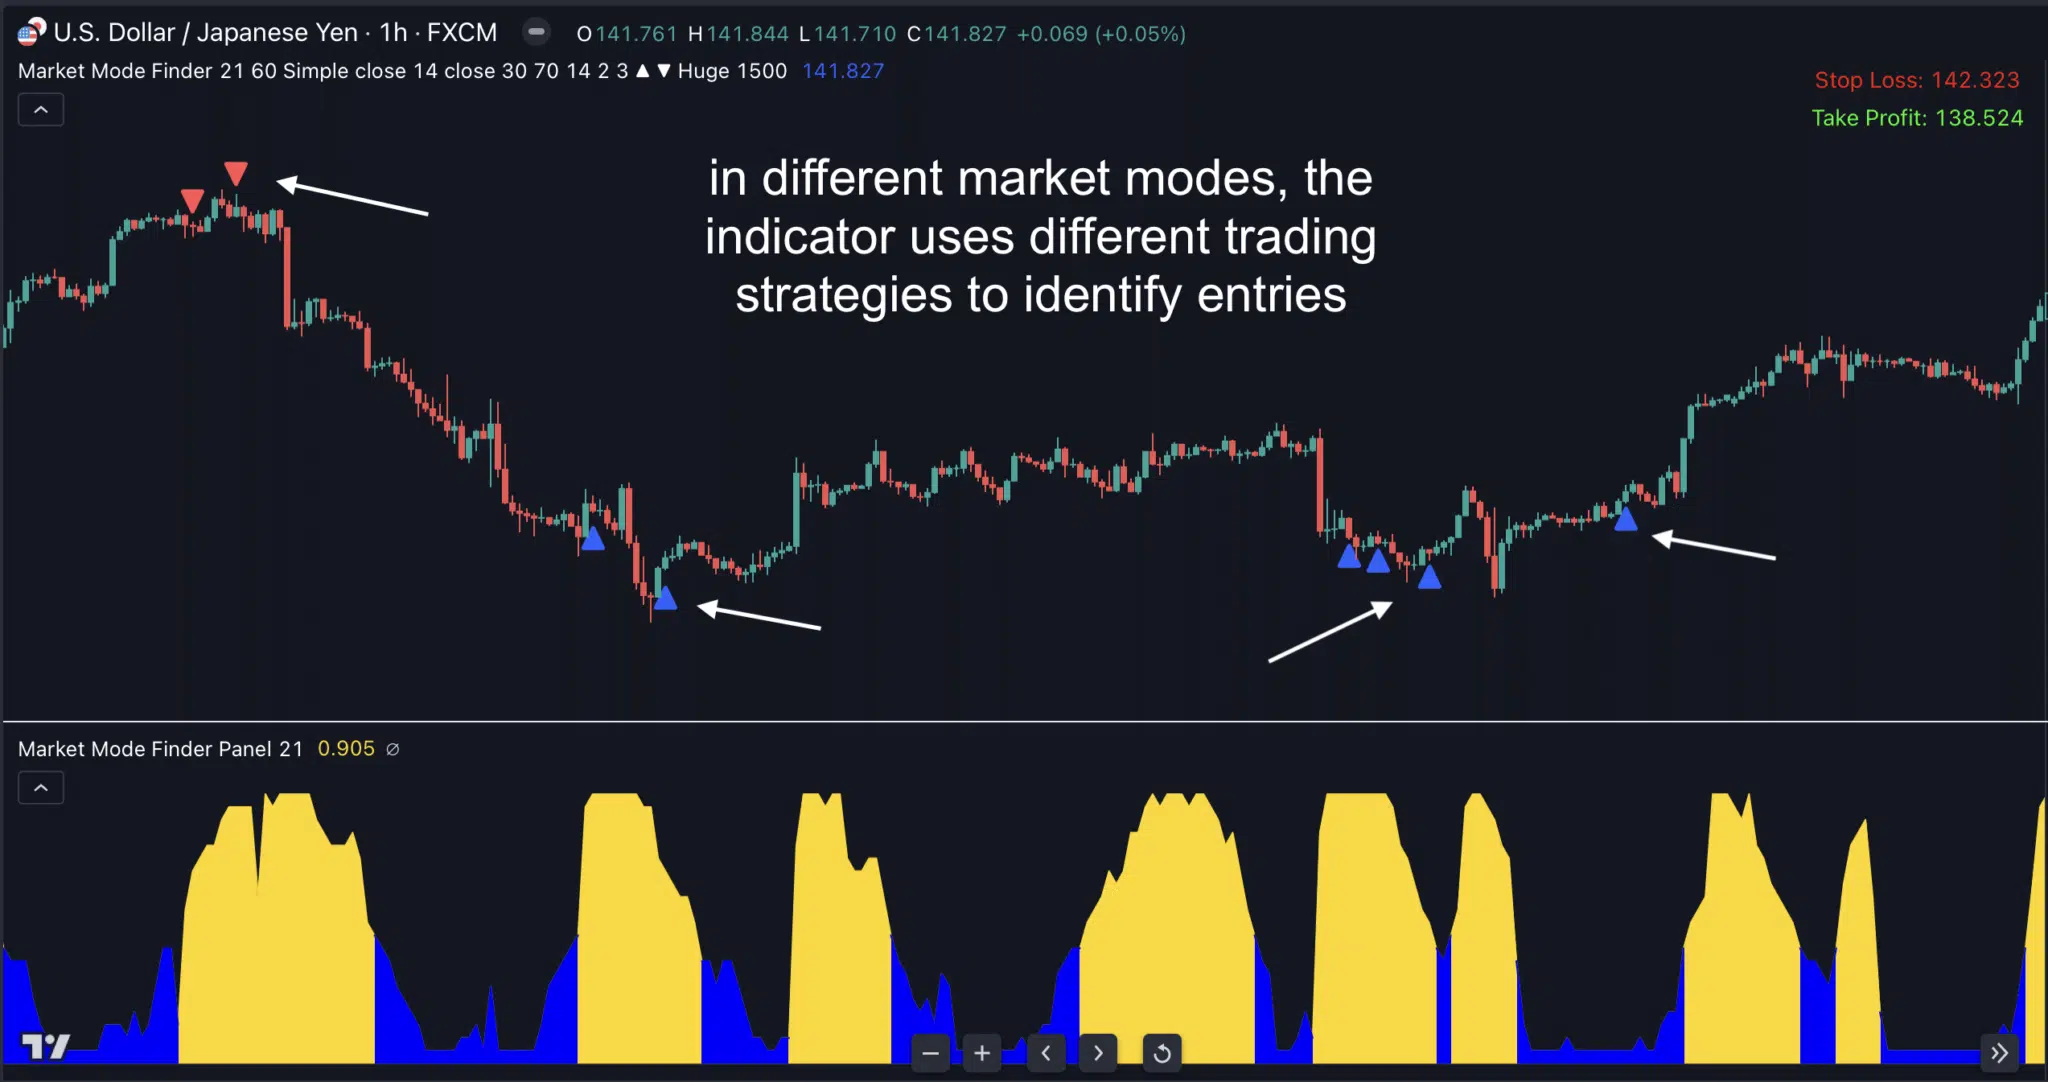
📌 Tailor your strategy to the mode — when it’s range-bound you switch to mean-reversion, when it’s trending you switch to trend-following.
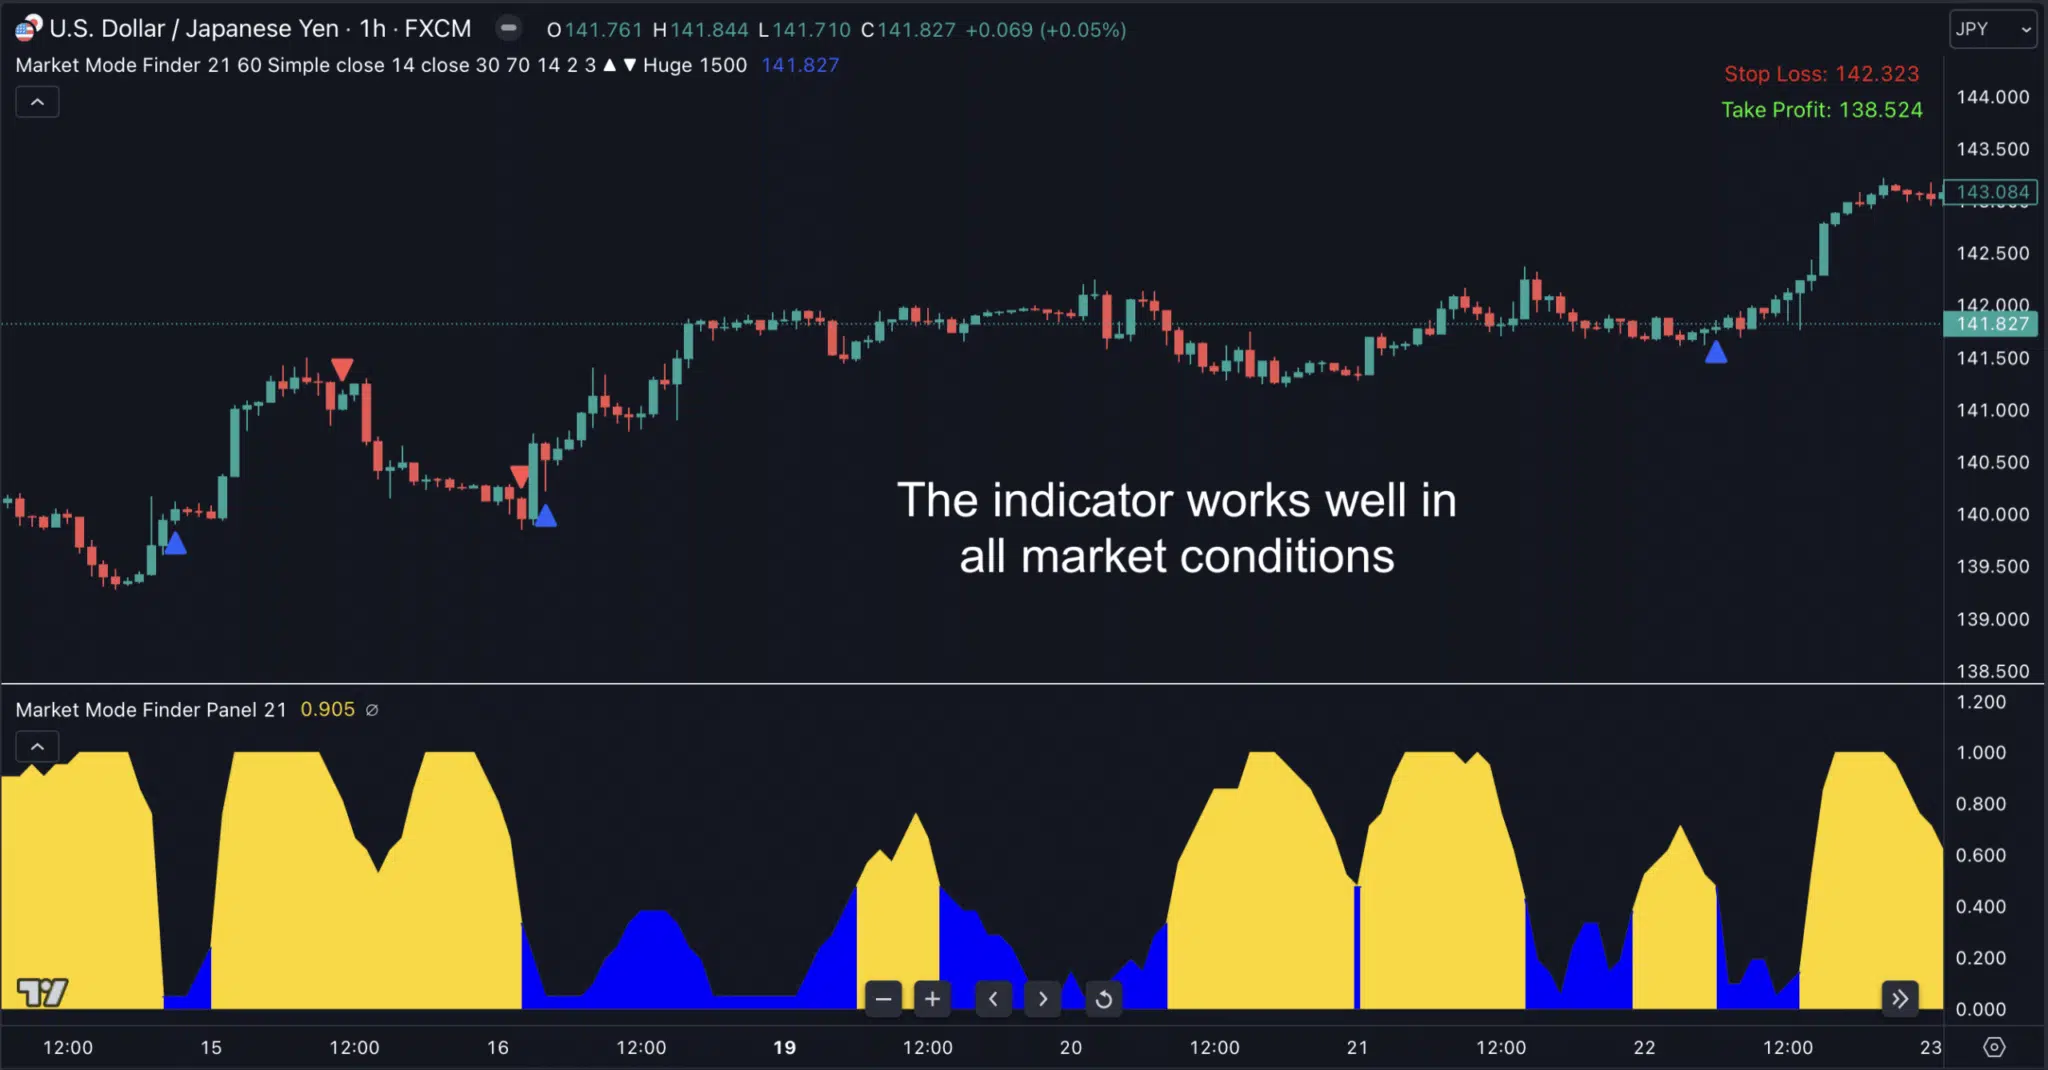
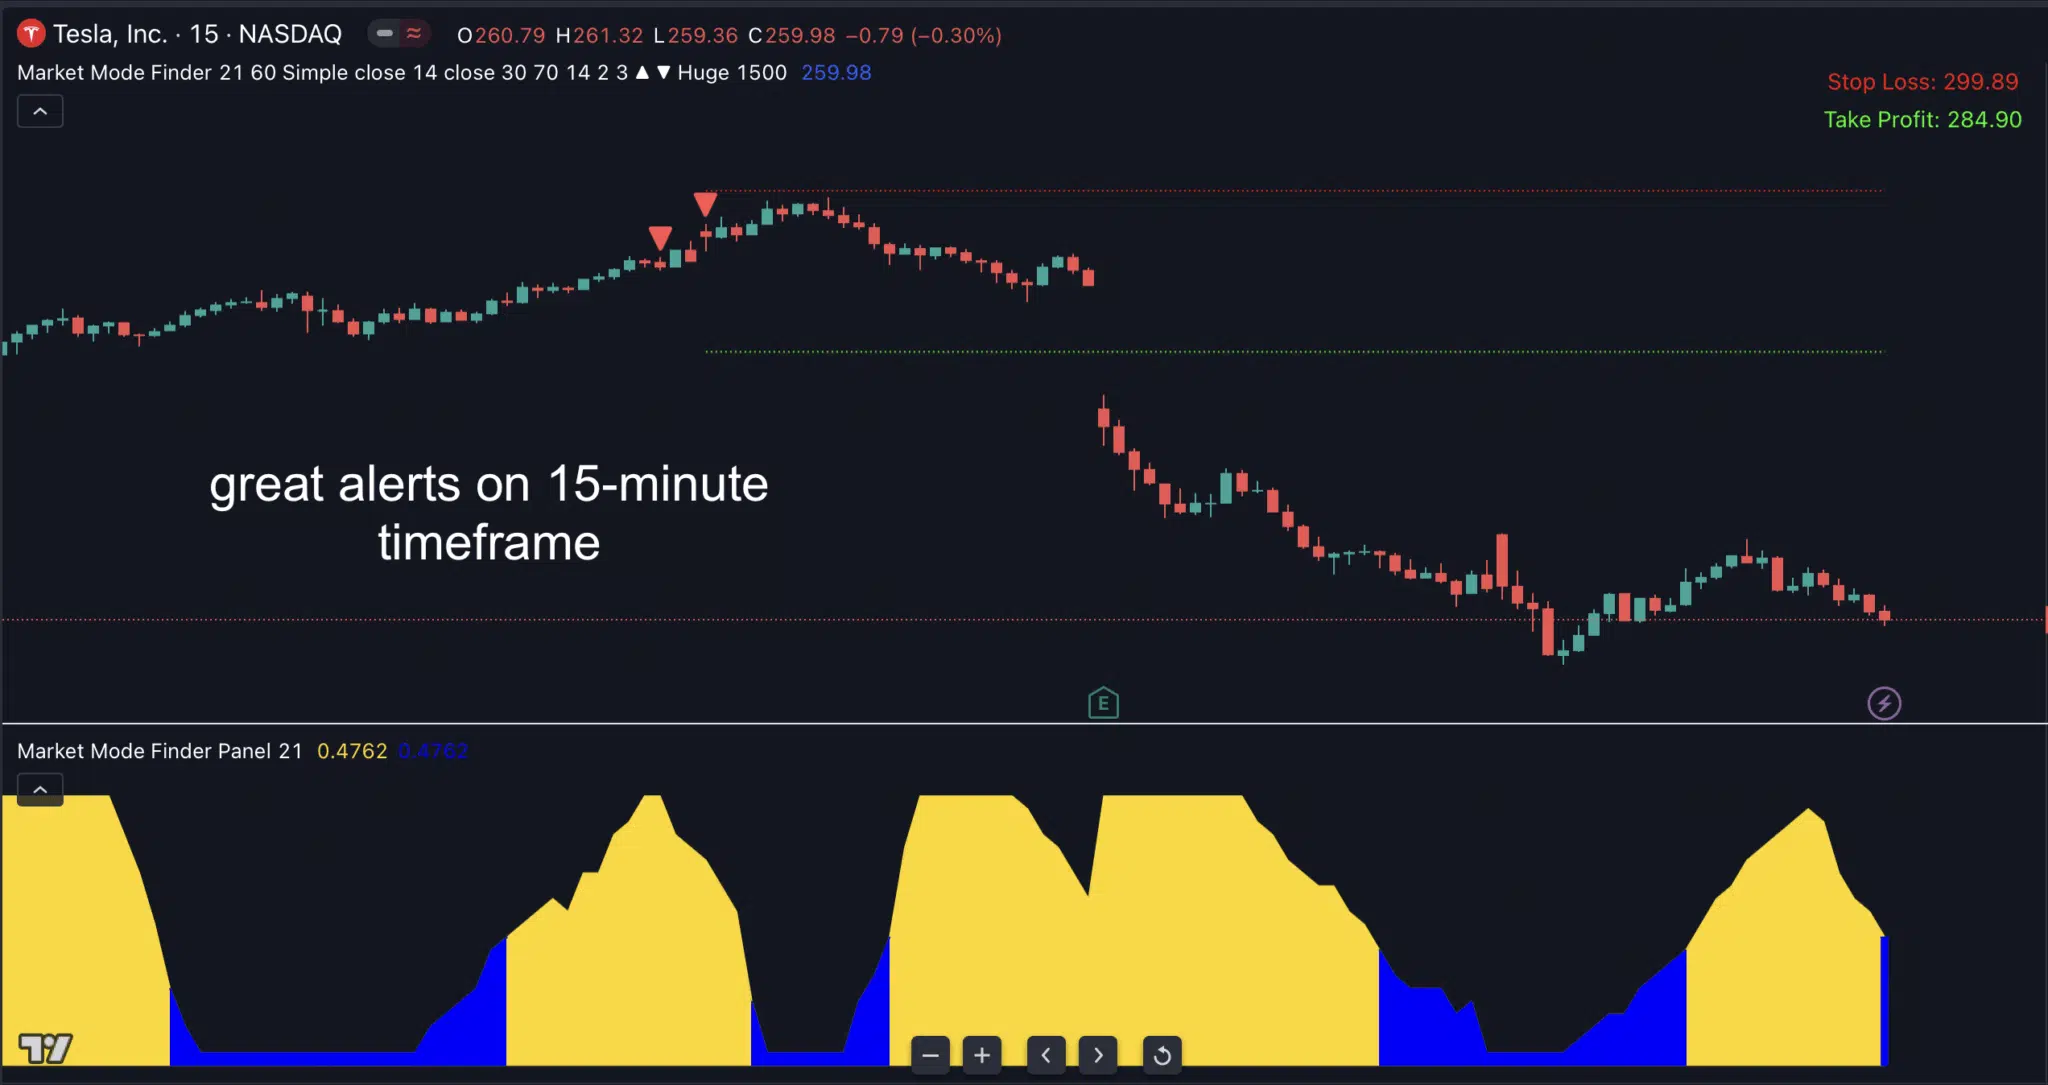
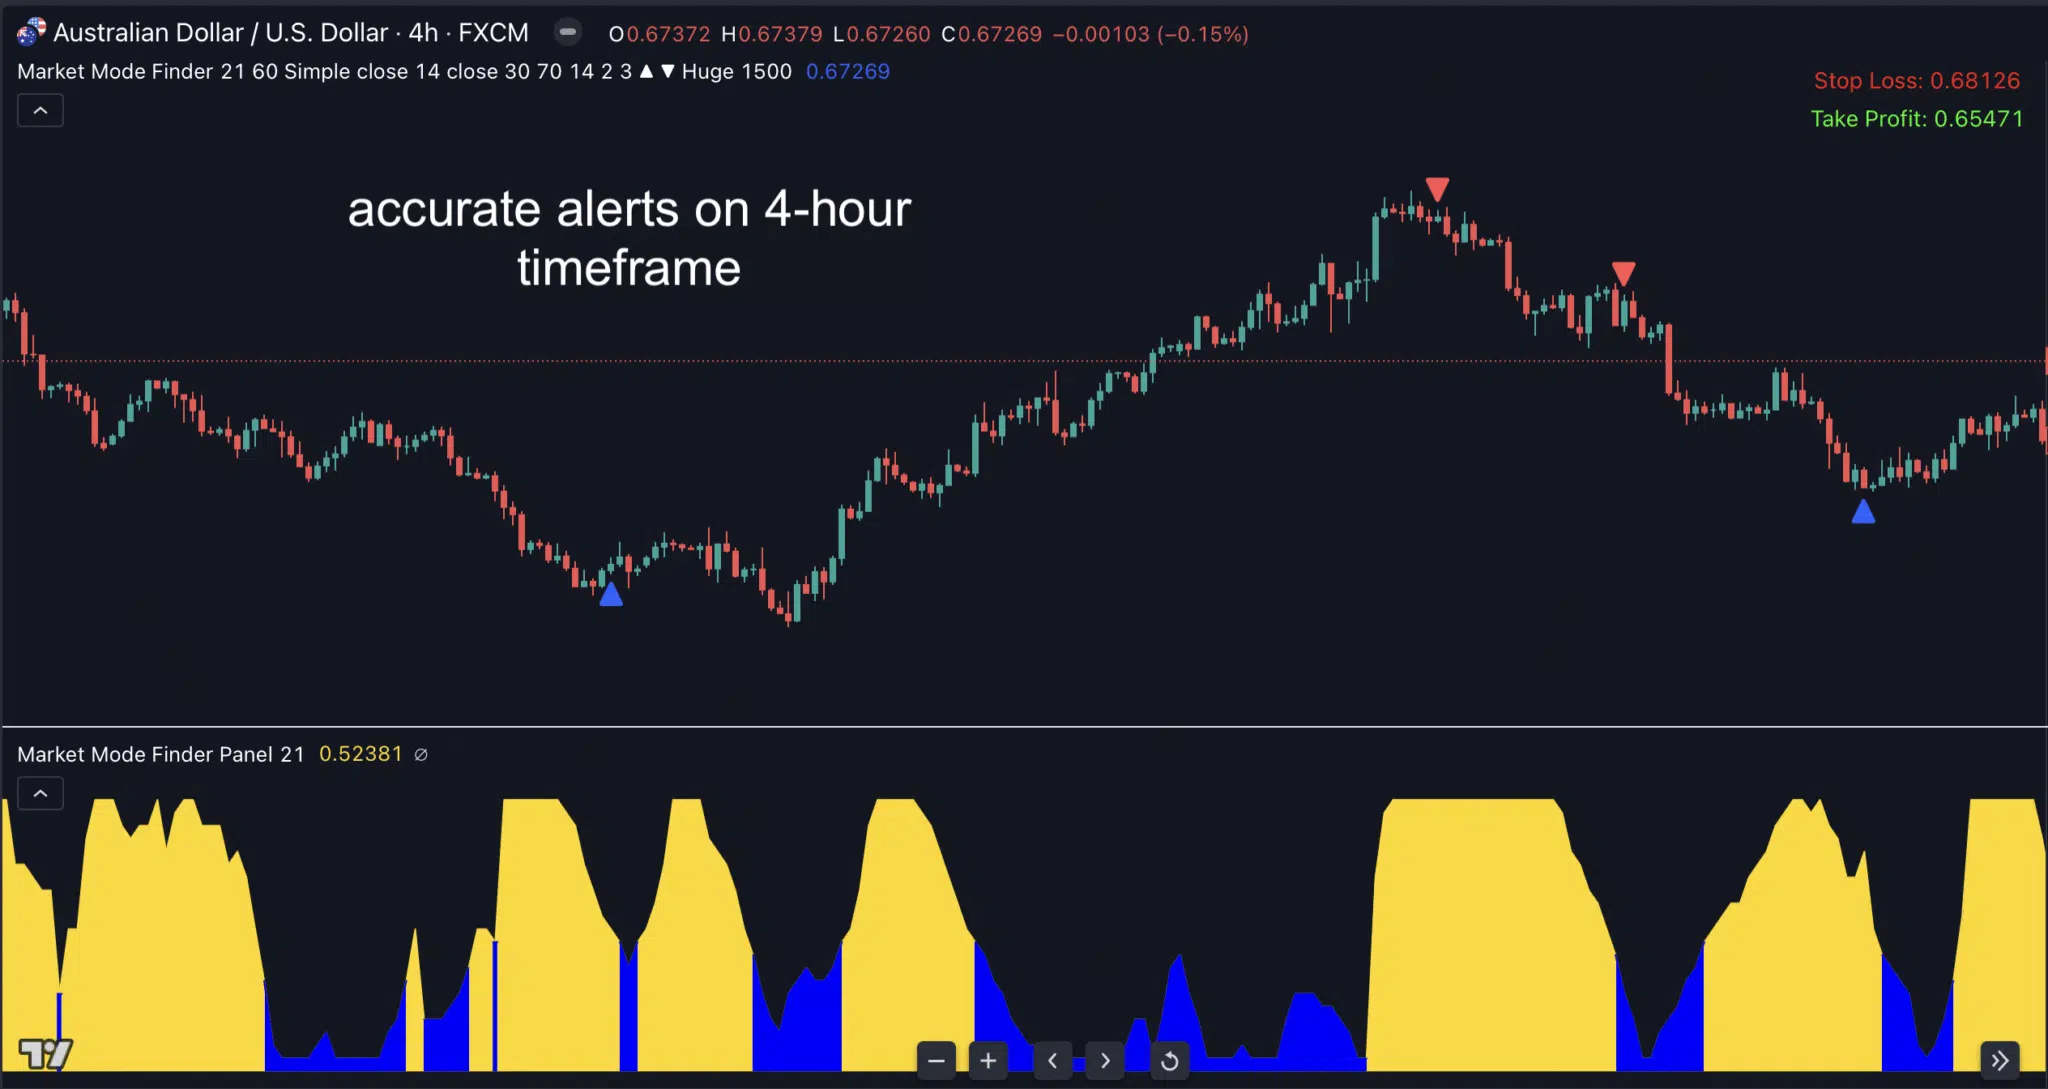
📌 Works on ALL pairs & ALL timeframes — get more consistent setups by playing only when the environment is right.
$299.00
Market Mode Finder for TradingView
One-time payment. Lifetime access.