Supply Demand Dashboard for Tradingview

$200.00 / month

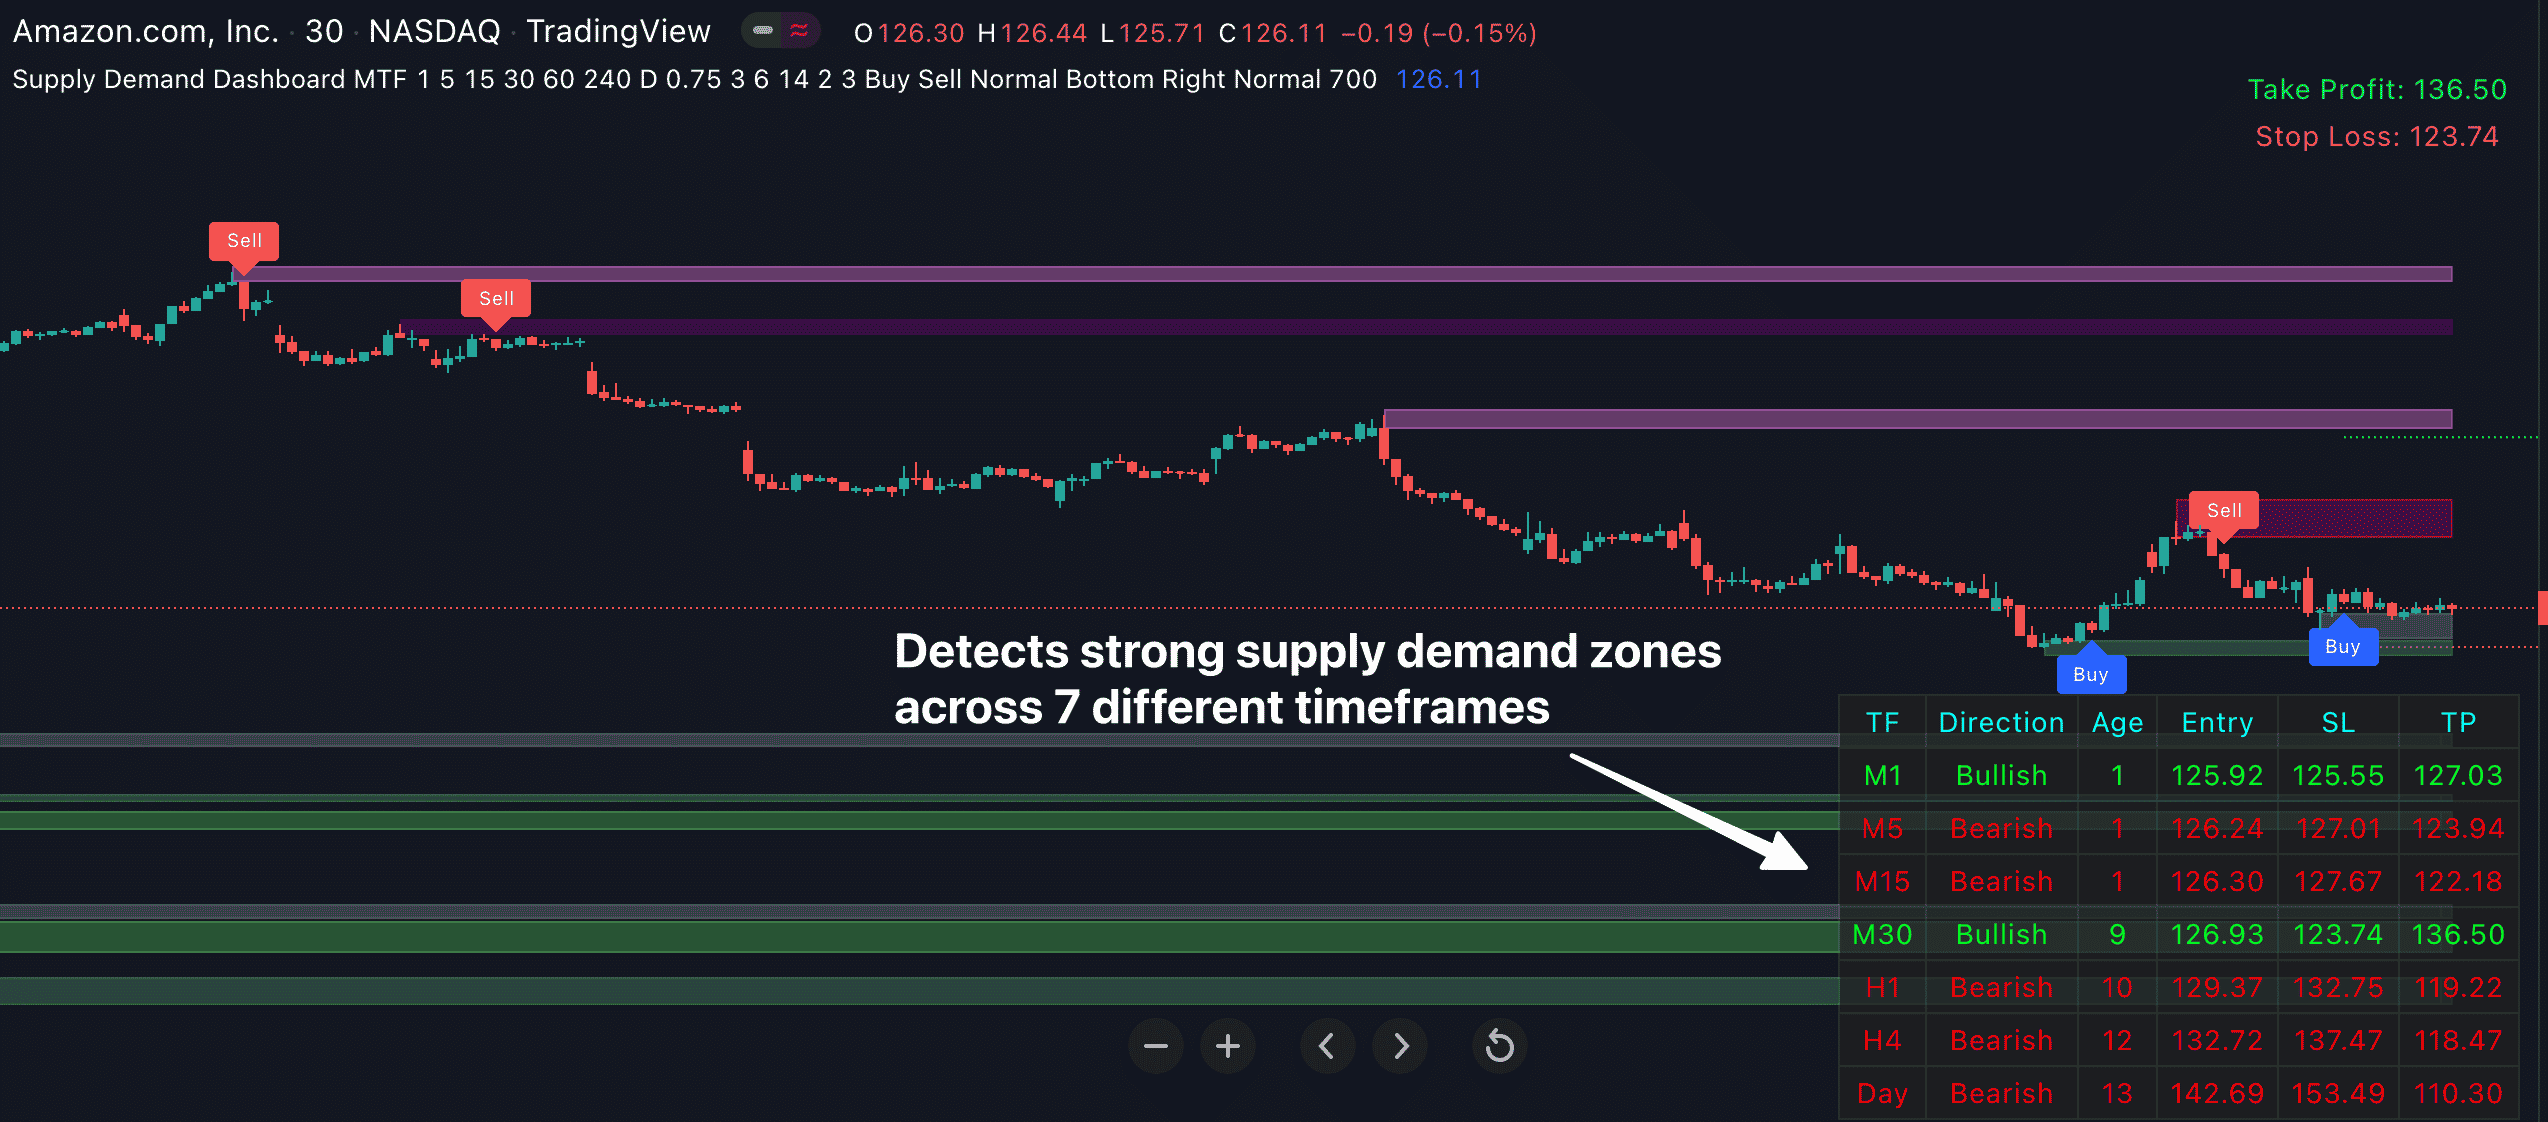
📌 This Supply Demand Dashboard for Tradingview shows you all strong supply demand zones in ONE convenient dashboard.
📌 You no longer need to manually scan every symbol and time-frame. The dashboard does the heavy lifting for you.
📌 With just one look at the dashboard, you’ll instantly know which supply demand zone has just formed on up to 10 symbols & 7 time-frame

What exactly is this indicator?

Supply Demand Dashboard for Tradingview identifies all strong supply demand zones on 10 different symbols (FX, stocks, indices, futures, commodities, etc…) and 7 different timeframes.

And it displays all these zones in ONE beautiful, convenient dashboard.

So you can see all the newly formed trade setups (based on these supply demand zones) with just one glance at the dashboard.

It’s actually a suite of 2 amazing scanners:

  • Supply Demand Dashboard MTS (MTS stands for Muti-Symbol) that scans up to 10 different symbols for strong supply demand zones.
  • Supply Demand Dashboard MTF (MTF stands for Multi-Timeframe) that scans up to 7 different time-frames for strong supply demand zones.

Let’s take a look at each of these scanners in action:

Supply Demand Dashboard MTS in action:

With Supply Demand Dashboard MTS in your toolkit, you’ll be able to see which supply demand zone has just formed on each of these symbols… simply by glancing at the dashboard.

And it works in ALL markets, whether it’s FX, stocks, indices, commodities, futures, etc…

Plus… you’ll also receive an INSTANT alert as soon as a supply demand zone appears on each of these symbols.

Once a supply demand zone is found, Supply Demand Dashboard MTS will also show you a suggestion on where to place your stop loss and take profit.

You may use these SL/TP as a starting point to build your own strategy.

Now, let’s take a look at the…

Supply Demand Dashboard MTF in action:

Supply Demand Dashboard MTF is hands-down my favorite tool for identifying supply demand zones across MULTIPLE timeframes.

If you do any form of multi-timeframe analysis, I’m confident you’ll love it.

Just one glance at Supply Demand Dashboard MTF, and you’ll instantly see which supply demand zone has just formed on SEVEN different timeframes.

On top of that, you’ll receive all kind of alerts (sound, visual, pop-up, email) as soon as a new zone has formed on each of the 7 timeframes.

Once a zone us found, Supply Demand Dashboard MTF will also show you a suggestion on where to place your stop loss and take profit.

In other words, it gives you all the crucial information you need: High-probability trade entry, stop loss, take profit…

Supply Demand Dashboard MTS and MTF are my favorite tools for trading reversals with supply demand zones, hands-down.

Let me walk you through these amazing features of the Supply Demand Dashboard for Tradingview:

First, it detects strong supply demand zones on 10 symbols and 7 timeframes.

These supply demand zones are particularly useful because they often serve as market turning points.

And you can use them as entry and exit points. Especially great for reversal trading.

Let our Supply Demand Dashboard for Tradingview do the heavy lifting for you

First, it will scan 10 different symbols and 7 time-frames for high-probability supply demand zones. And all these calculations are done so fast, you won’t even notice the time.

Second, the indicator will display a beautiful dashboard on your chart where you can see exactly what supply demand zone has recently formed on MULTIPLE symbols or on MULTIPLE time-frames.

With just one look at the dashboard, you’ll instantly know all the information you need to make a good trading decision:

You’ll instantly know which supply demand zone appears on every time-frame (from 1-minute to monthly) and on every symbol.

Not only that, you’ll also know the exact direction of that zone – whether it’s bullish or bearish.

And you’ll know exactly how long ago that particular zone was formed.

And you’re in total control. You can specify which symbols and which time-frame you want the indicator to scan for these trend-following setups.

For Supply Demand Dashboard MTF, simply pick the timeframes you’d like the indicator to scan for supply demand zones:


sdash9

And for Supply Demand Dashboard MTS, simply enter the Symbol you’d like the indicator to scan for supply demand zones.

You may enter up to 10 different symbols. It works in ALL markets: FX, indices, stocks, commodities, futures, etc…

sdash8

Pretty cool, isn’t it?

By the way, it’s very very easy to trade with Supply Demand indicator because you’ll also get:

The indicator gives you all kinds of alerts: Pop-up, Sound, Email, and Push Notifications as soon as a setup appears…

sdash10

You’ll get all kinds of alerts: Pop-up, Sound, Email, and Push Notifications as soon as a new trade setup appears…

And you can customize these alerts in any way you want.

Watch this video guide to see how it works: