Candlestick Pattern Pro for TradingView
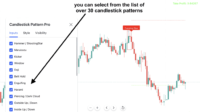
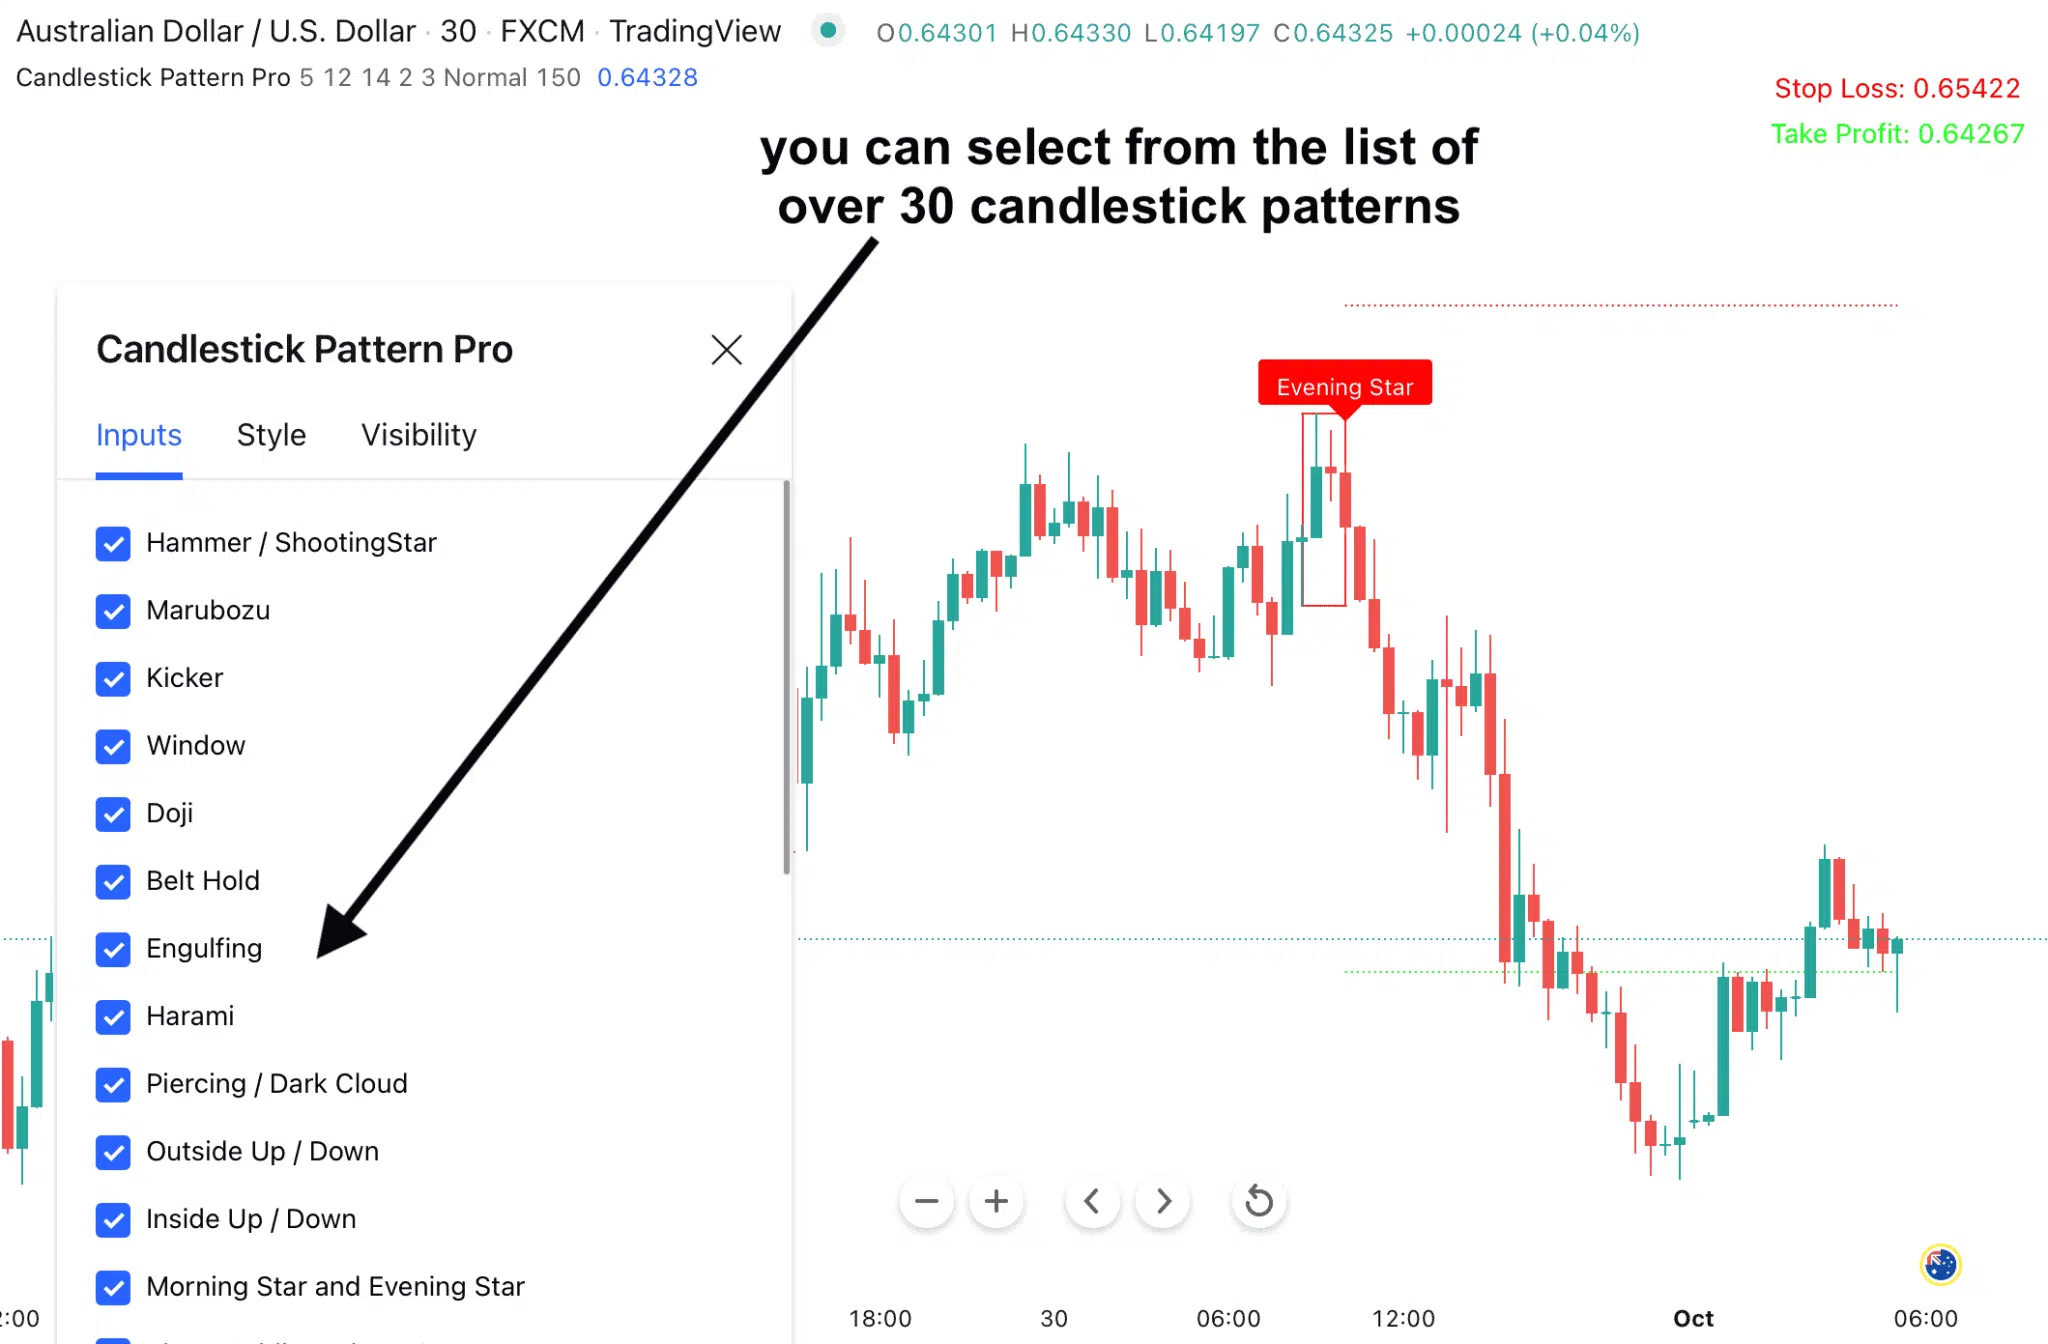
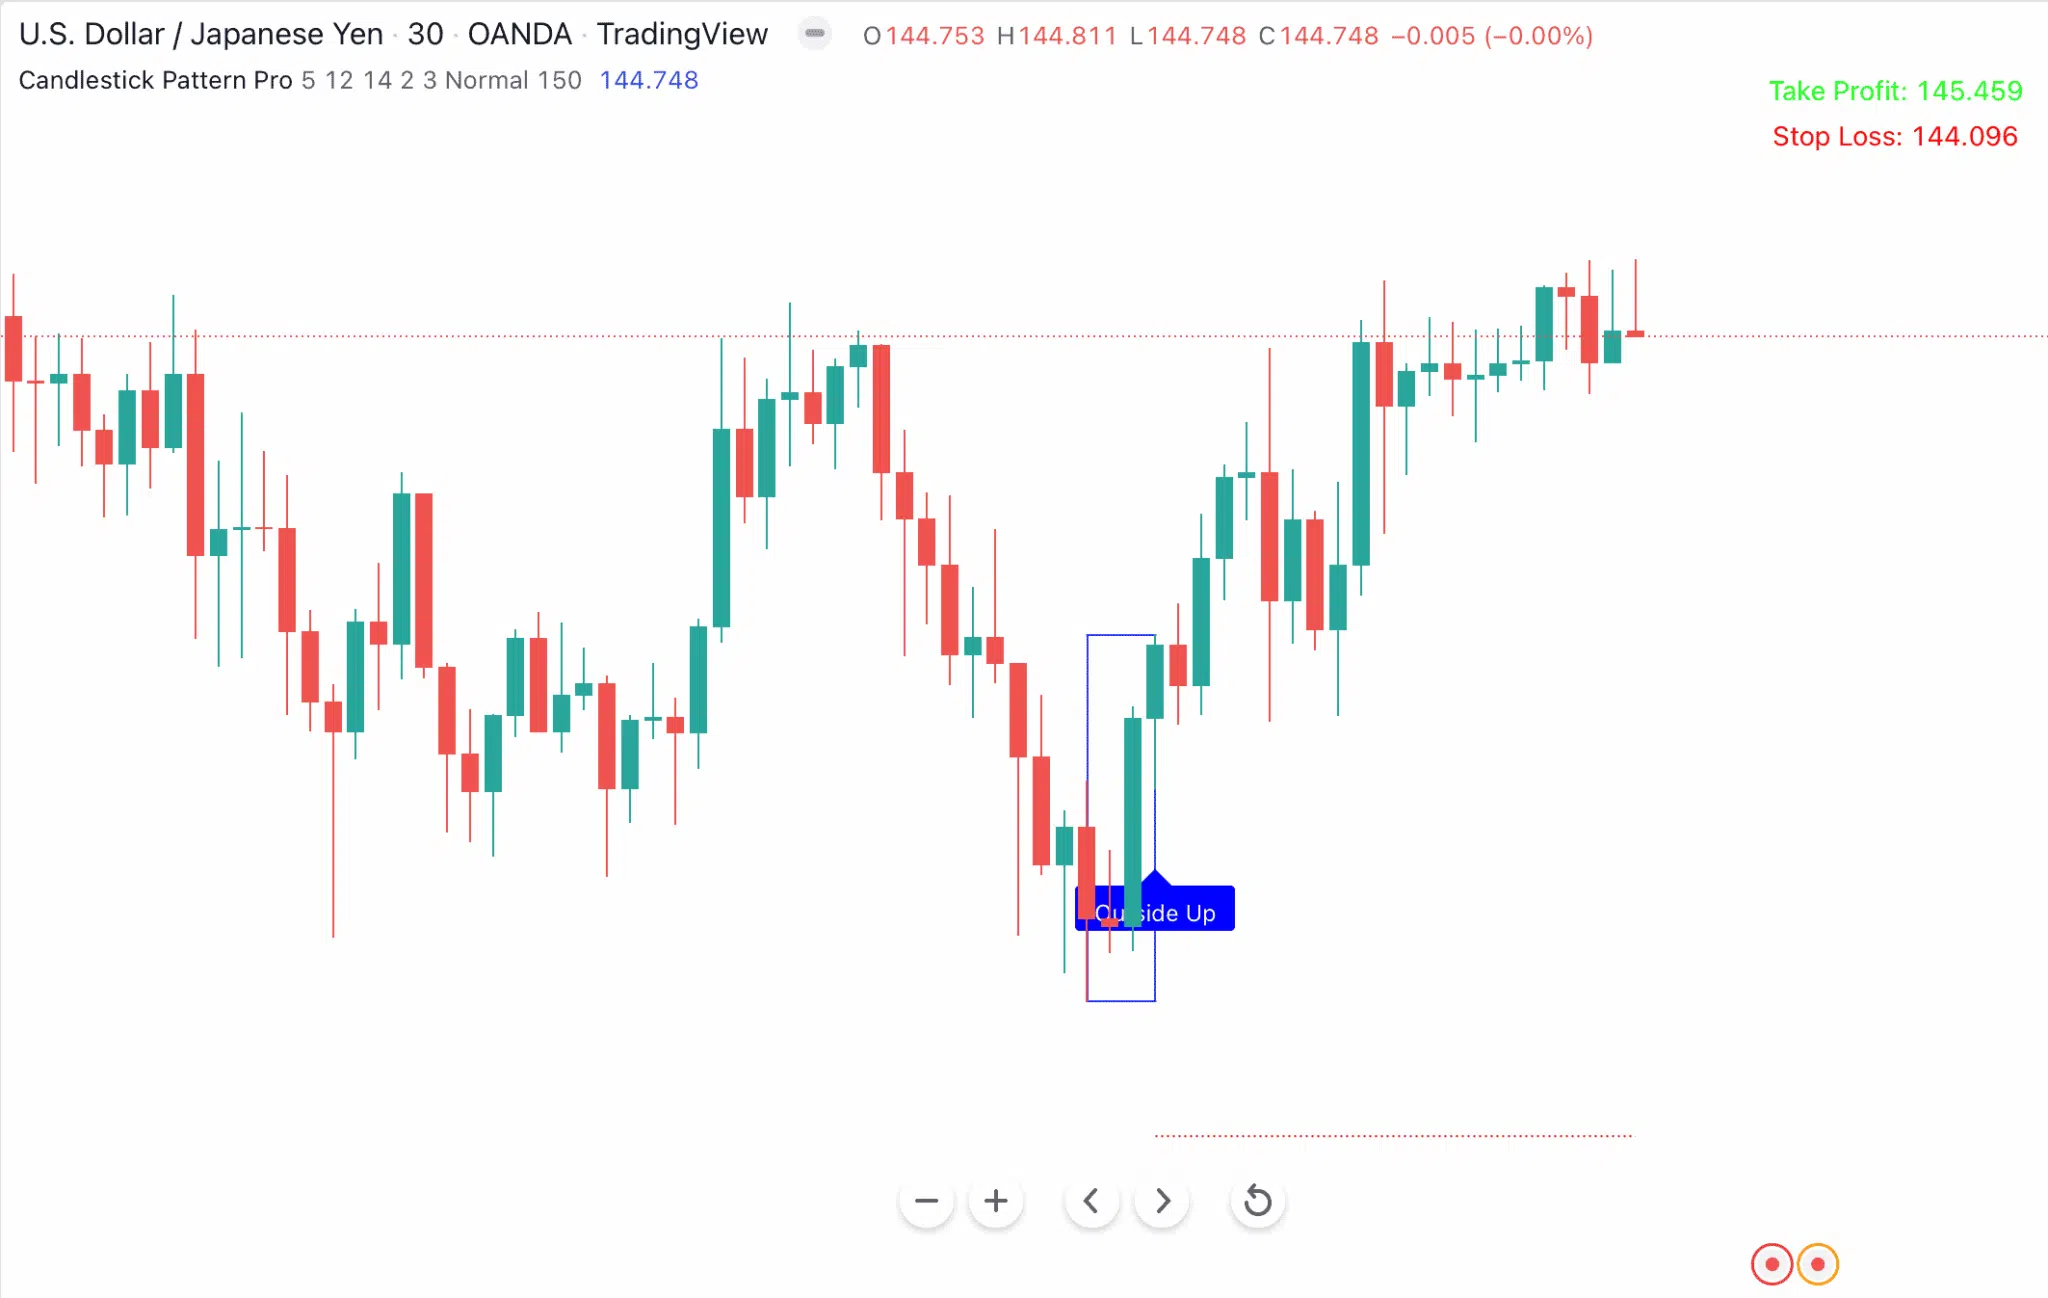
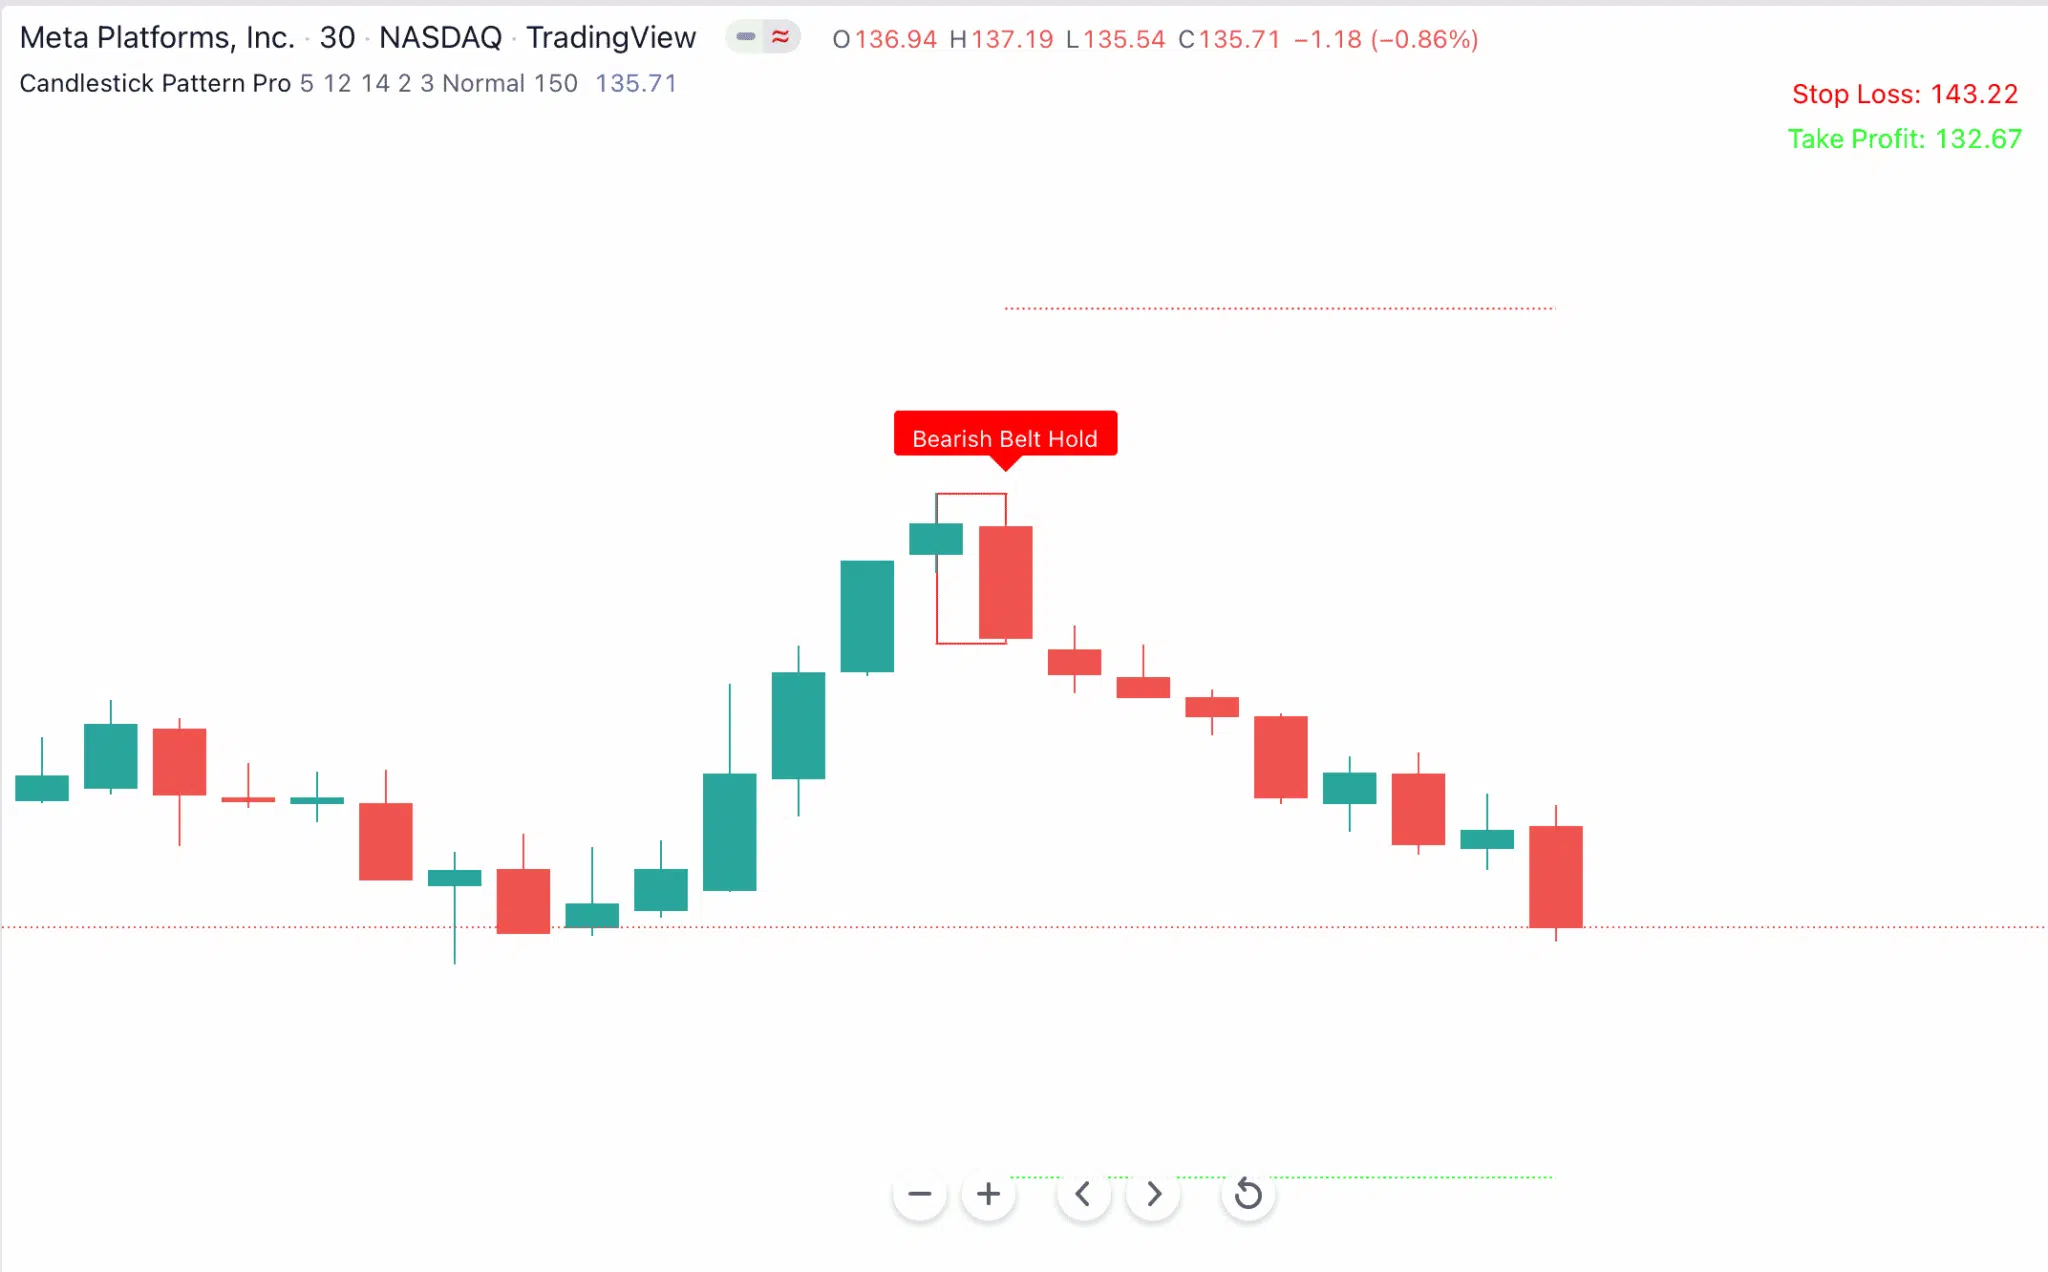
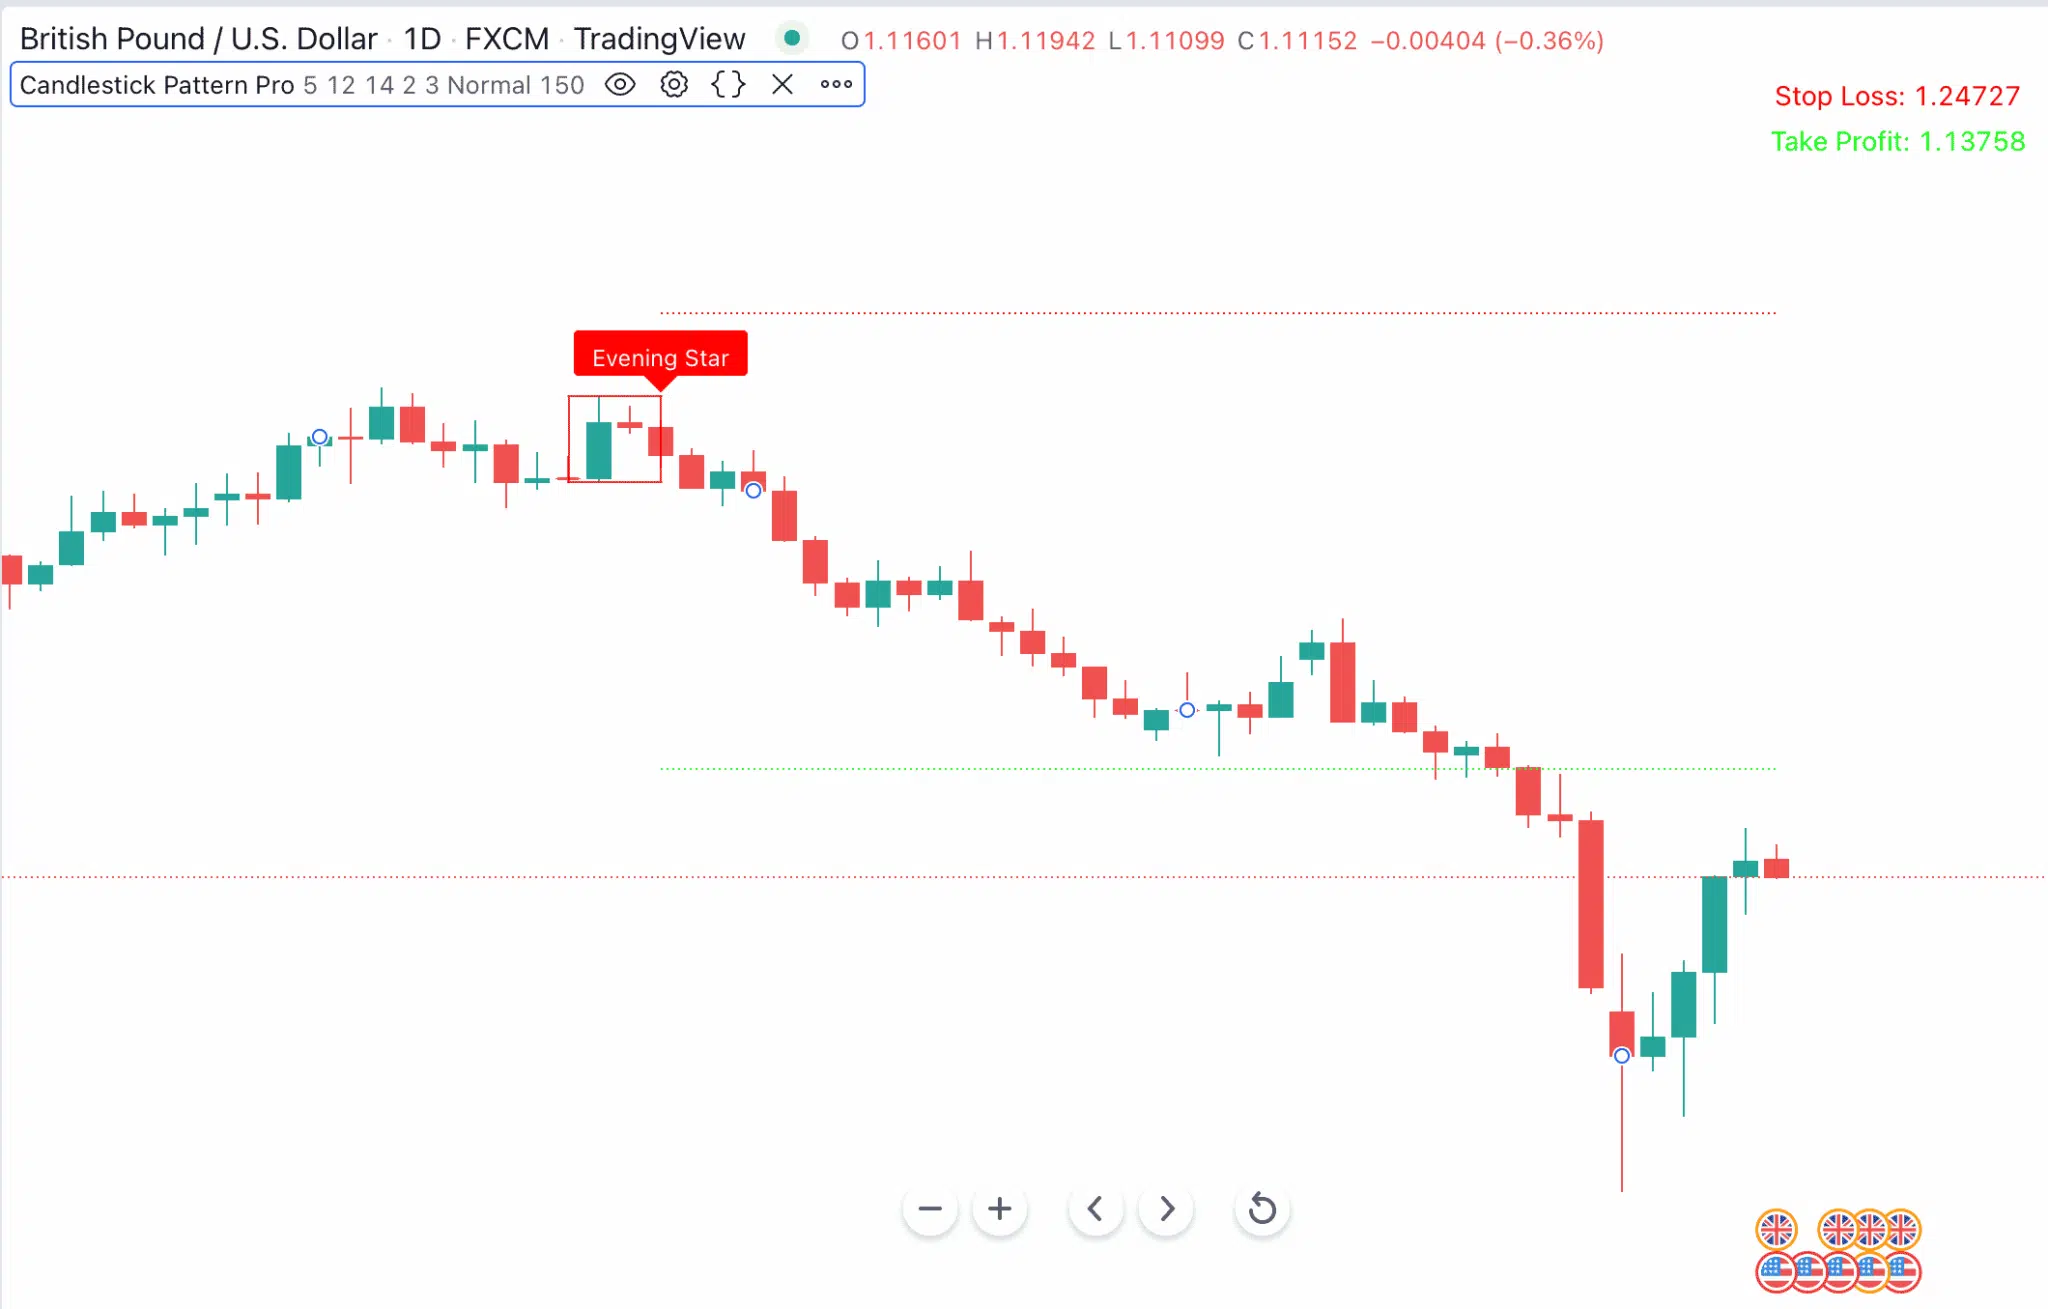
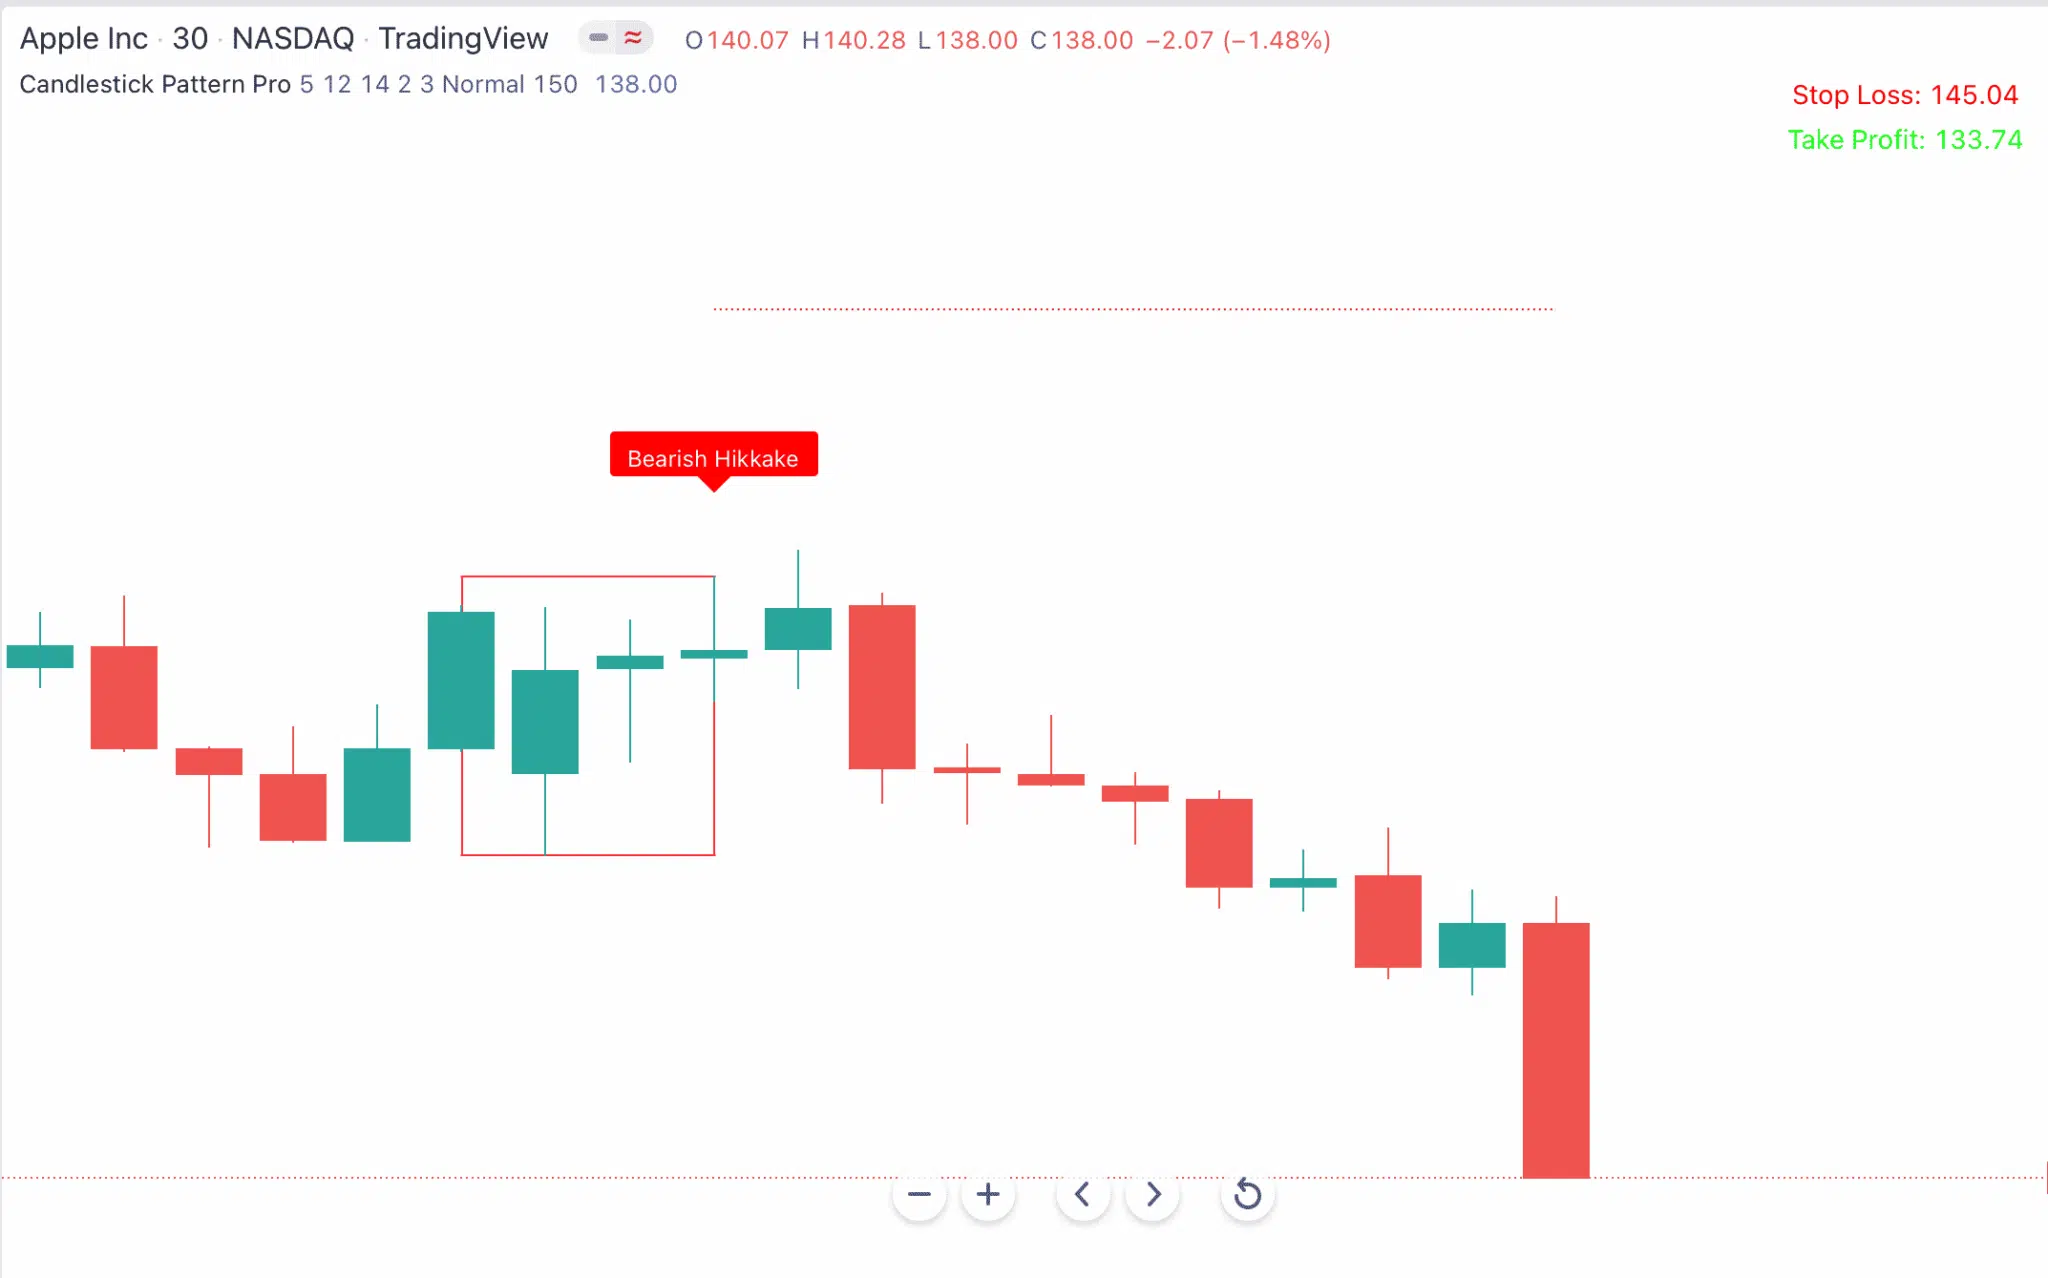
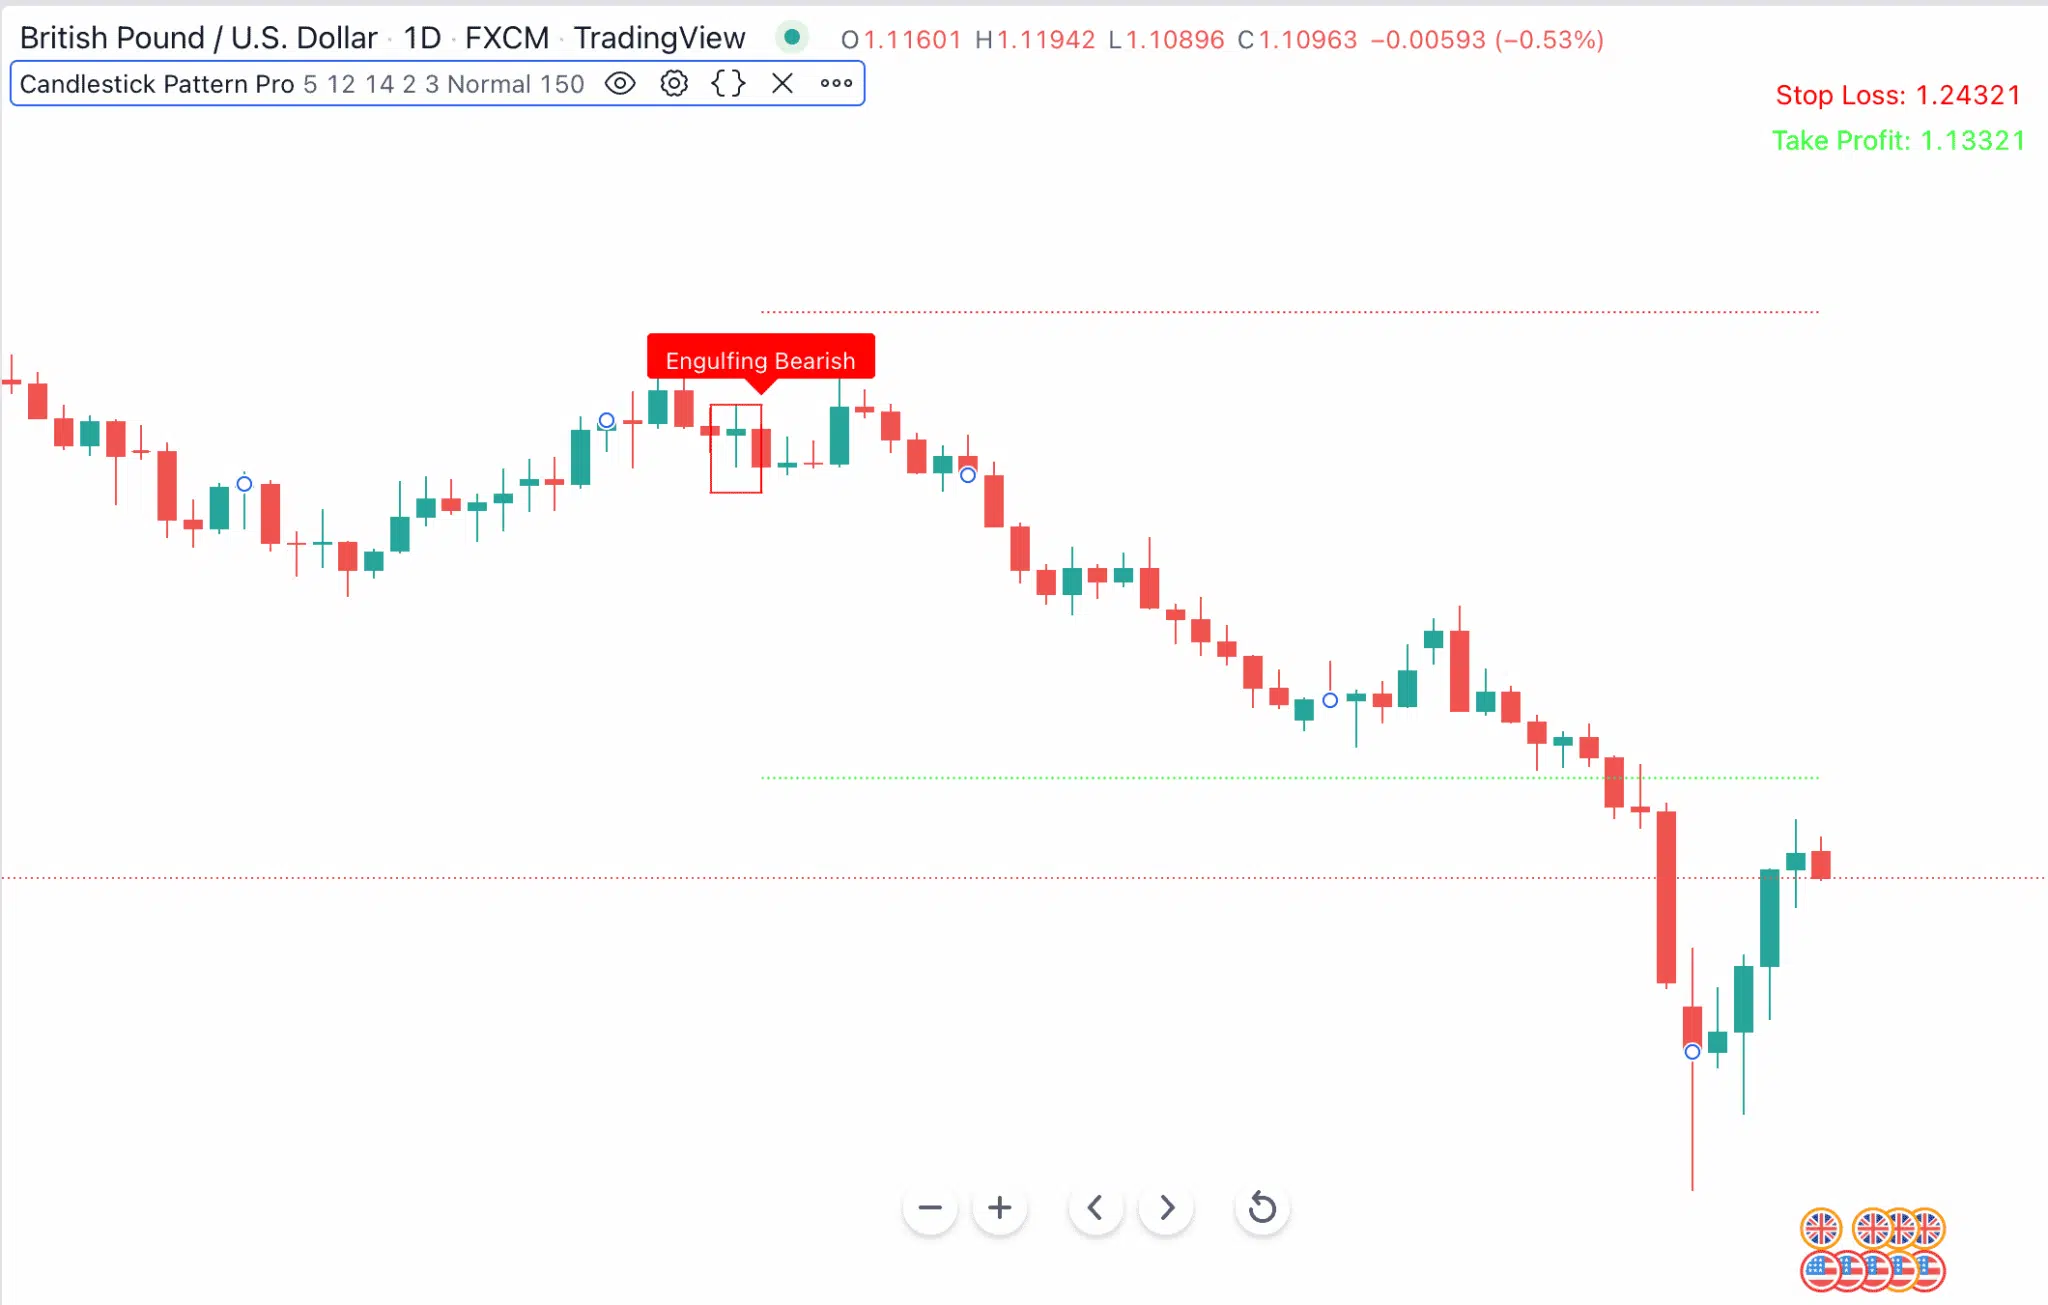
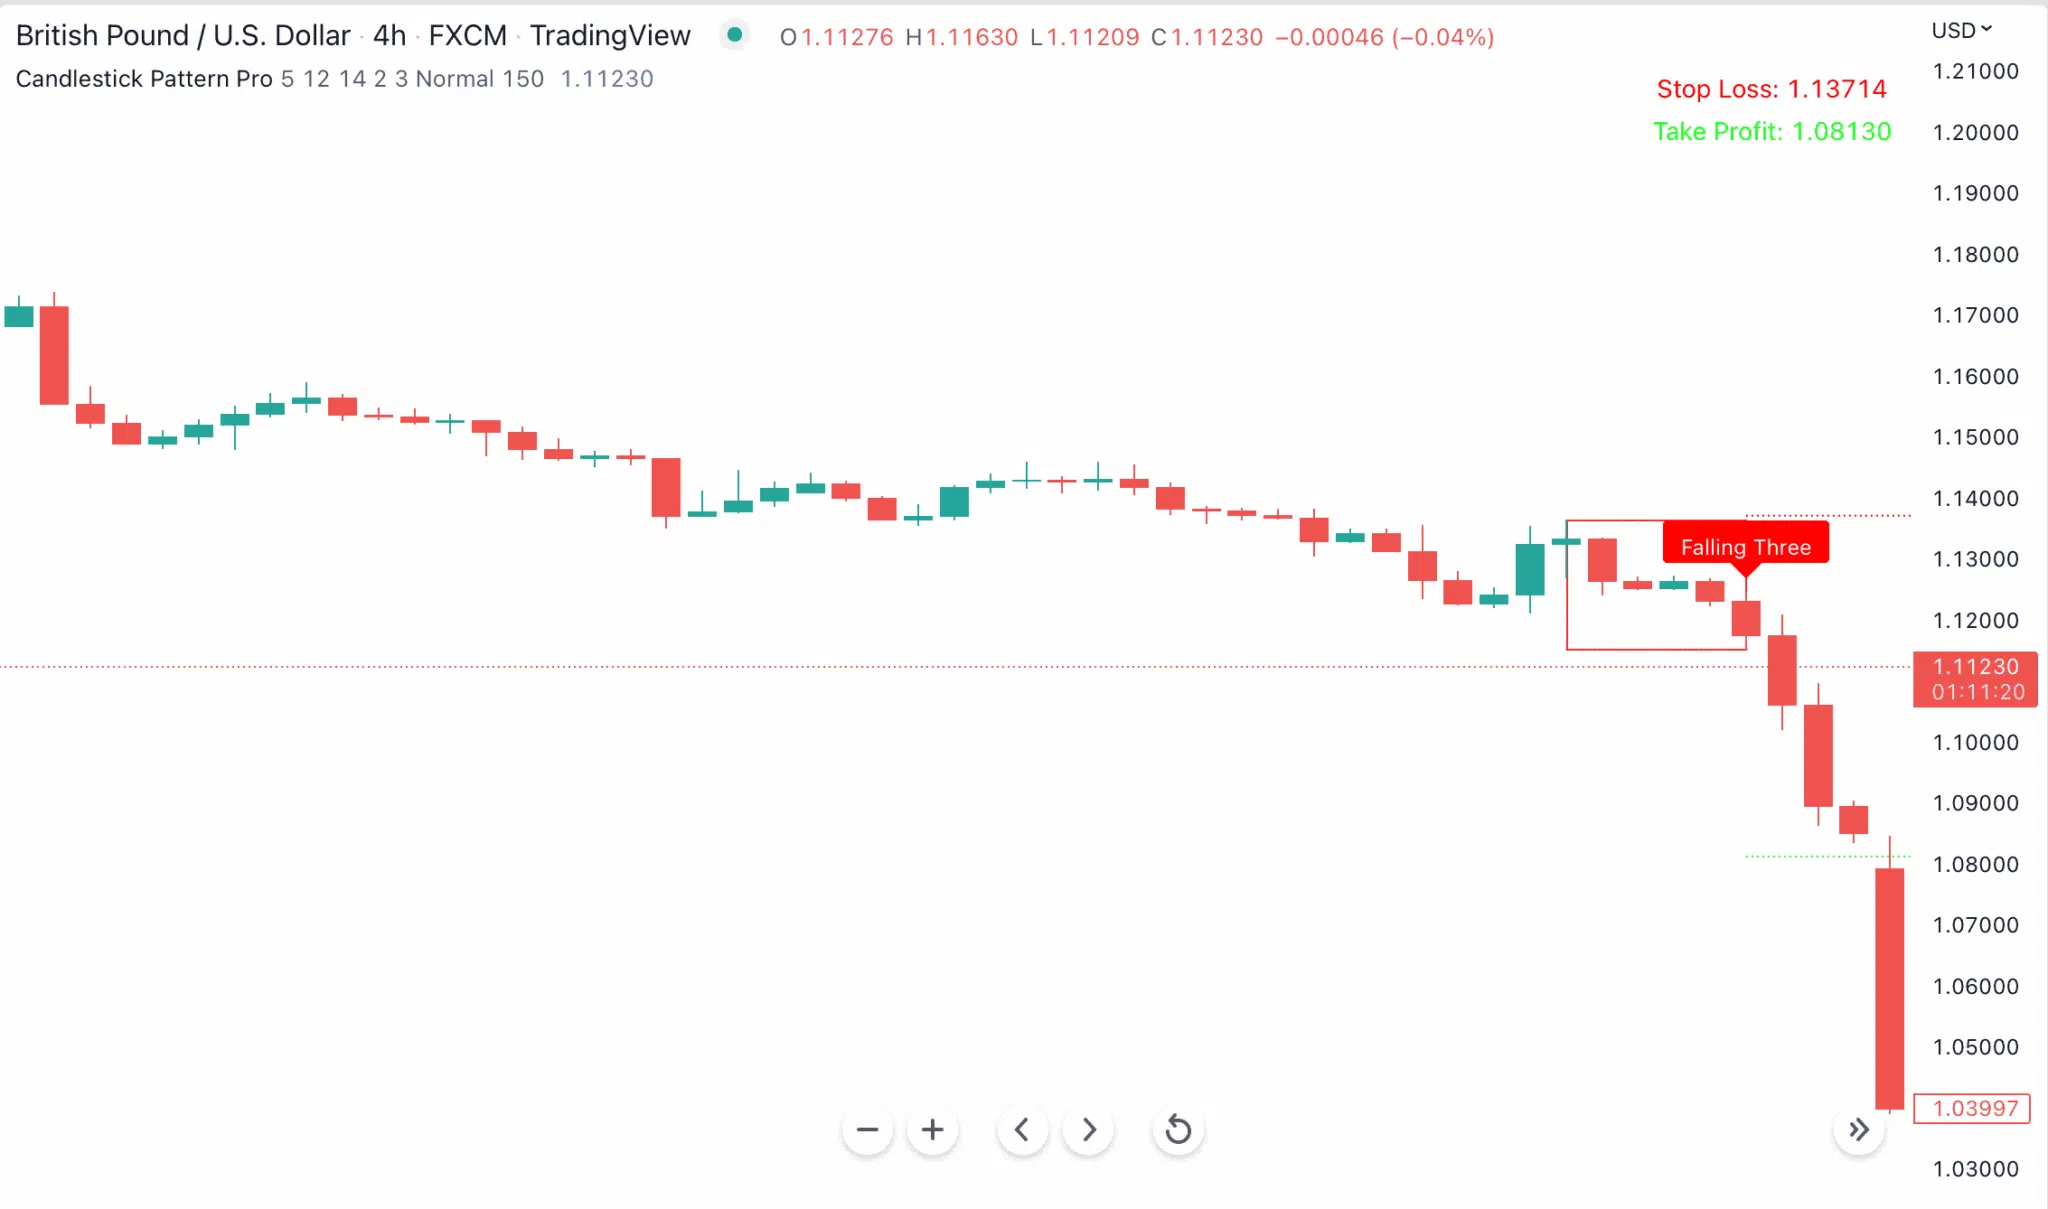
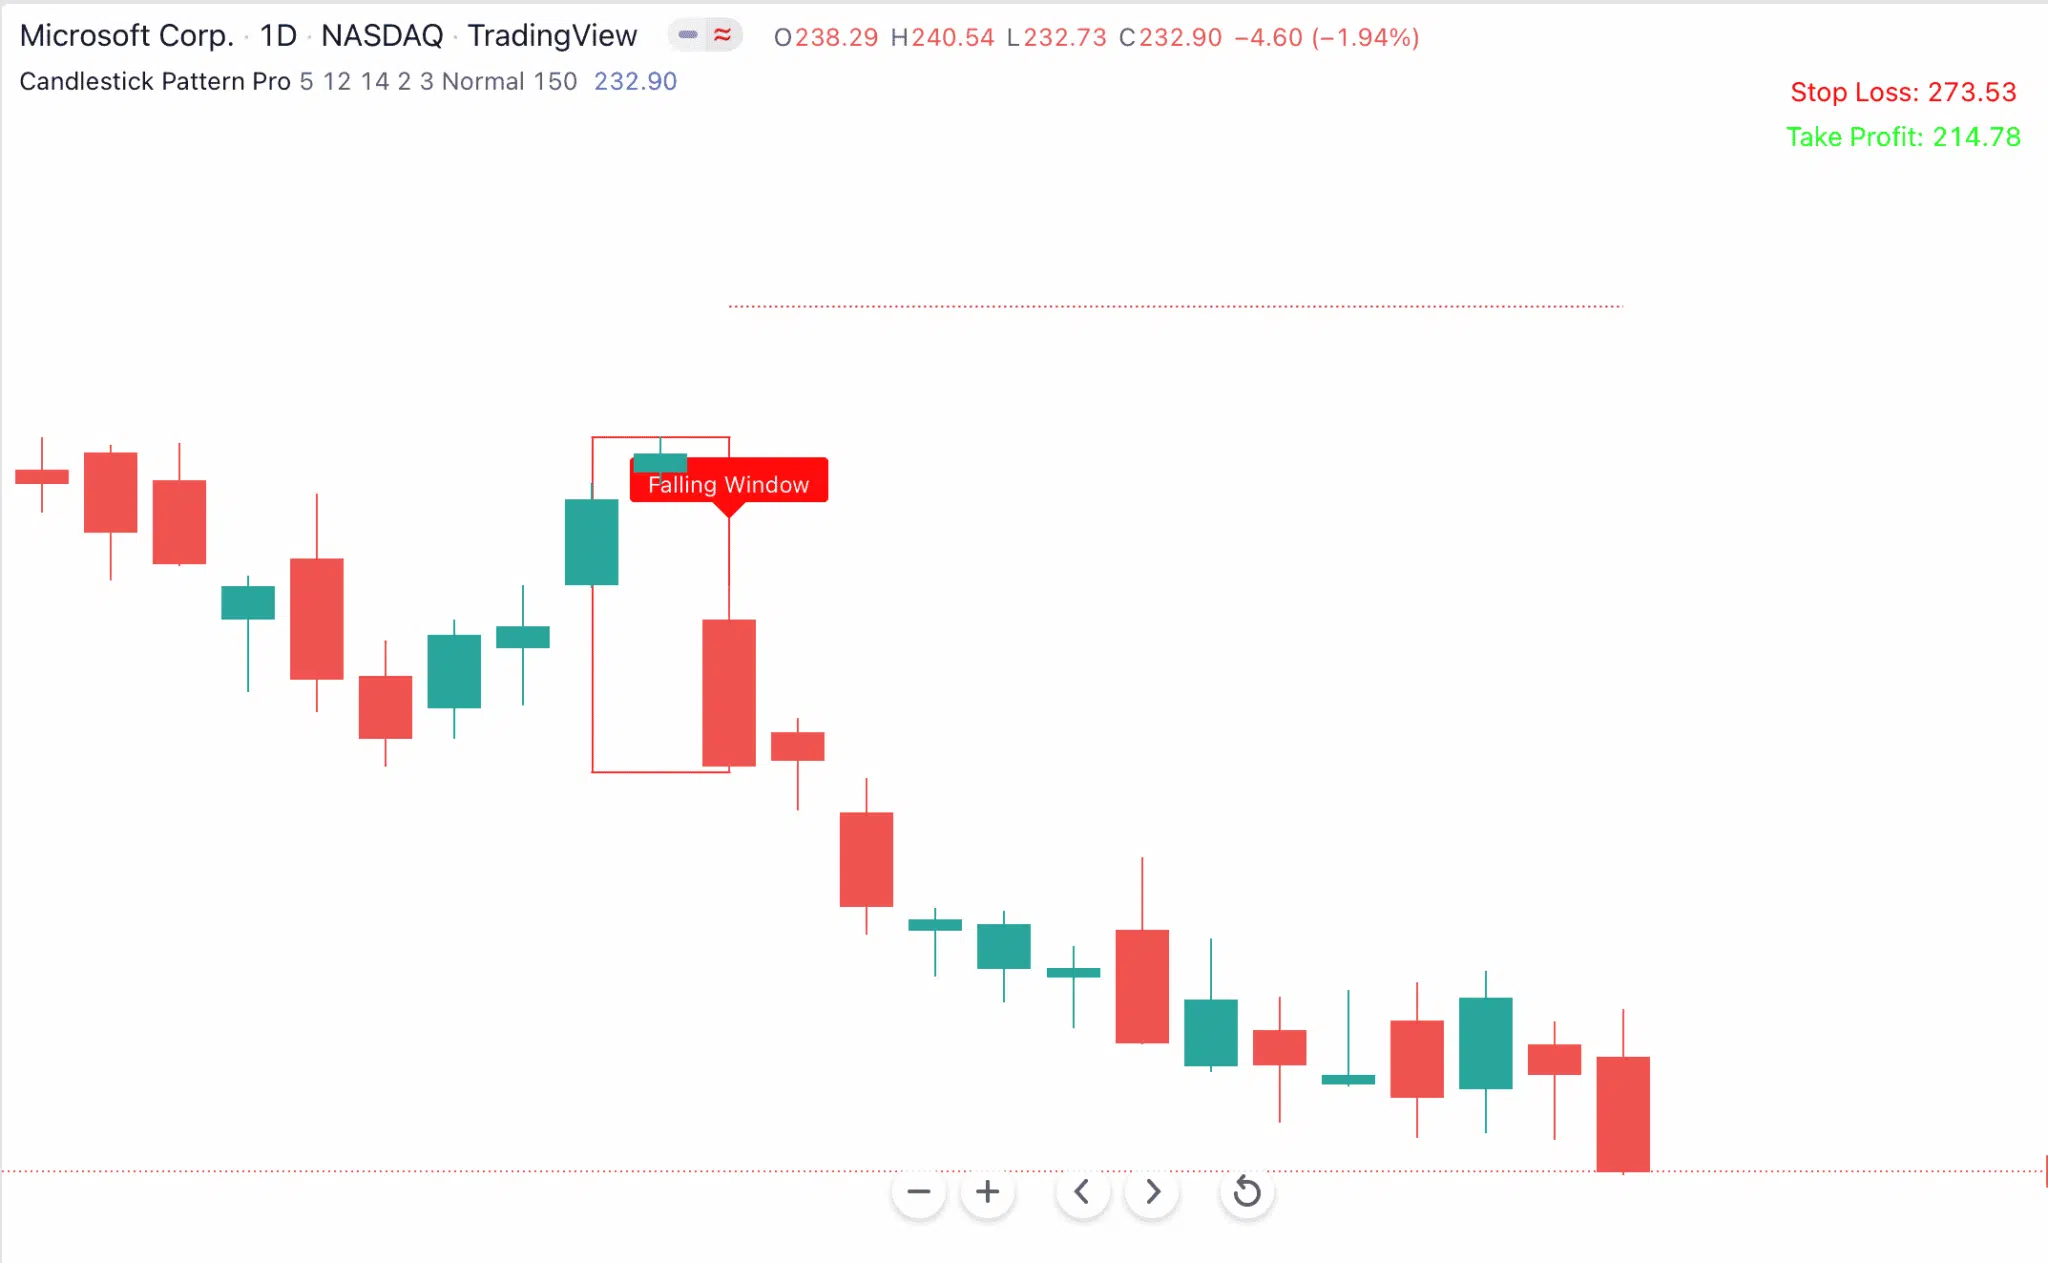
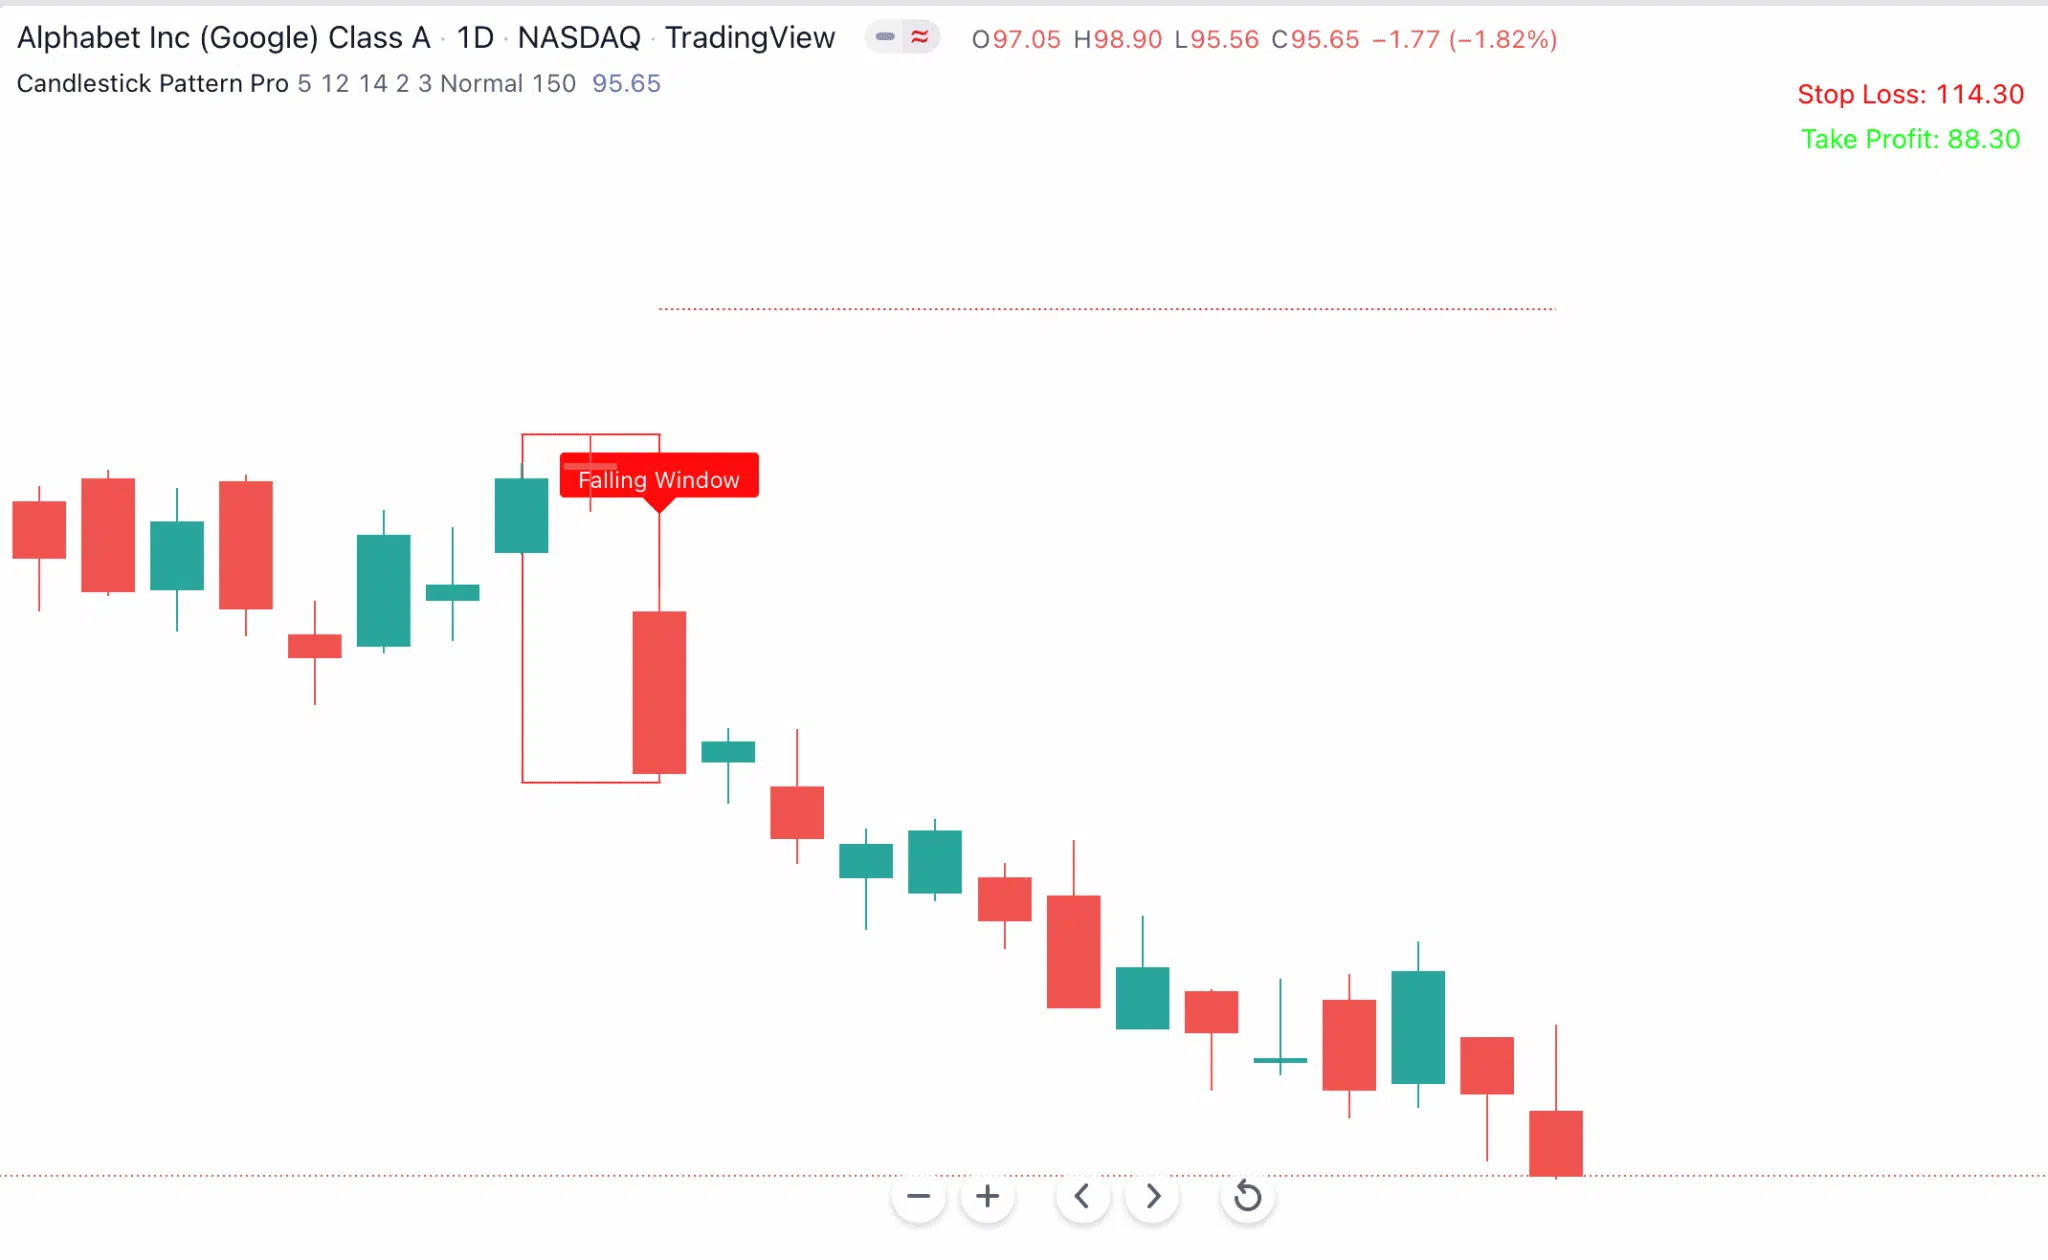
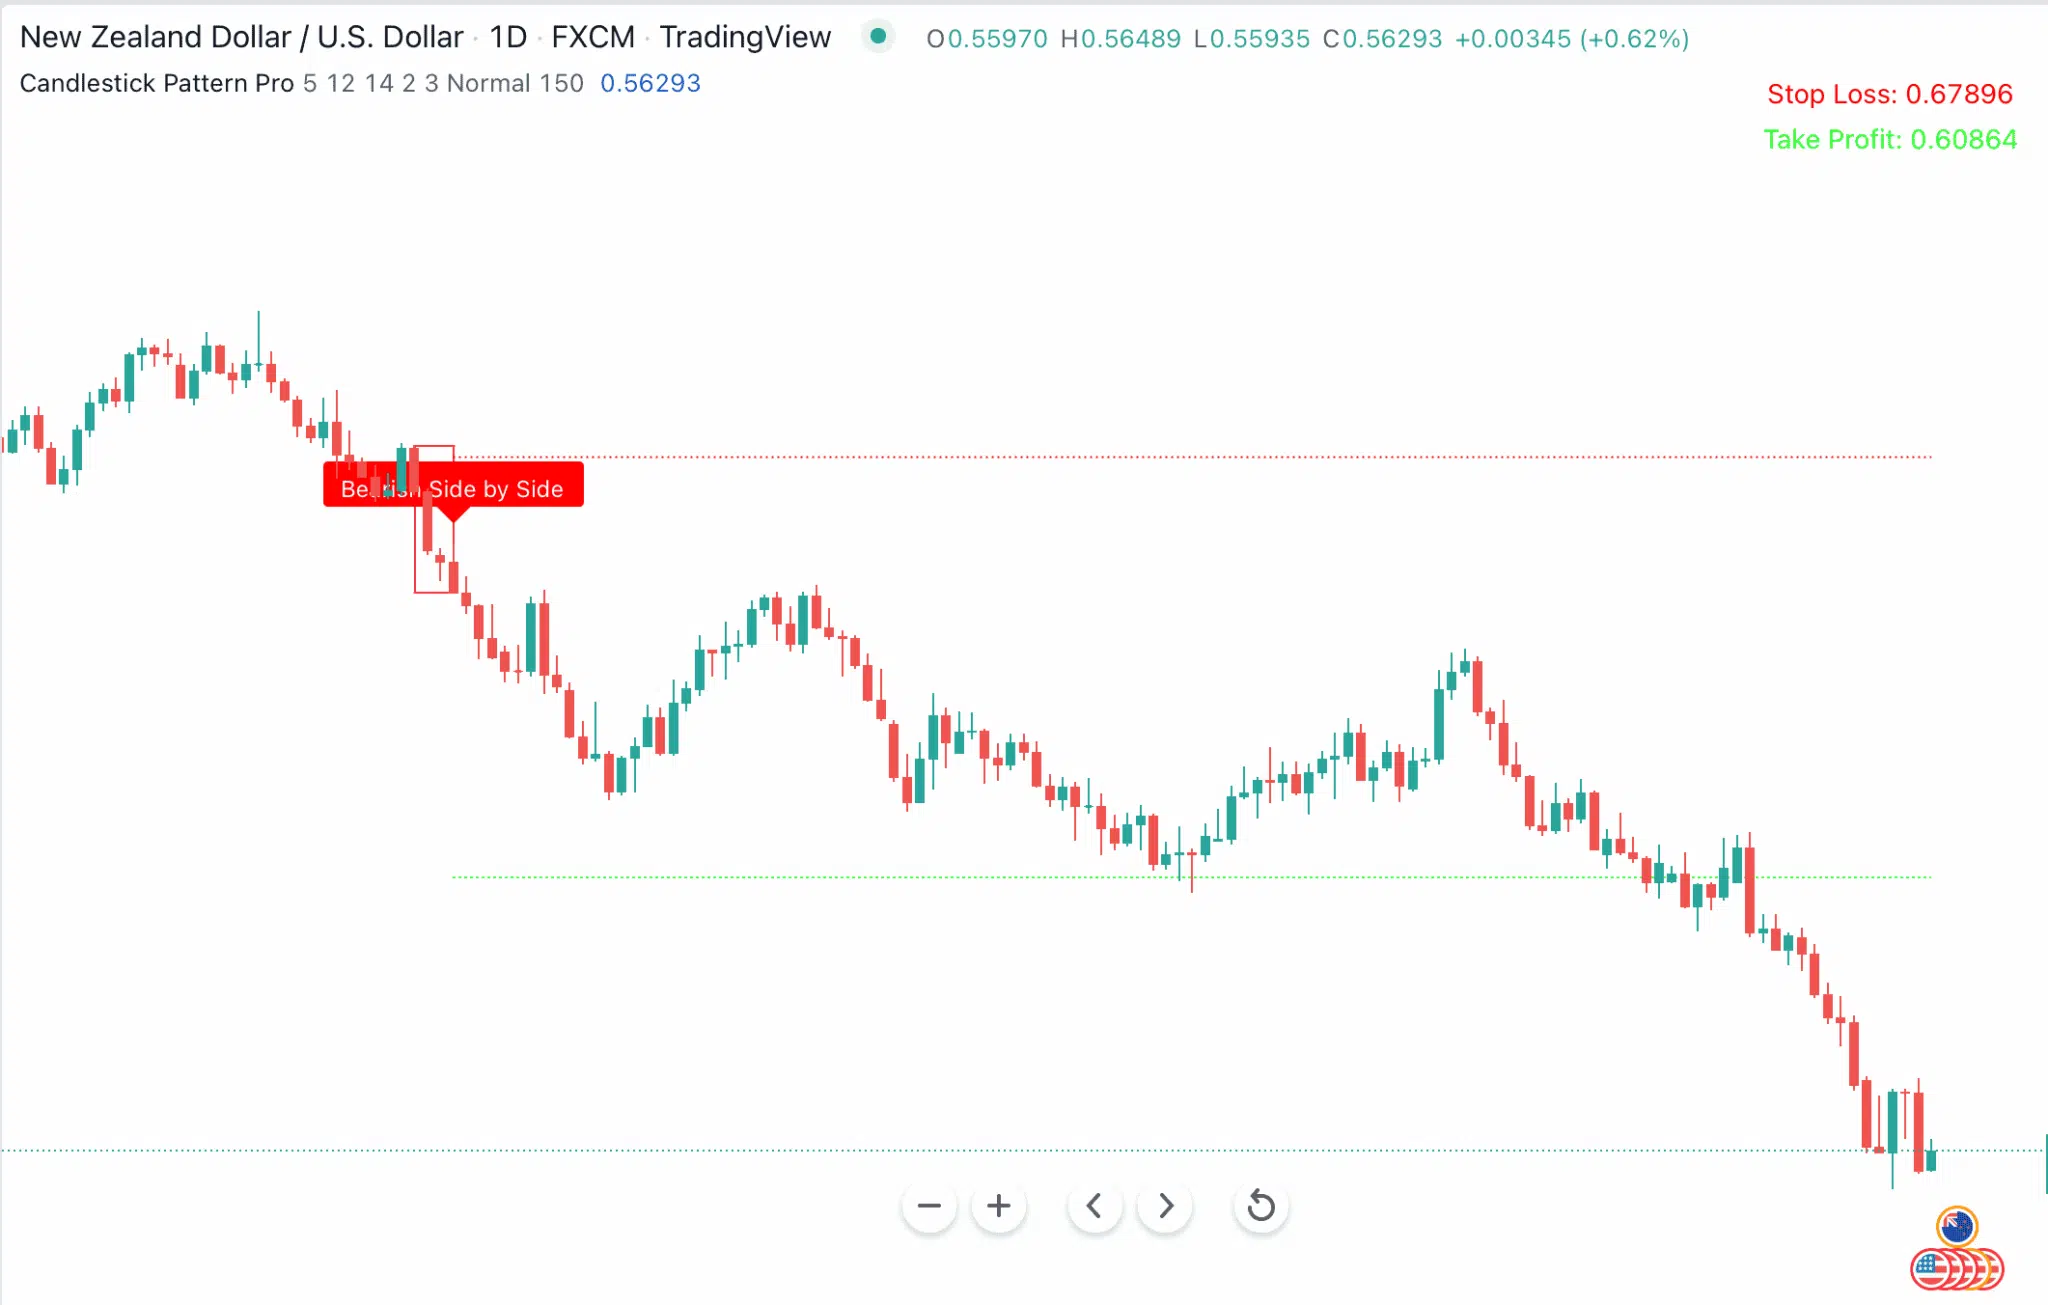
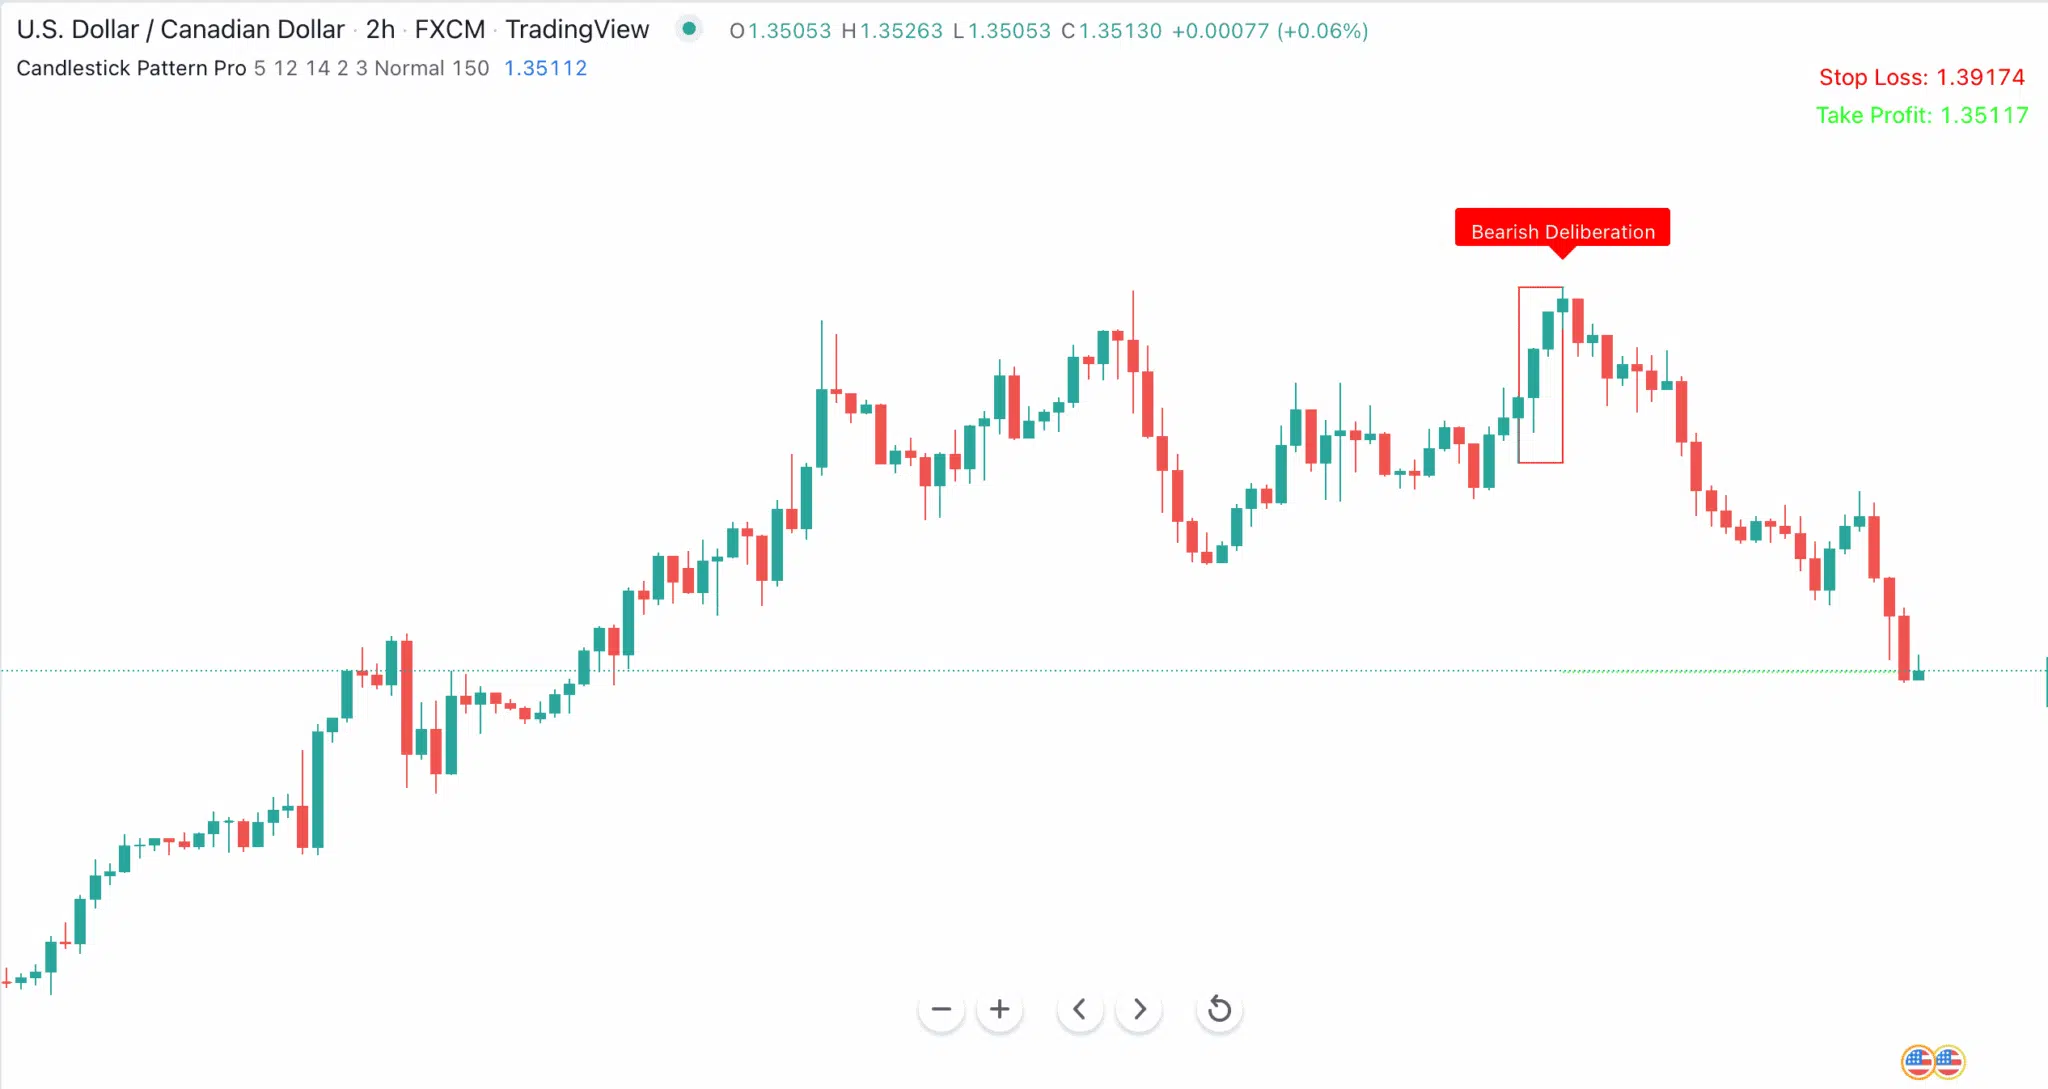
$199.00

📌 The indicator can identify over 30 candlestick patterns… in real time
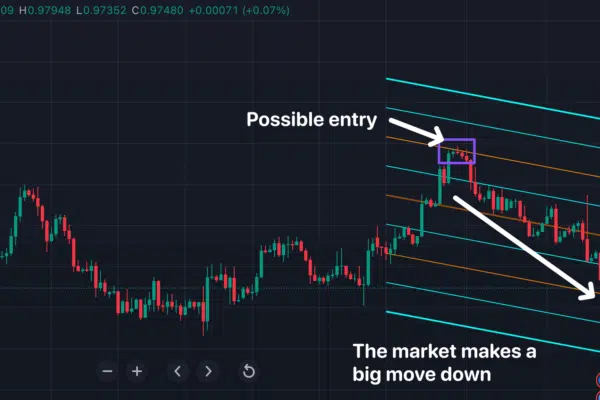
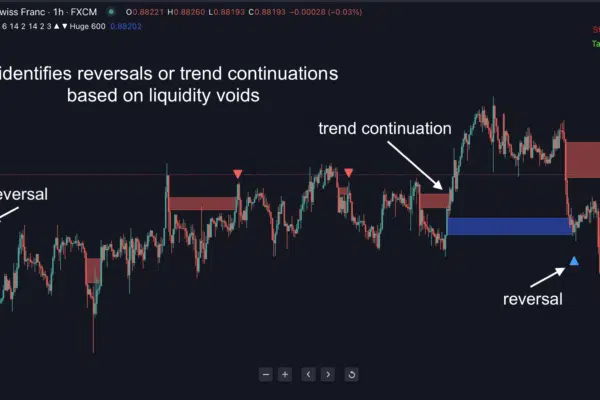
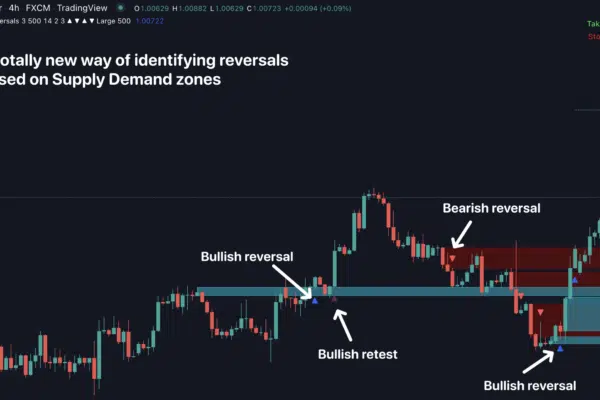
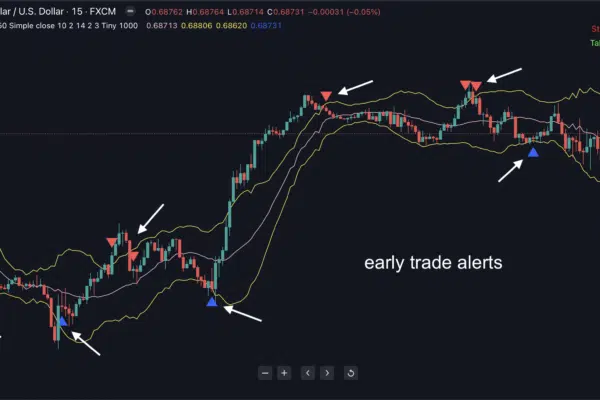
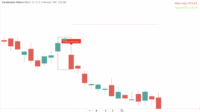
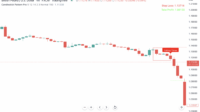
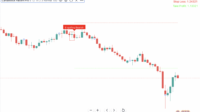
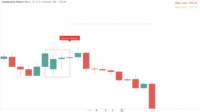
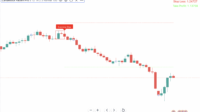
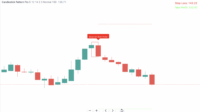
📌 Highlights the patterns clearly on your charts as soon as they appear…
📌 Gives you audio, visual, and pop-up alerts whenever a new pattern appears…
📌 Does NOT repaint… ever!

Frequently Bought Together

+ +
Buy all these together to get this price: $317.60 Save $79.40

1. What exactly is this indicator?

This versatile “Candlestick Patterns” indicator does exactly what its name suggests: It scans the market in real time & detects over 30 candlestick patterns for you. And plots these patterns beautifully on your charts. It’s never been easier to apply candlestick patterns in your trading.


2. Reversal patterns that Candlestick Pattern Pro will find for you:

Here’s just some of the Reversal patterns this indicator can detect:

  • Outside Up/Outside Down

In this case, the Outside Up pattern precedes a major upward move. If you followed this pattern, you would have gotten an easy winning trade.

  • Bullish / Bearish Belt Hold

As you can see, in this example the Bearish Belt Hold pattern correctly predicts a reversal. The pattern is quickly followed by a significant bearish market move.

  • Morning Star / Evening Star
  • Hikkake Pattern
  • Engulfing Bullish / Engulfing Bearish

But that’s not all. Not even close.

In addition, the “Candlestick Patterns” indicator also detects the following reversal patterns:

  • Hammer / Shooting Star / Hanging Man
  • Piercing / Dark Cloud
  • Harami
  • Belt Hold
  • Kicker
  • Fakey / Hikake
  • Break-away / Line Strikes
  • Counter Gaps

Next…


3. Continuation patterns that the “Candlestick Pattern Pro” indicator can detect

  • Rising Three / Falling Three (and similar patterns like Rising Four / Falling Four, Rising Five / Falling Five)

These are the best continuation patterns in our opinion. When these patterns show up, there’s a high probability that the current trend will continue.

Here’s another great example:


Another one…


  • Other continuation patterns our indicator can detect includes: Marubozu, Tasuki Gap, Side by Side Gap.


Plus, the “Candlestick Patterns” indicator can also detect Exhaustion patterns…

Include: Deliberation and Advance Block / Descent Block. When these patterns appear, there’s a great chance that the current trend will end shortly. Here’s an example:


In this example, the formation of this Bearish Deliberation pattern signals that the previous uptrend was coming to an end. And just as the pattern predicts, a market reversal occurred shortly afterward, and a new downtrend started.

But it keeps getting better. Did you know that you can get…


Timely alerts, so you won’t miss out on important trades.

You’ll get all kinds of alerts: Pop-up, Sound, Email, and Push Notifications as soon as a new zone appears…

And you can customize these alerts in any way you want.

Watch this video guide to see how it works:

Setting Manuals

1.Indicator settings:

Tick boxes of various patterns: there are 29 candlestick patterns that you can choose for the indicator to display. For more information about those patterns please perform a google search of the candlestick pattern names.

Trend period: the specific time frame used to analyze and determine the direction of the market trend.

Average body period:  the ‘body’ of a candlestick represents the range between the opening and closing prices of a security for a given time period. The average body period setting is used to calculate the average size of these bodies over a selected number of past candlesticks.

Maximum display pattern of all types: the maximum number of candlestick patterns of various types that the indicator will display on a chart at any given time.

Maximum display pattern of each type: the number of instances each distinct type of candlestick pattern is displayed on a chart.

ATR period for SL shift: the timeframe used to calculate the Average True Range for adjusting stop loss levels.

SL shift coefficient: a multiplier used with the ATR value to adjust stop loss levels according to market volatility.

TP coefficient (from SL): a multiplier determining the Take Profit level relative to the Stop Loss distance.

Various Color settings: customize these colors to differentiate between bullish/bearish texts, and TP/SL.

Signal arrow size: choosing your preferred size of the arrows.

Max back bars: the maximum count of past candlesticks considered by the indicator for its analysis.

2.Alert set-up:

To stay updated on potential trading opportunities, you can set up alerts within the Candlestick Pattern Pro indicator.


Step 1: From the indicator settings, customize your alerts by defining your desired parameters for buy and sell signals. The selected configurations will be used for notifications in Step 2.

Step 2: To receive notifications through the app, pop-ups, alert emails, Webhook URL, sound alerts, or email-to-SMS, enable these features by clicking on TradingView’s Alert icon.

Step 3: Select Candlestick Pattern Pro from the “Condition” dropdown list.

Step 4: A pop-up will appear as follows. Click on “Notification”.

Step 5: Choose the types of notifications you’d like to receive, and click the “Create” button.

FAQ

After purchasing, you’ll fill out a short form that asks for your Tradingview username. And then, we’ll grant your username access to all our indicators within 24 hours.

It works on ALL markets internationally that are available on Tradingview: FX, stocks, indices, commodities, futures, etc…

All sales are final and non-refundable.

TV Champ Membership

Get instant access to the entire collection of all of our best TradingView indicators when you join our “TV Champ” membership​:

✔️ All custom indicators
✔️ All updates
✔️ All NEW indicators that we’ll release

To see the full list of all indicators included in the TV Champ membership, click here…

Reviews

Don’t take our word for it, read our customers’ testimonials from Trustpilot.com

You may also like…