Frequently Bought Together

+ +
Buy all these together to get this price: Original price was: $897.00.Current price is: $717.60. Save $179.40

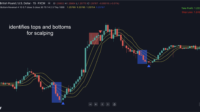
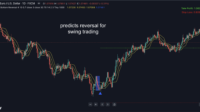
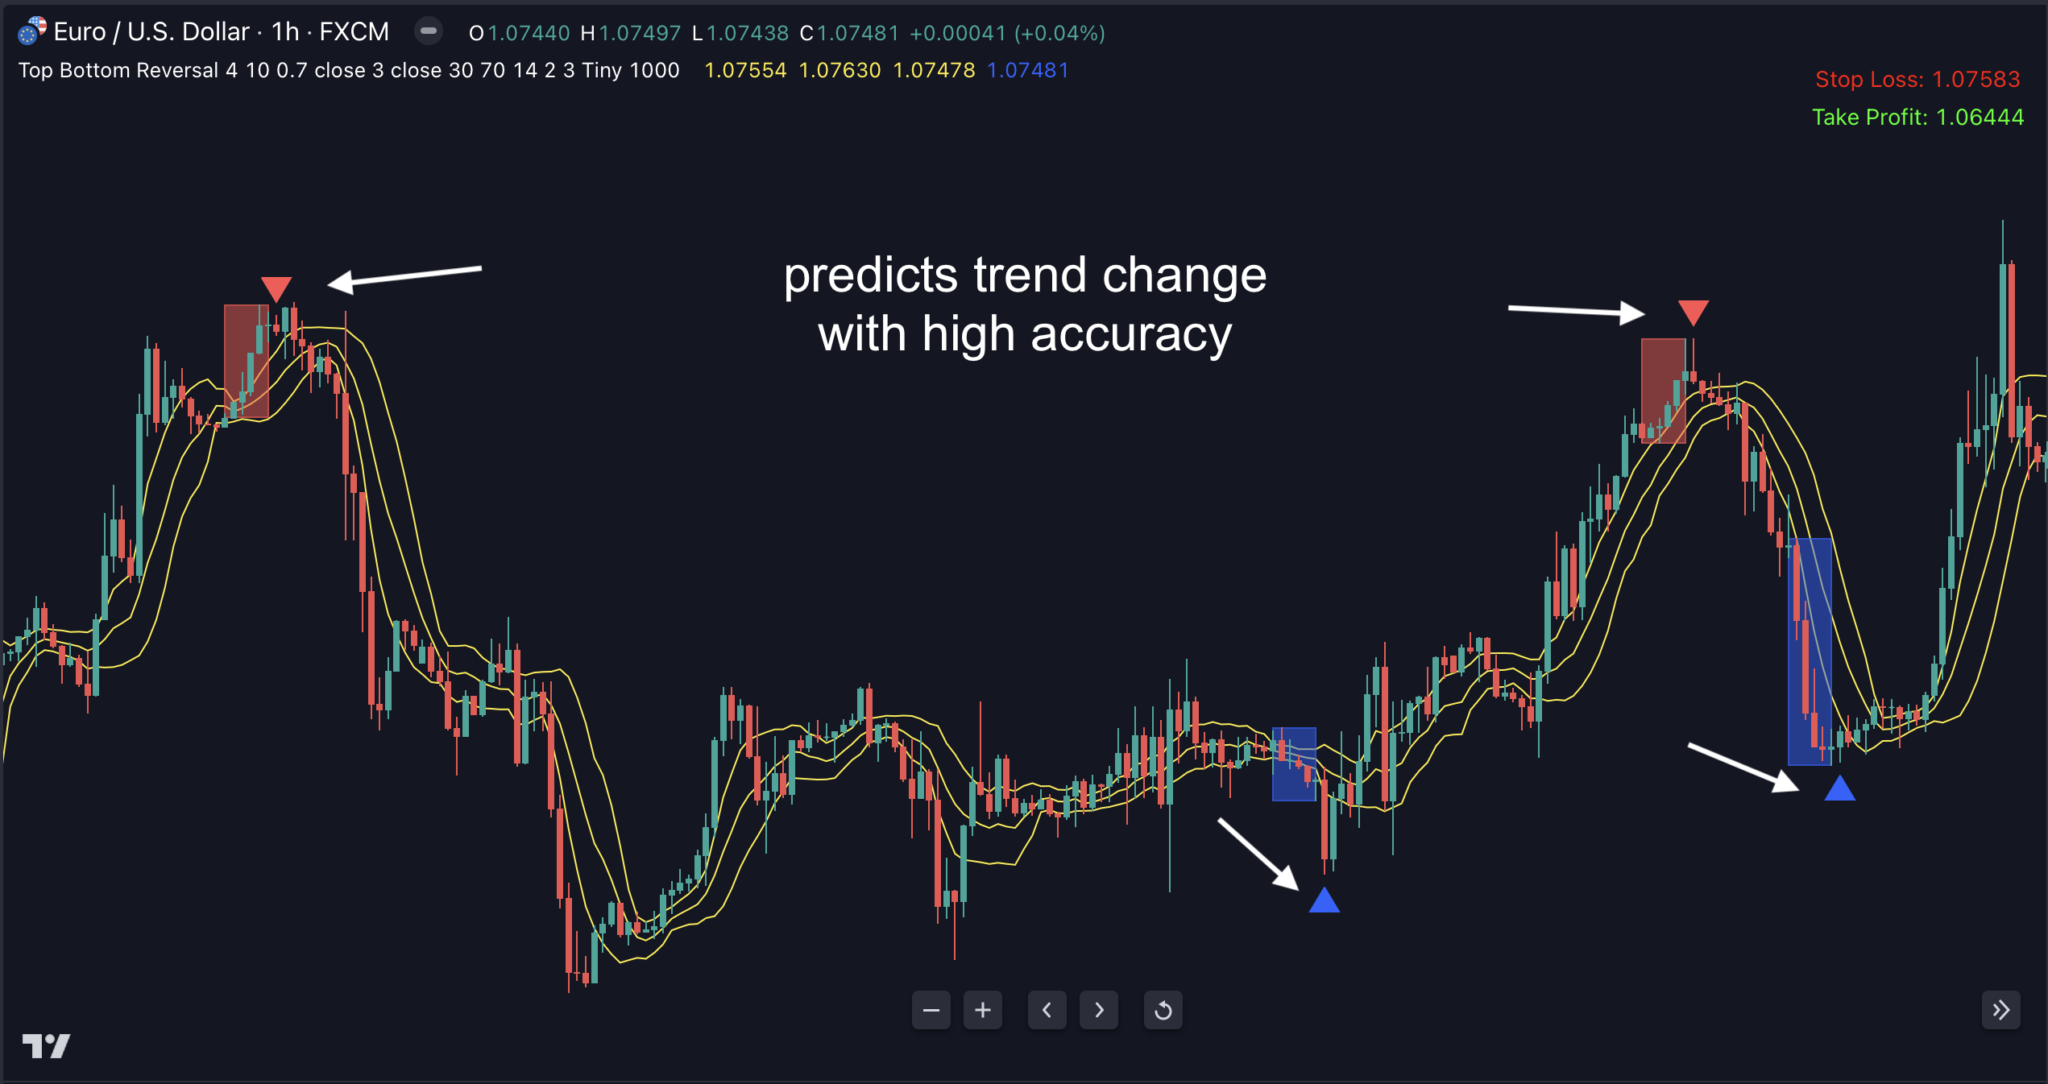
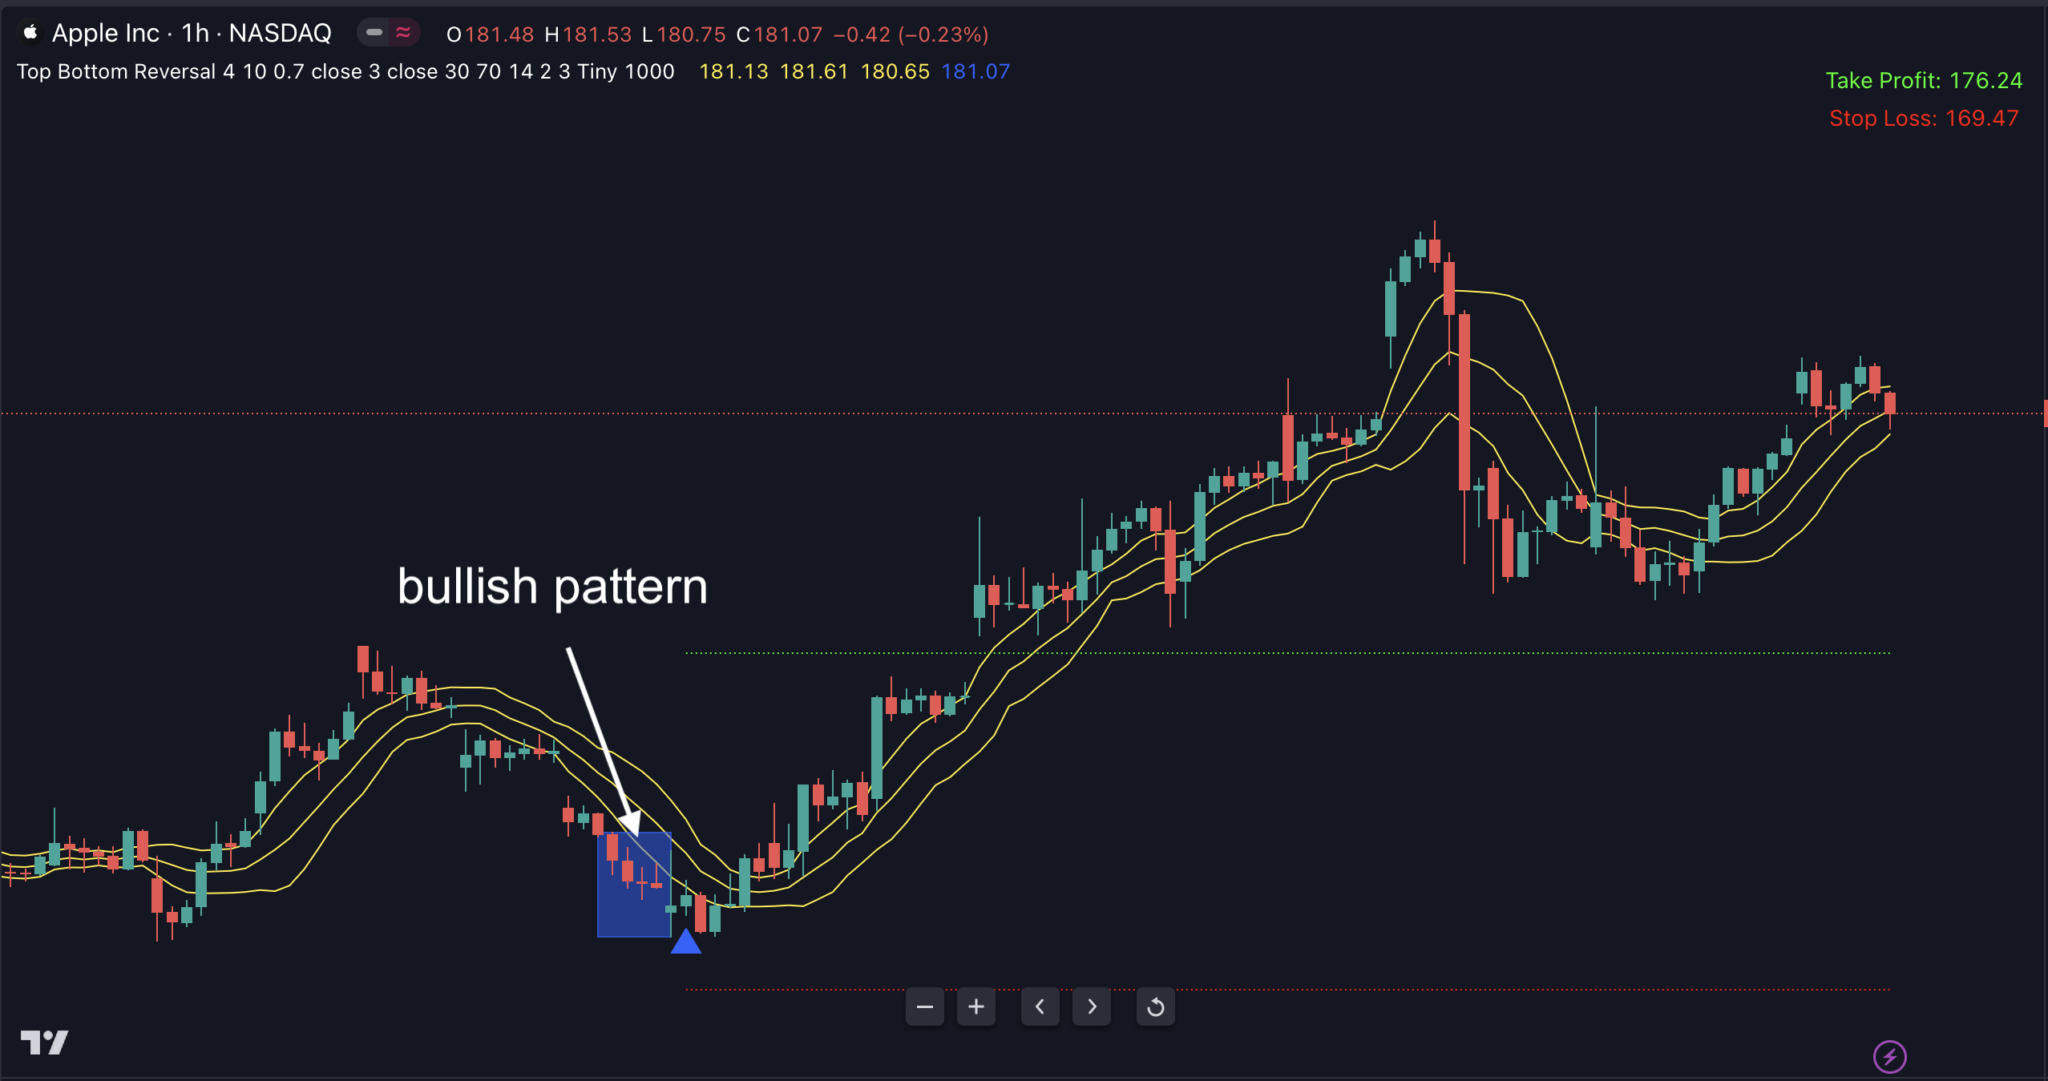
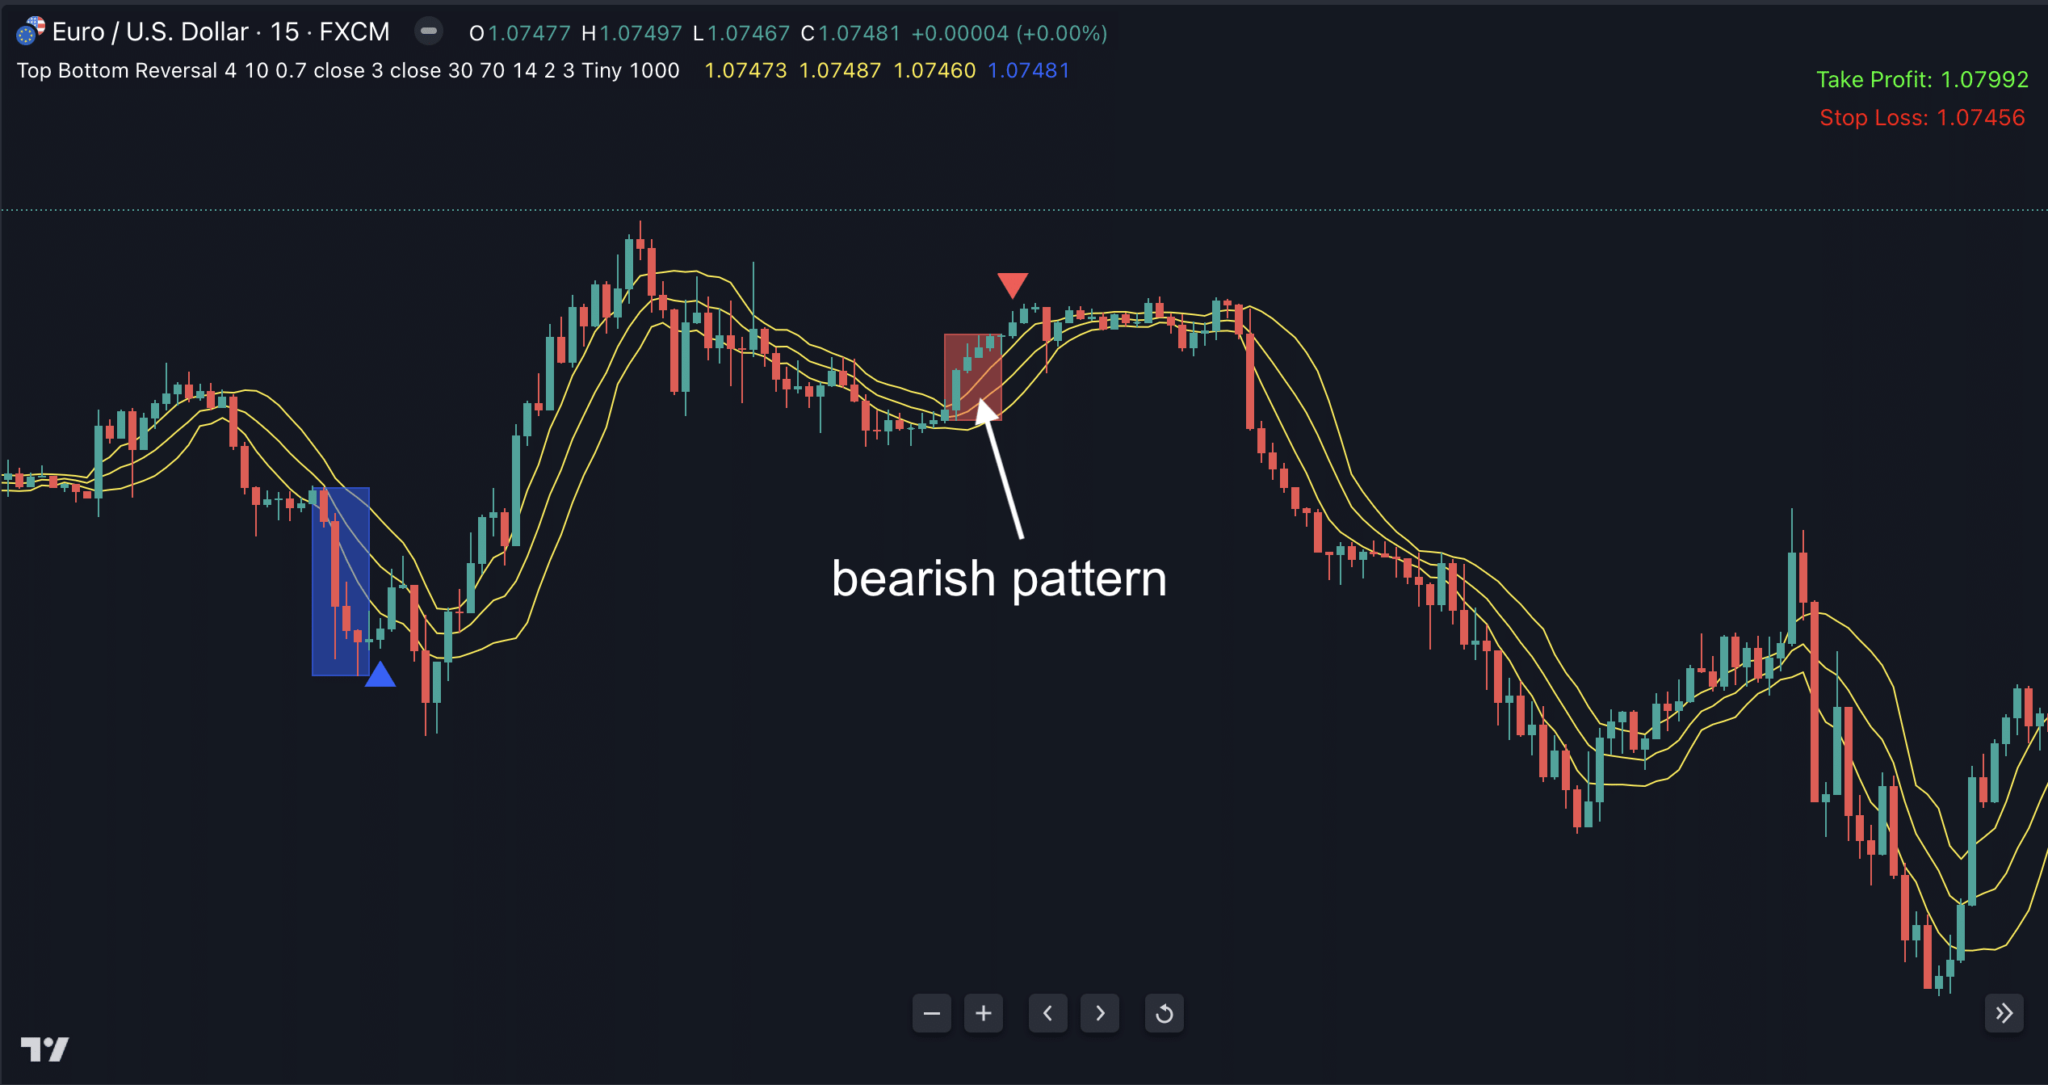
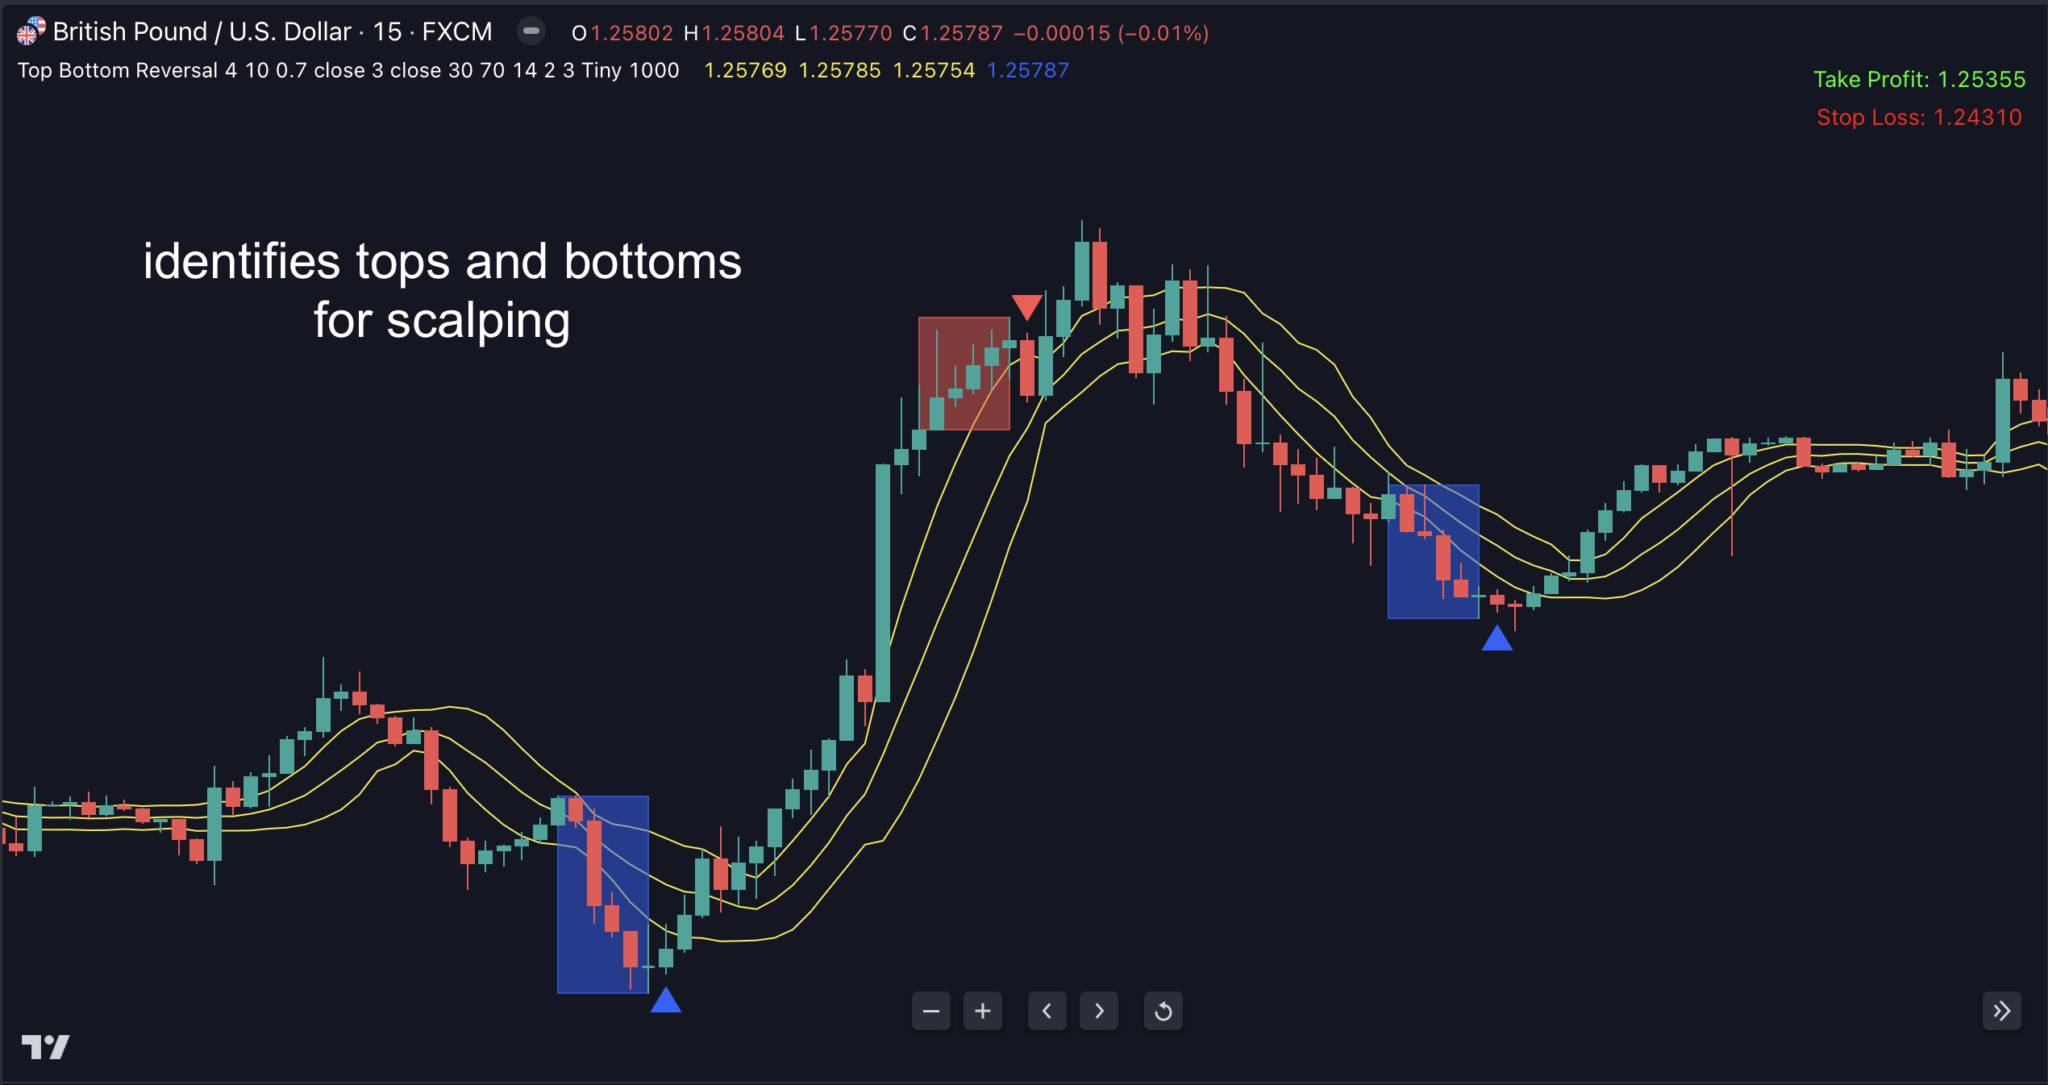
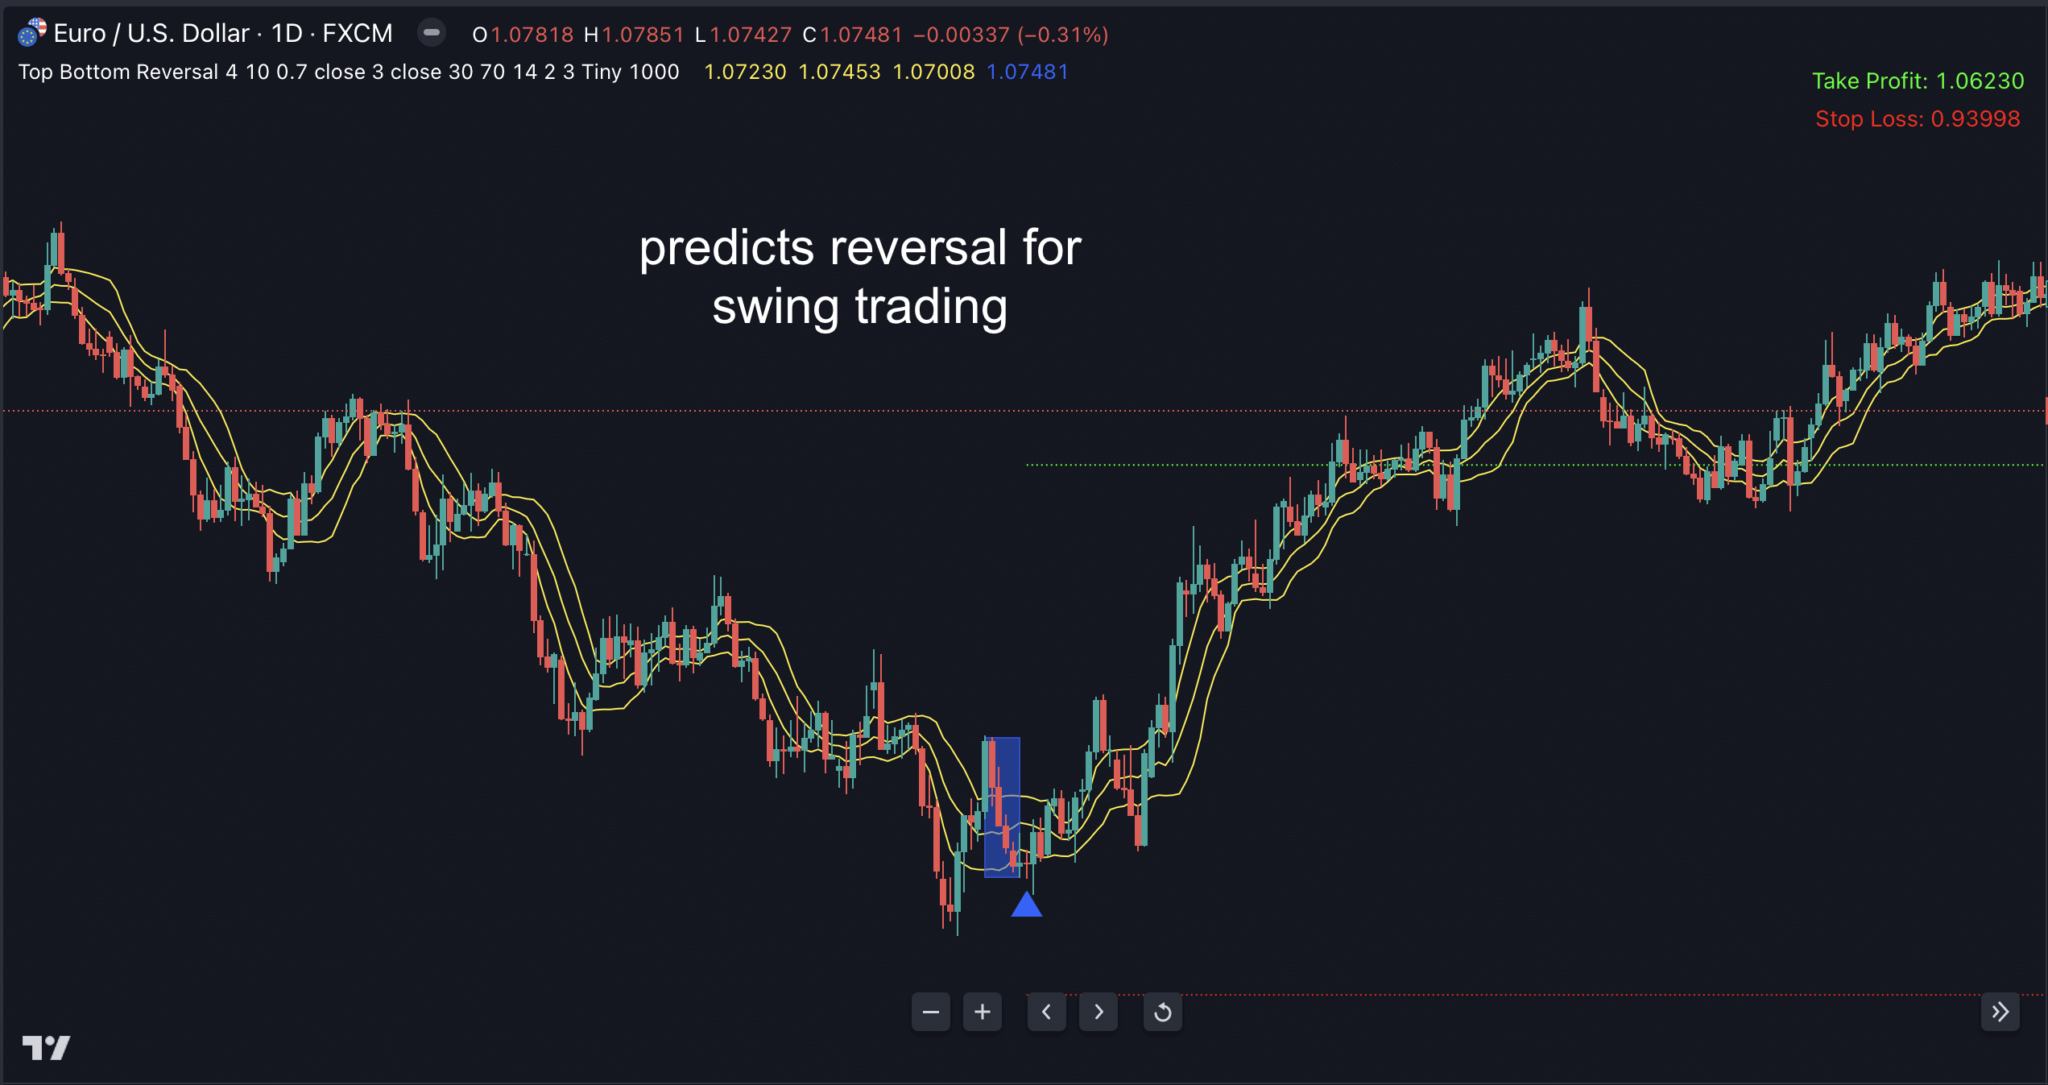
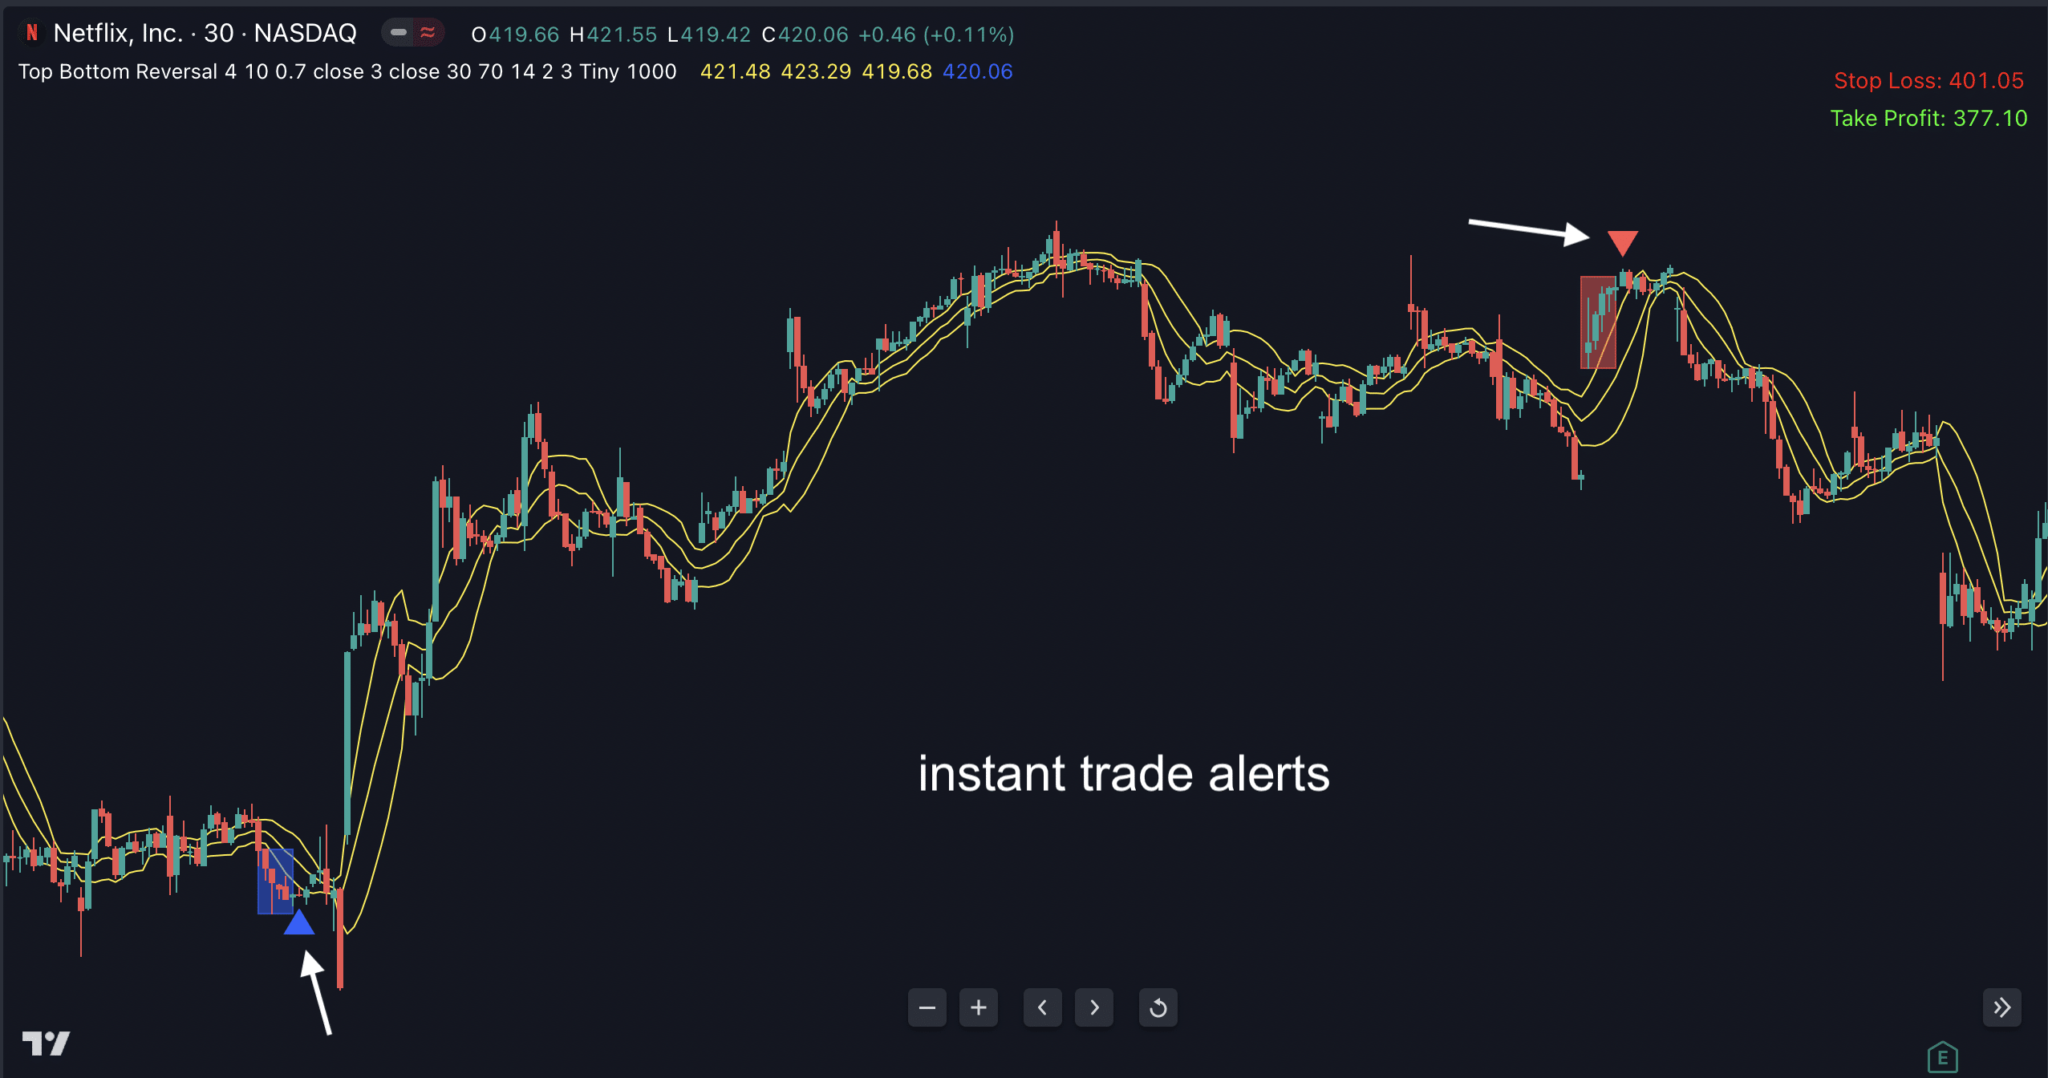
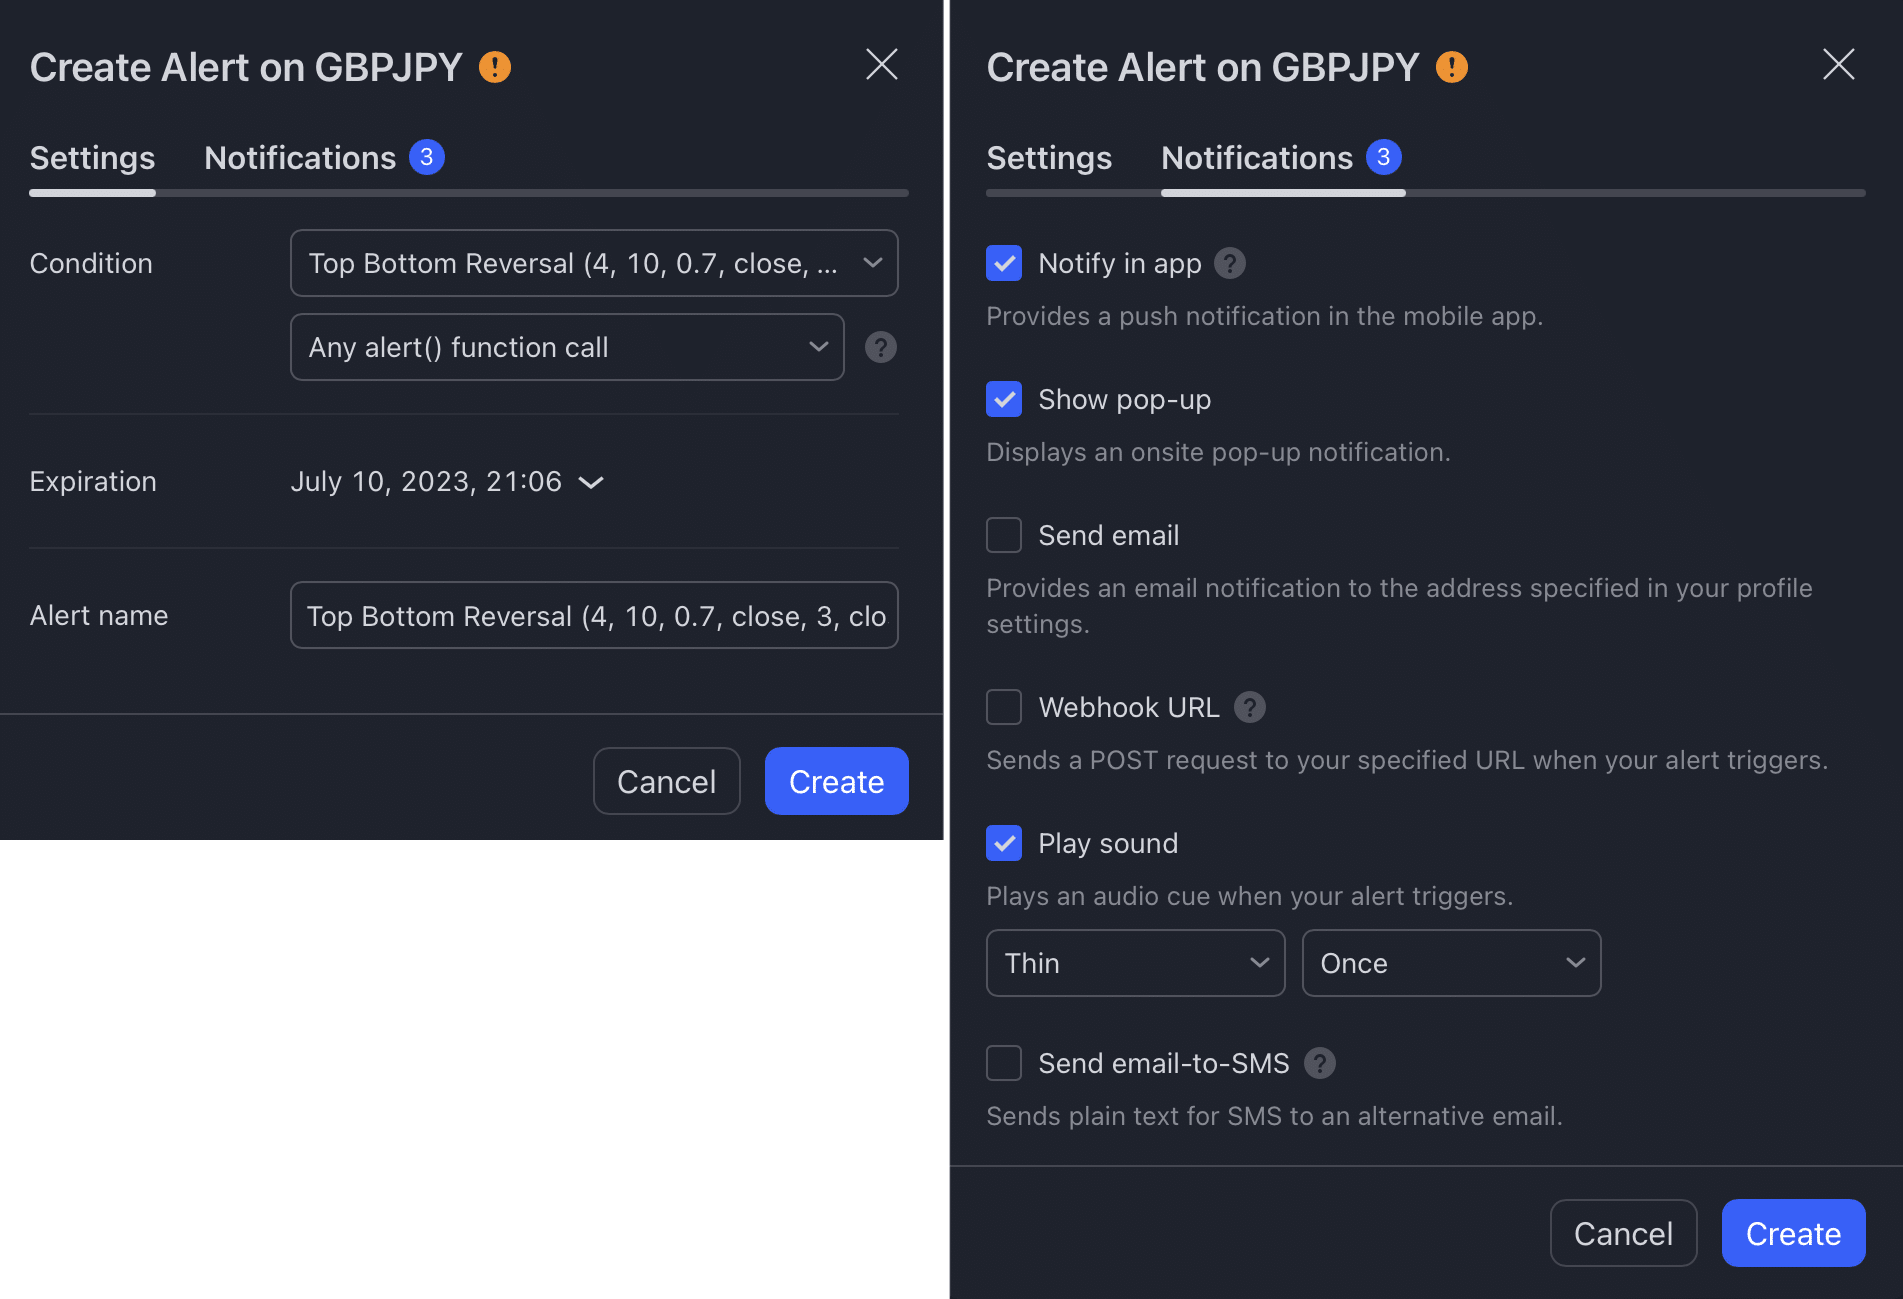
Top Bottom Reversal for Tradingview

$299.00

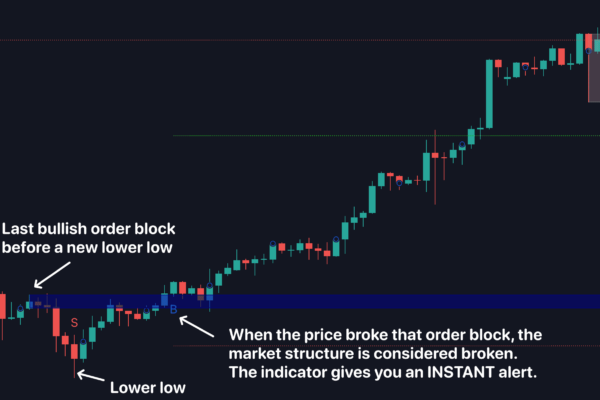
✅ Unique chart-pattern forces indicator to predict trend change with startling accuracy
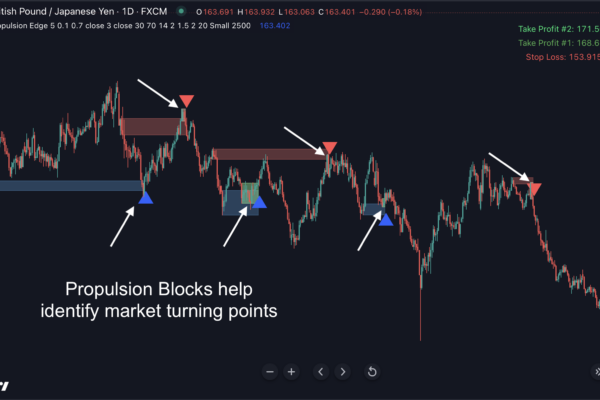
✅ Beginners: WIN from the start. Veterans: QUIT SPECULATING when & where markets will turn
✅ Done-For-You entry price, stop loss and profit targets… An “almost” set & forget solution.

After profiting in secret for months, this market timing phenom is FINALLY revealed!

Put This All-New “Top Bottom Reversal Indicator” On Your Charts To Profit From A Little-Known Chart Pattern that Triggers Accurate Market Reversal Setups Almost EVERYTIME It Occurs

Plug This Indicator In… And Begin Copying These Trade Setups Within The Next 30 Minutes…

Dear Trader,

Quick question…

If you could place a bet that it would rain every time after seeing dark clouds form in the sky—how many times would you do it?

Almost always, right?

Well, there’s a little-known chart pattern that forms before ALMOST every market reversal which tips us off to EARLY trend changes.

Most people would keep this to themselves. But here’s the thing:

There’s enough in the markets for all of us.

So, take a look at that specific chart pattern that formed before these 2 winning trades:

and this…

Amazing, huh?

Yes, this happens on ANY time frame of any currency pair, stock or futures you can trade on TradingView.

Imagine opening multiple charts of different assets with Top Bottom Reversal working in the background, capturing potential profit-laden trades; your possibilities are endless!

Here’s What Makes It So Powerful

The secret is that it trades extremes. Firstly, it identifies an RSI level above 70 or below 30. Secondly, a candle must print outside of the Bollinger bands. And, lastly, at least four consecutive bearish or bullish candles ending with an indecision candle or a Doji.

These candles usually show that sellers or buyers are losing their control while buyers or sellers are becoming more powerful, and that indicates the end of a trend.

Top Bottom Reversal indicator combines these 3 extremes to locate Tops and Bottoms more accurately.

Its complex algorithm involves price action, standard deviation, overbought/oversold calculation together to give clear entry/exit points. 

It does most of the heavy lifting and makes your life very VERY easy. 

If you like to scalp, could you see yourself nailing trades like this?

Equally, if you are a swing trader, wouldn’t you like trades like these also? 
In both instances…

Instant Trade Alerts Will Be Provided As Soon As Trends Change

Sure, in your daily analyses, you expect your preferred asset to reverse but YOU DON’T KNOW WHEN! That’s where Top Bottom Reversal will help you. Let’s have a look at the powerful indicator in action…
In the past, you may have entered TOO EARLY or TOO LATE, missing precious pips or suffering unnecessary drawdowns. But with Top Bottom Reversal, the indicator automatically detects the unique chart pattern, prints the arrow and generates an alert when it’s time to buy or sell. Yes, PRECISE, EXACT market timing! With that alert, you’ll also get entry price, stop loss and take profit levels displayed in the top, right hand corner.

And here’s where it gets even better:

This Is The Closest You’ll Ever Get To An Automated Trading Strategy

So if you’re a beginner with no trading experience, Top Bottom Reversal is the ideal tool to get you started in your trading career.

Even better, if you been trading for a while, it will generate precise trade data to complement your strategies.

To make sure you never miss a trade, you will be notified by a pop-up terminal window… push notification… and email notification.

With all you’ve just seen and read, if you’re at all motivated by profit, you will want to test Top Bottom Reversal’s capability.

And it is being offered at a very good investment.

Pretty cool, isn’t it?

By the way, it’s very very easy to trade with the Top Bottom Reversals Indicator for Tradingview because you’ll also get:

The indicator gives you all kinds of alerts: Pop-up, Sound, Email, and Push Notifications as soon as a Top Bottom Reversal setup appears…

You’ll get all kinds of alerts: Pop-up, Sound, Email, and Push Notifications as soon as a new trade setup appears…

And you can customize these alerts in any way you want.

Setting Manuals

  1. Indicator settings:

Consecutive candles count: the number of candlesticks that consecutively follow the same trend direction (either up or down) without interruption. 

Bollinger Bands period: the number of time periods used to calculate the middle band of the Bollinger Bands, which is typically a simple moving average. This period setting affects the sensitivity of the band boundaries to price movements. 

Bollinger Bands deviation: the number of standard deviations set above and below the Bollinger Bands’ middle band (typically a simple moving average). This setting determines the width of the bands. A higher deviation results in wider bands, indicating greater price volatility, while a lower deviation results in narrower bands, indicating less volatility. 

Bollinger Band applied price: the type of price data (like close, open, high, low, etc.) used to calculate the Bollinger Bands’ middle band, usually a moving average. This choice influences the band’s characteristics and trading analysis.

RSI period: the number of time periods used for calculating the Relative Strength Index, a momentum indicator in financial trading. Shorter periods make the RSI more sensitive, while longer periods make it less sensitive to recent price changes.

RSI applied price: the specific price data (like close, open, high, low) used to calculate the Relative Strength Index (RSI). 


RSI threshold for bullish signal: is typically set around 30, indicating that the asset might be oversold and could be heading for a price increase.


RSI threshold for bearish signal: is typically set around 70, indicating that the asset might be overbought and could be heading for a price decline.

ATR period for SL shift: the timeframe used to calculate the Average True Range for adjusting stop loss levels.

SL shift coefficient: a multiplier used with the ATR value to adjust stop loss levels according to market volatility.


TP coefficient (from SL): a multiplier determining the Take Profit level relative to the Stop Loss distance.


Various Color settings: customize these colors to differentiate between bullish/bearish texts, MA uptrend/downtrend lines, dashboard and TP/SL.

Max bars to calculate: the maximum count of past candlesticks considered by the indicator for its analysis.


  1. Alert set-up:
  • To stay updated on potential trading opportunities, you can set up alerts within the Top Bottom Reversal indicator settings.

    Step 1: From the indicator settings, customize your alerts by defining your desired parameters for buy and sell signals. The selected configurations will be used for notifications in Step 2.

Step 2: To receive notifications through the app, pop-ups, alert emails, Webhook URL, sound alerts, or email-to-SMS, enable these features by clicking on TradingView’s Alert icon.


Step 3: Select Top BottomReversal from the “Condition” dropdown list.

Step 4: A pop-up will appear as follows. Click on “Notification”.

Step 5: Choose the types of notifications you’d like to receive, and click the “Create” button.

FAQ

After purchasing, you’ll fill out a short form that asks for your Tradingview username. And then, we’ll grant your username access to all our indicators within 24 hours.

It works on ALL markets internationally that are available on Tradingview: FX, stocks, indices, commodities, futures, etc…

All sales are final and non-refundable.

You can get more! Introducing…

TV CHAMP MEMBERSHIP

Join our exclusive TV Champ membership and grab ALL our custom indicators for Tradingview. To see the full list of all indicators included in the TV Champ membership, click here…

Yearly
$2997

Platform: TradingView

  •  Billed yearly
  •  All custom indicators (Listed here…)
  • All updates
  •  All NEW indicators that we’ll release
Contact us to buy
Lifetime
$5997

Platform: TradingView

  •  One-time payment
  •  Lifetime access
  •  All custom indicators (Listed here…)
  •  All updates
  •  All NEW indicators that we’ll release
contact us to buy

Our Customer Feedback

Don’t take our word for it, read our customers’ testimonials from Trustpilot.com

4.2

Review Average!
TrustScore 4 out of 5
Based on 94 reviews

1