Trading chart patterns are one of the most powerful tools in technical analysis. In this concise guide, you’ll discover 10 essential trading chart patterns that traders use to identify trend reversals, continuations, and high-probability trade setups.
Very few technical trading theories come close to the popularity of trading chart patterns. The seemingly naive quest to discover particular shapes and lines in the markets has opened several doors of success.
By learning trading chart patterns, traders can anticipate potential bullish or bearish price moves and plan trades accordingly.
Thus, this article uncovers 10 of the most popular trading chart patterns used by traders today. Readers will also discover exclusive trading tools that simplify pattern detection without sacrificing accuracy.
Trading chart patterns are simply hypothetical shapes formed by market price movements. Owing to their recurring nature, technical analysts anticipate them continually.
Particular bullish or bearish moves to leverage typically follow such visual representations.
Here are some of the most valued trading chart patterns in modern markets:
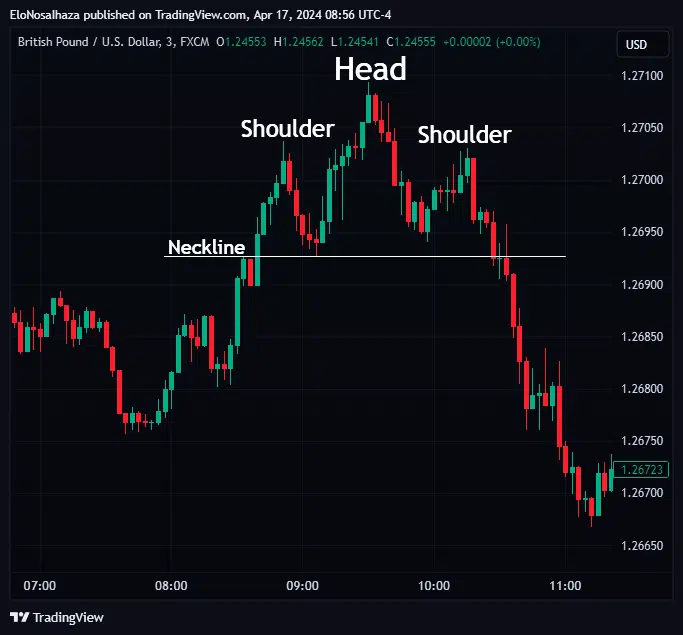
The head and shoulders pattern comprises three peak swing highs.
The middle being the highest is called the ‘head,’ while the two lower options are the ‘shoulders.’
This formation is one of the most recognized trading chart patterns for identifying potential bearish reversals.
The pattern hints at a bullish-to-bearish shift once the price breaks below the neckline.
True to its name, this formation is the reverse of the Head and Shoulders. It occurs in a bearish setting, indicating an imminent bullish reversal after the market breaks above the neckline.
The market forms three troughs – the middle being significantly lower than others.
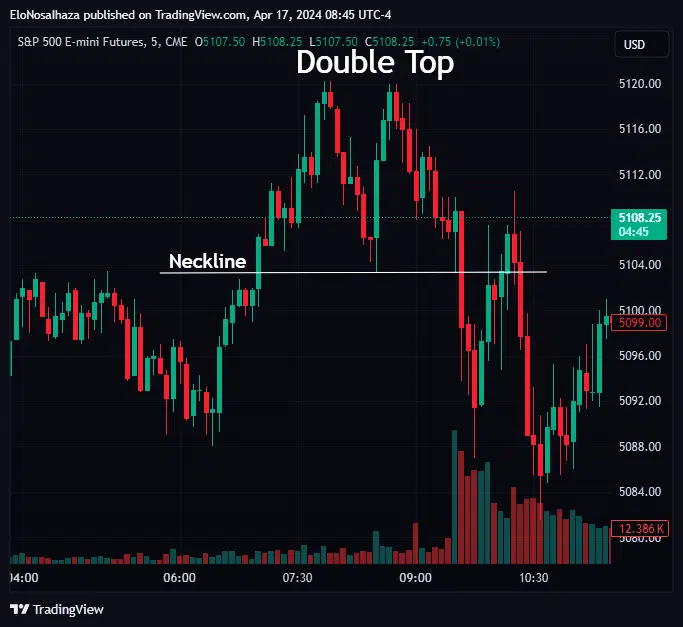
The Double Top is another widely used formation among trading chart patterns.
Instead of the three peaks in Heads and Shoulders, an asset’s price forms two here before a sustained bearish run after breaking through the neckline.
Double Bottoms are the reverse of Double Tops. They suggest a potential bearish-to-bullish reversal after a price run above the neck resistance.
Proponents consider the first bullish move a minor retracement in preparation for the major reversal.
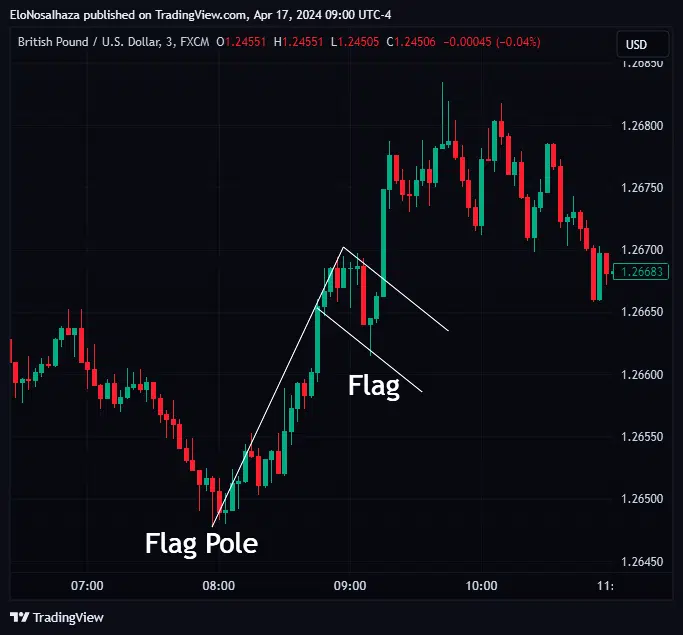
Unlike reversal formations, the Flag is one of the most reliable trading chart patterns used to identify trend continuation.
It consists of two parts:
The pole may be ascending or descending (i.e. it works in a bullish or bearish condition), and users may project its length from the flag as a potential price destination.
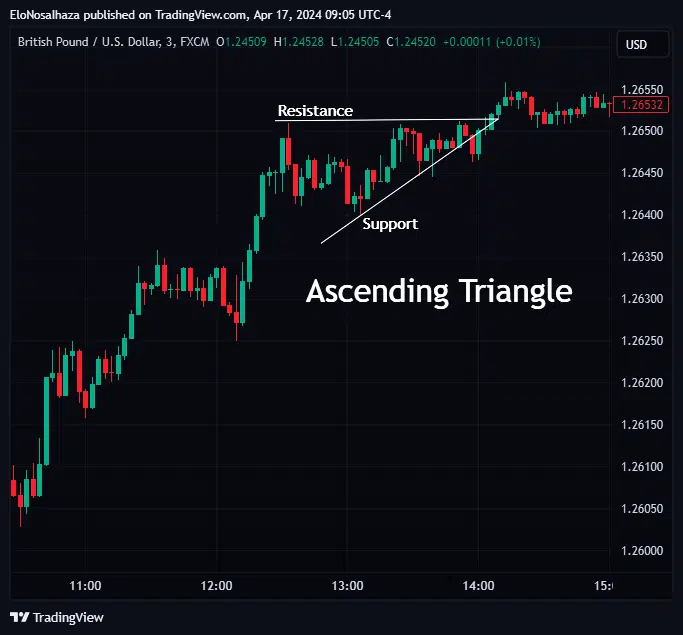
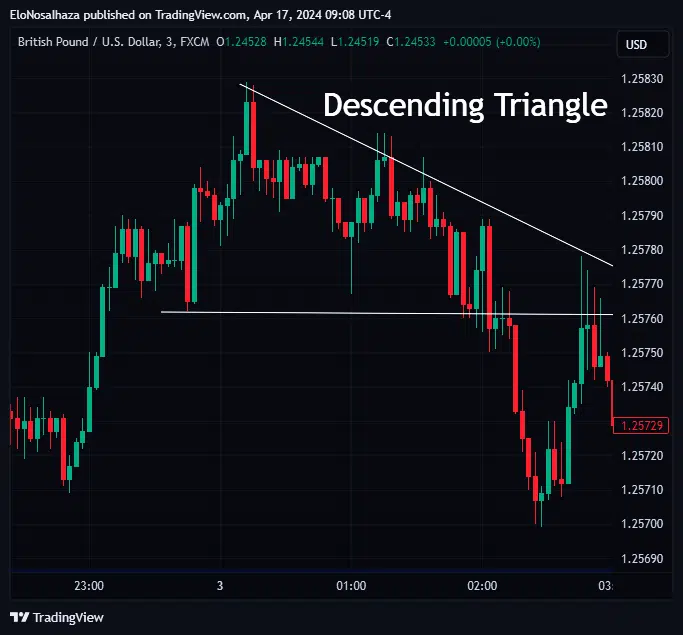
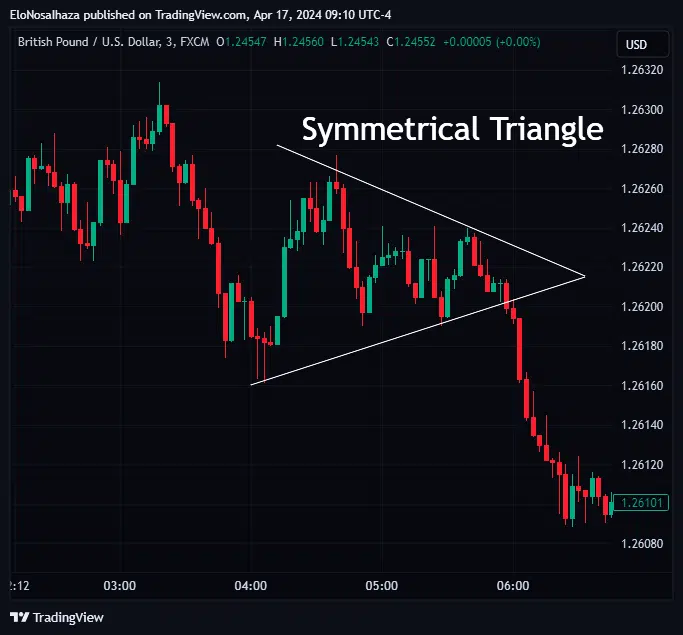
Triangles are another group of trading chart patterns and come in three forms (Ascending, Descending, and Symmetrical), depending on the support and resistance orientation.
Typically, ascending triangles are bullish continuation patterns. Descending triangles signify bearish continuations. Symmetrical triangle patterns can inspire bullish or bearish price runs.
This is another important type of trading chart patterns.
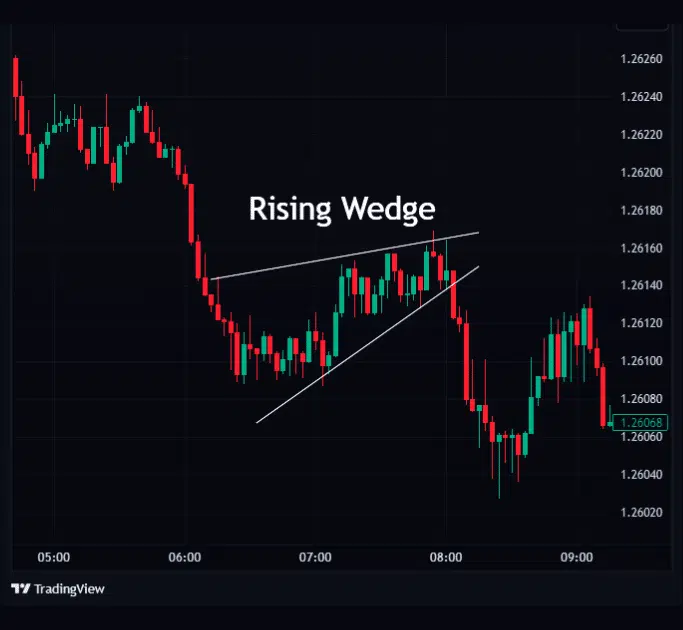
Rising or falling wedges develop from price movements tightening between two sloping trendlines (support and resistance) of uneven steepness.
It typically indicates an approaching bearish reversal when rising and a bullish reversal when falling.
Pennants seem similar to flags, wedges, and triangles in various respects. However, they are typically horizontal and form narrower closures from both trendlines.
Among trading chart patterns, pennants often appear after strong price moves and signal potential continuation or reversal depending on breakout direction.
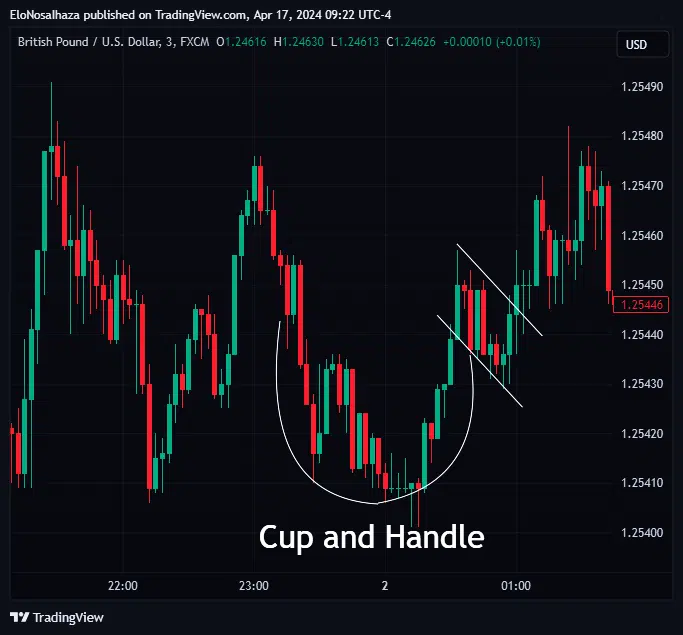
The Cup and Handle is a unique pattern utilizing a curved line to indicate a hypothetical cup with two trendlines for the handle.
It is strictly a bullish continuation pattern as promoters wait for the price to break above the handle.
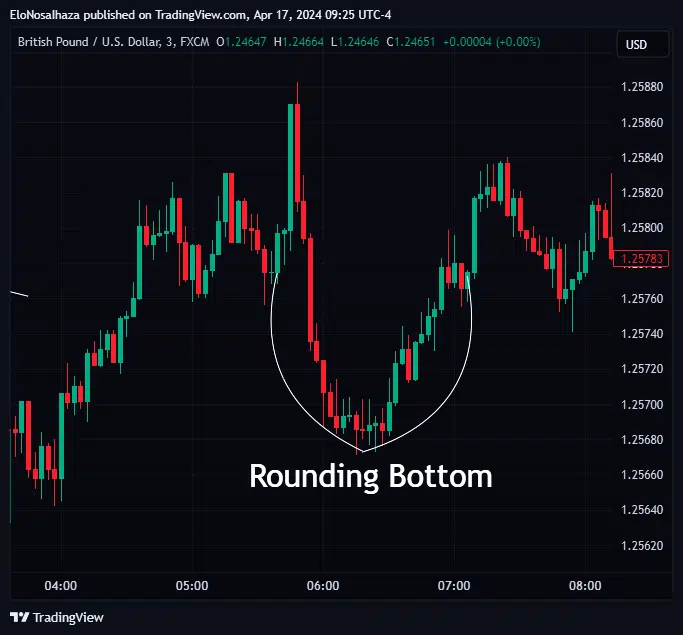
Rounding Bottom suggests a reversal from a downtrend to an uptrend, such as the Cup and Handle.
Like many trading chart patterns, traders wait for price to break above resistance after the rounded base forms before entering a trade.
A reverse version, called the Rounding Top, signals bearish reversals.
Identifying trading chart patterns manually can be time-consuming. This is why many traders rely on advanced pattern detection tools.
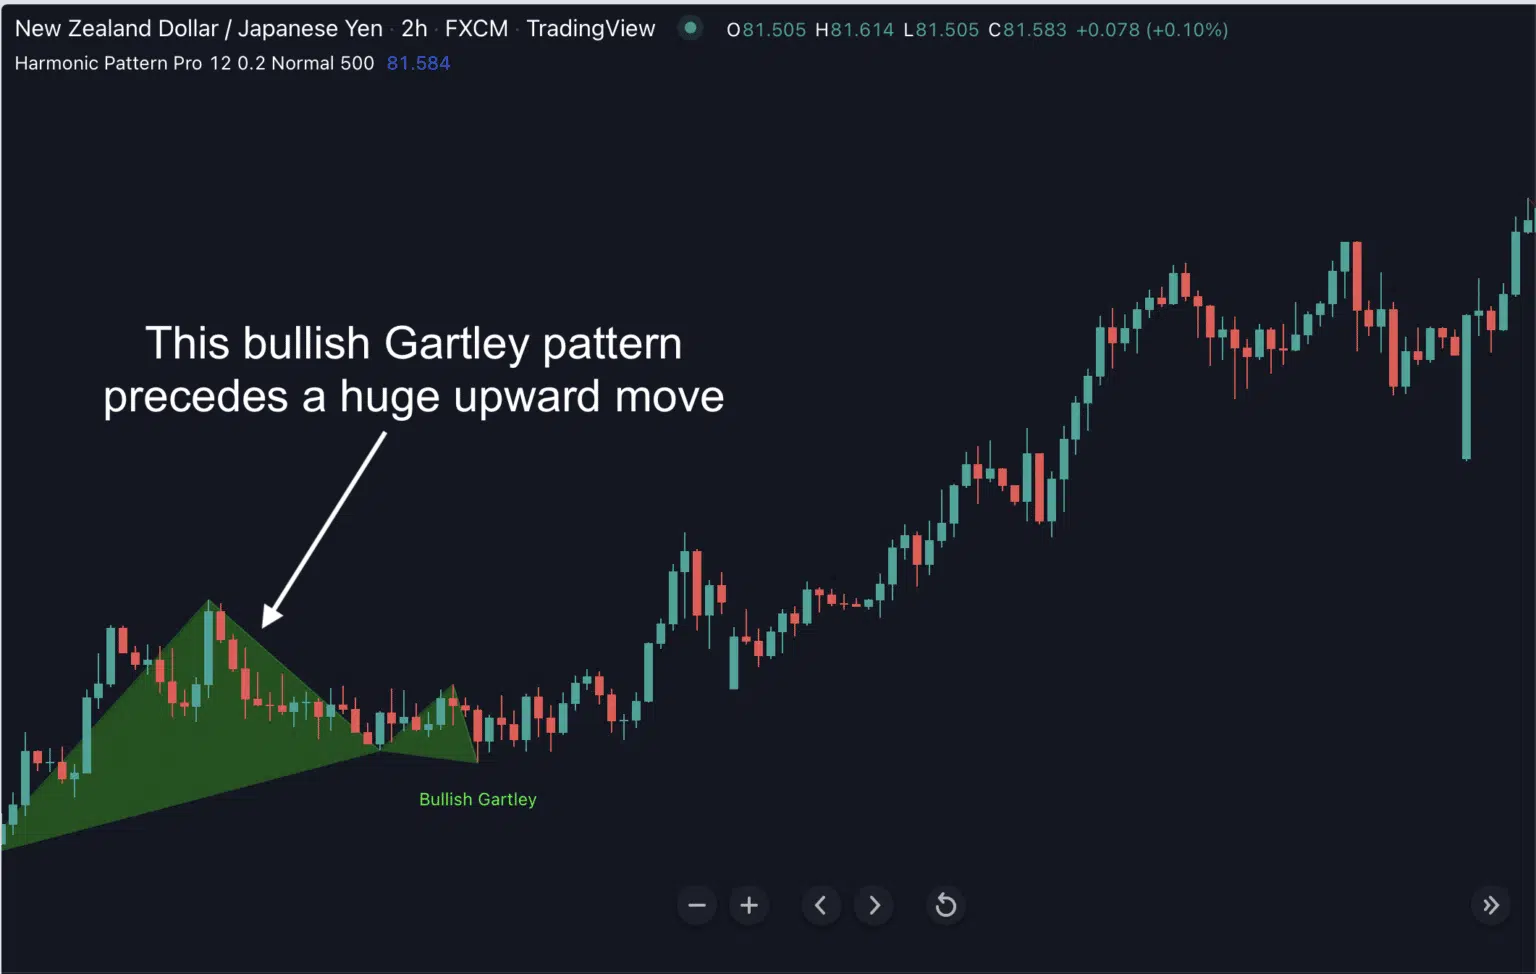
The Harmonic Pattern Pro for TradingView ensures unreal precision in spotting 5+ trading chart patterns, including Butterfly, Gartley, and Shark.
In a nutshell, here are some of its perks:
Too good to be true? Click here and confirm these and many more benefits today.
Furthermore, microscopic market studies have also unveiled candlestick patterns, useful for forecasts. They range from Hammer to Belt Hold and Counter Gaps, which can elude newbies quite easily.
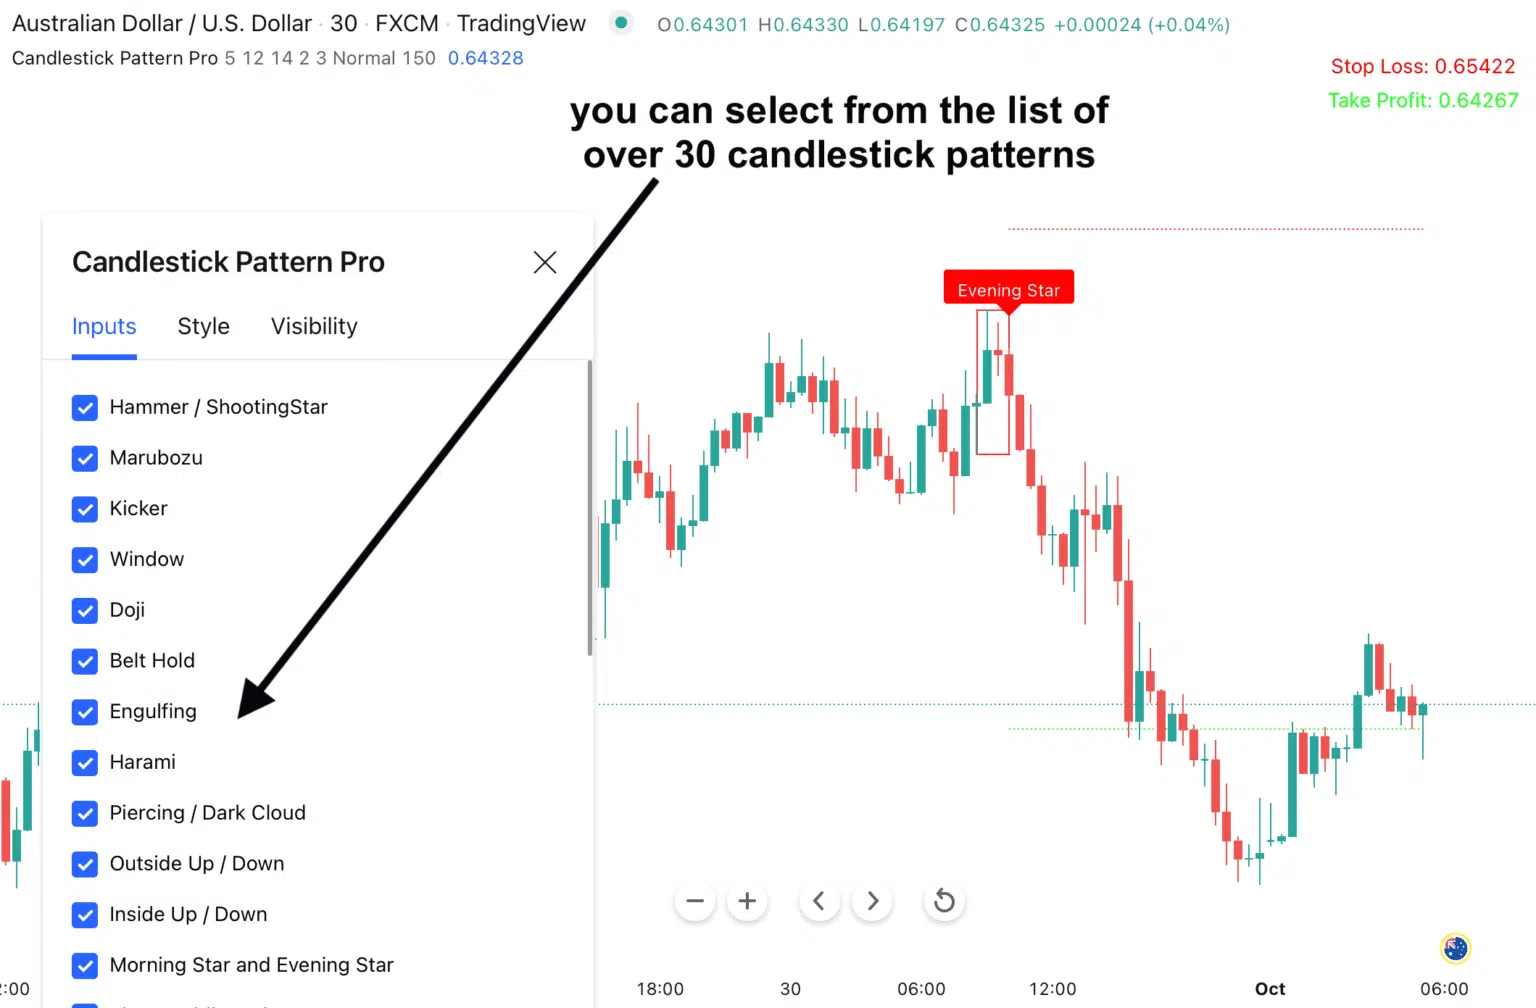
Fortunately, the Candlestick Pattern Pro by Indicator Vault is one of the most recommended tools to uncover them. Over 30 patterns can’t escape the watchful eyes of the algorithms in any market or timeframe.
The mind-blowing system assists users in the following ways:
Check it out now and prepare to be surprised by how much you could’ve missed.
Trading chart patterns remain one of the most engaged theories in technical analysis. Popular ones include Head and Shoulders, Wedges, and Flags, all discussed in this article.
With the help of tools like Harmonic Pattern Pro and Candlestick Pattern Pro, traders can detect trading chart patterns faster and trade with greater confidence.
Please click the Share button and engage the Comment Section below for entertaining eye-opening discussions.