Trading reversals is never as easy as it sounds, but many have found joy in doing it with divergence in trading. Learn how to use these theories like a pro today!
Most traders enter too late and exit too early — not because they lack indicators, but because they fail to recognize when momentum is fading. This is where divergence trading becomes one of the most powerful tools for spotting trend exhaustion and potential reversals.
Divergence doesn’t predict the market blindly. Instead, it reveals when price and momentum are no longer aligned, often signaling that a move is losing strength. When used correctly, divergence trading allows traders to prepare for reversals before they become obvious to the crowd.
You’ll understand all about divergences in this article, the types, and how to spot them in charts. There’s also a top indicator that works with this concept for impressive equity growth.
Divergence occurs when price moves in one direction while momentum moves in the opposite direction. This imbalance suggests that the current trend may be weakening, even if price continues to push higher or lower.
In divergence trading, traders look for moments when:
These mismatches often appear near market turning points, making divergence a popular technique in reversal trading.
Over time, extensive intermarket analysis has revealed fascinating relationships. Some are between instruments in the same market, but a few are among (seemingly) unrelated assets.
Most also forge connections with technical indicators like the MACD.
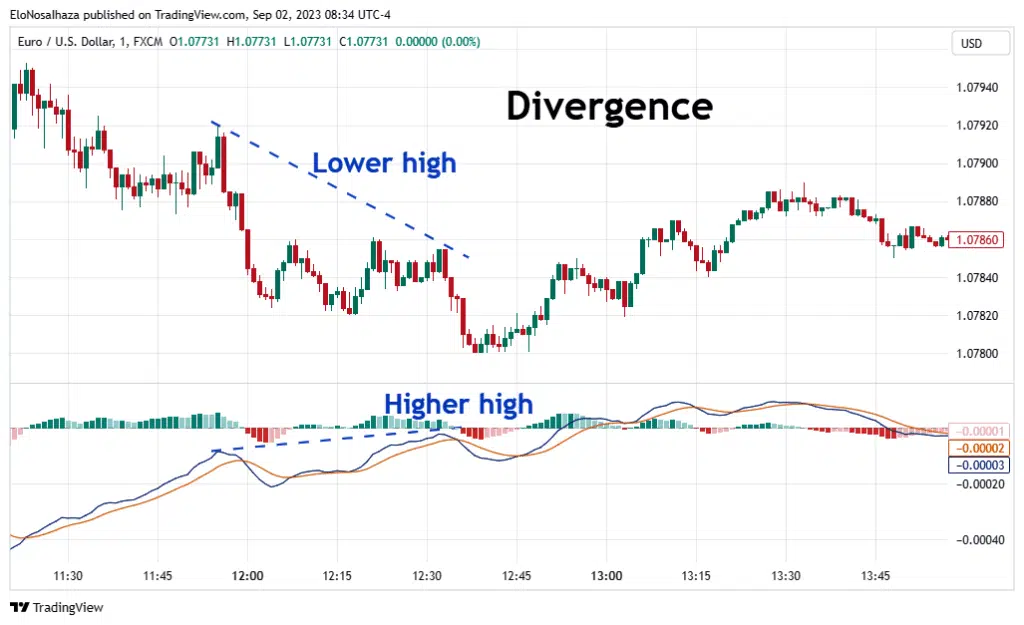
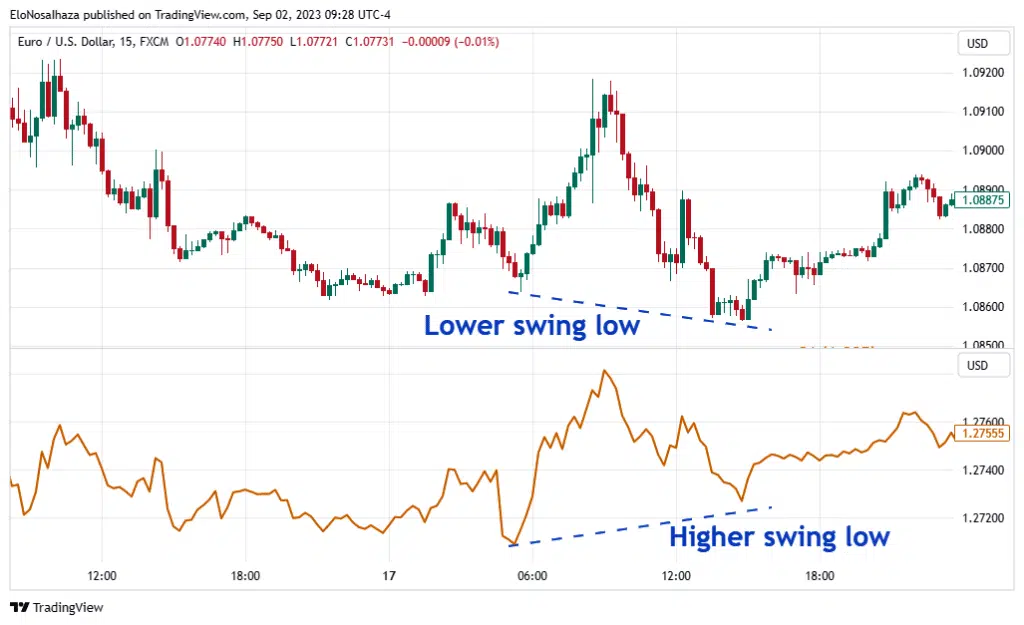
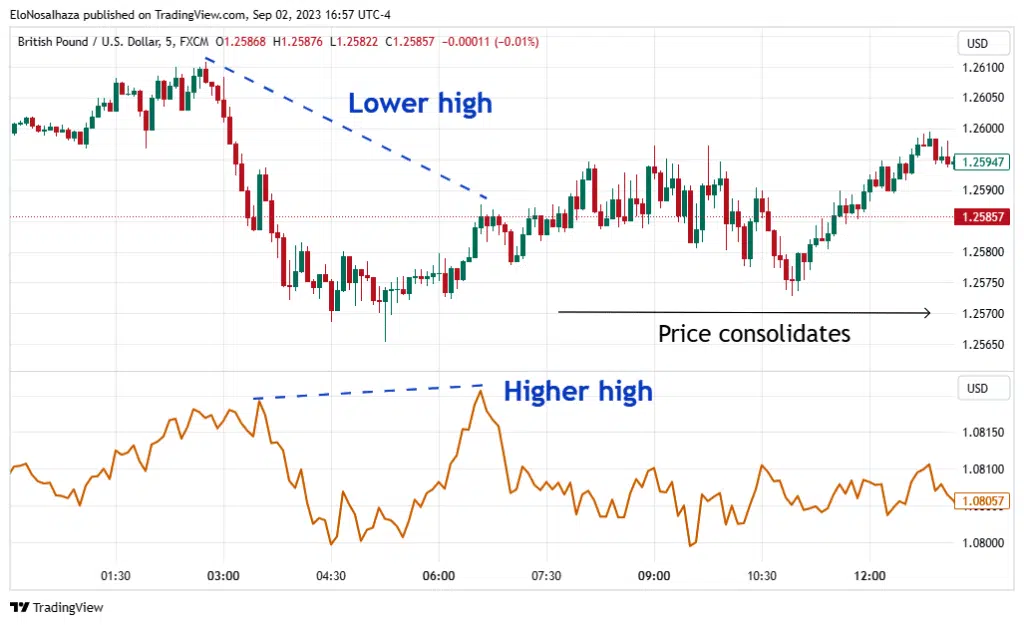
Divergence refers to any significant inconsistency between the moves of such closely related entities. Usually, it is when one fails to record a higher/lower swing high or lower/higher swing low when the other does.
Highs and lows should appear at similar periods if they are directly related (like indicators). Conversely, there are inverse relationships (especially among intermarket assets), where a high formed in one chart coincides with a low formed in the other (and vice versa).
For example, as seen above, the candlesticks in the EURUSD chart made a lower high when the MACD went higher.
Why does it matter?
Divergence is usually an omen of an approaching trend reversal. It may be bullish or bearish, but traders who subscribe to the idea tailor their trading decisions to such possibilities.
As discussed, price analysts have formed strong connections between the price data of different instruments. It doesn’t matter whether they are from the same financial market; what’s important is if the pairing works.
A well-known example is the EUR/USD and GBP/USD pair in the Forex market. They are directly related, so a higher/lower swing high or lower/higher swing low formed in one should appear on the other.
However, divergences occur many times.
Traders have also explored stock and commodity market pairings, and you can, too.
This divergence involving price data and an indicator is more common.
Although any chart representing clear swing highs and lows will suffice, most traders prefer candlesticks.
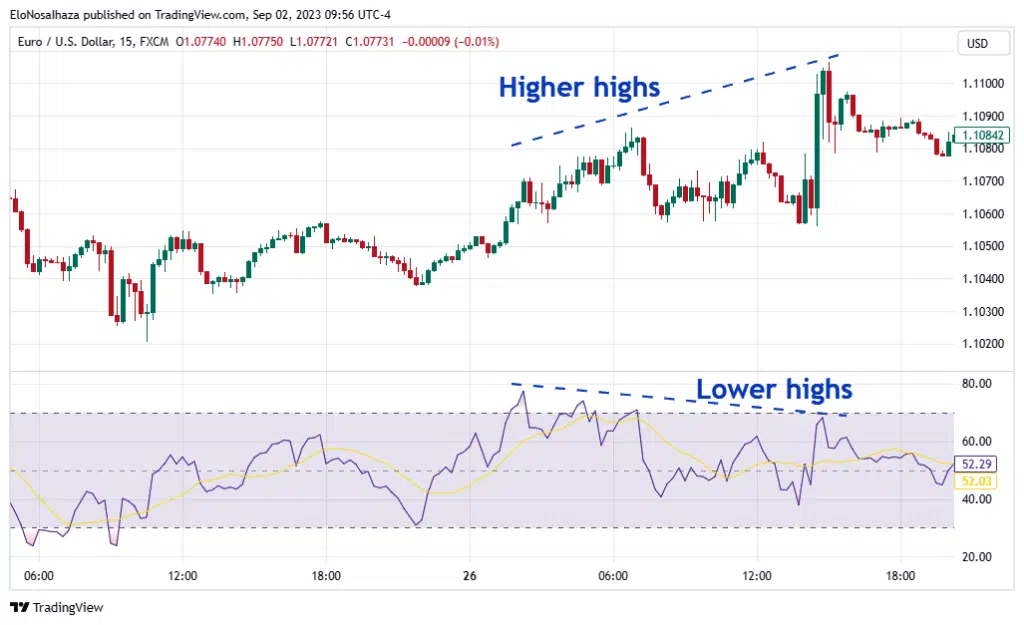
Similarly, price analysts have used various indicators (momentum or oscillator varieties) like MACD, Relative Strength Index, stochastics, etc. Below is a sample case using RSI:
Alone, divergence may appear random and is only noticeable to traders consciously looking for it. The conflict pattern doesn’t last long or occur too frequently, especially within one financial market.
However, when discovered, it can be one of the most powerful indications of reversals.
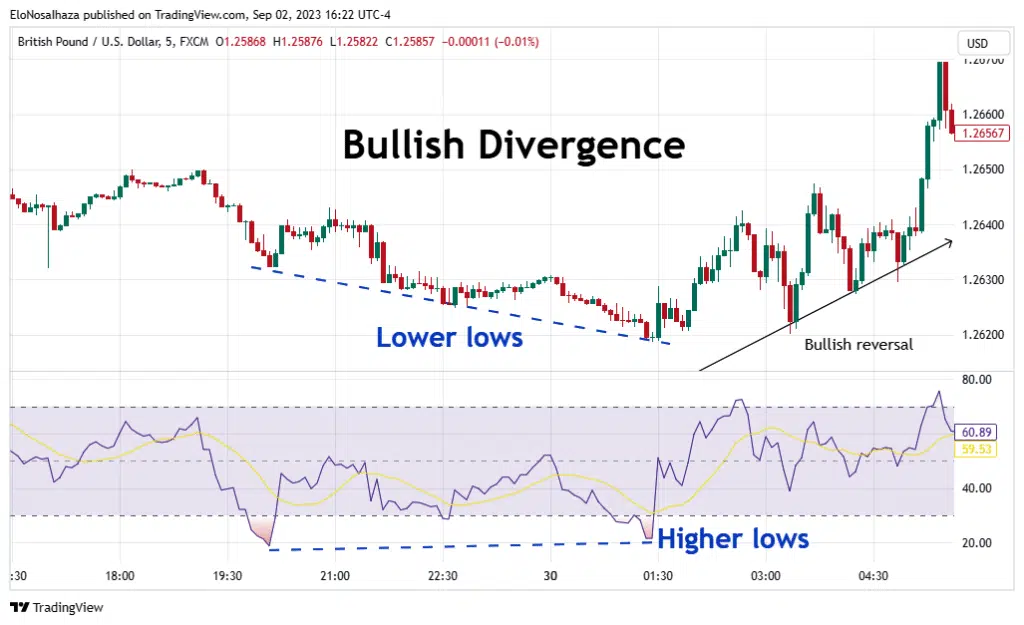
Bullish divergence refers to price reversals from down trends to uptrends. One in the related pair (price chart or indicator) consistently makes lower lows as the other makes higher ones.
Analysts see this as a gradual momentum loss in bearish environments, justifying their anticipation of a bullish one.
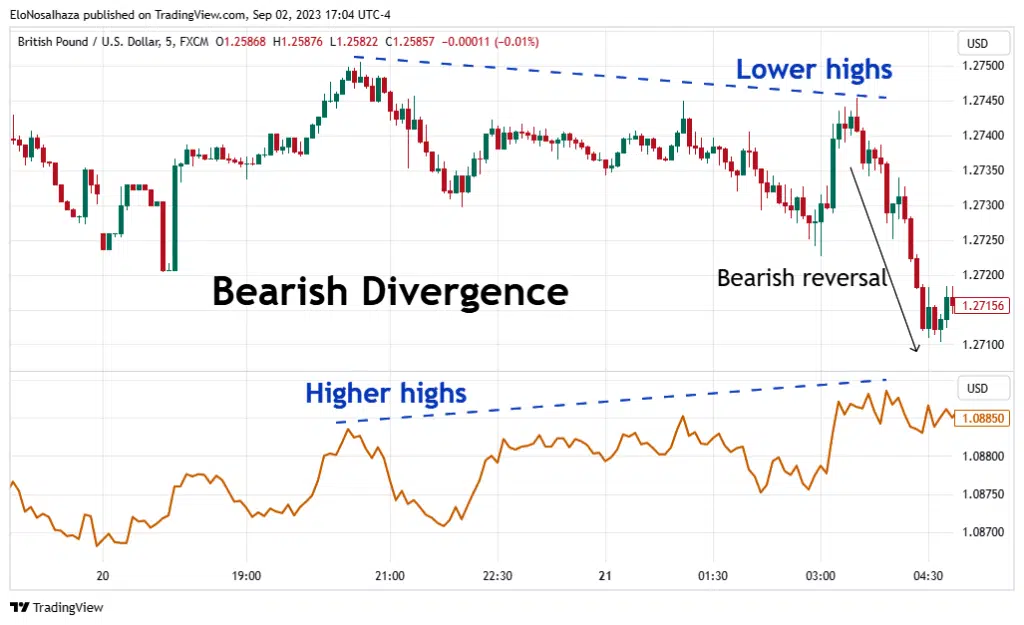
On the other hand, bearish divergence signals a momentum loss in bullish markets and subsequent reversals to a bearish one.
Both related entities may have made higher highs initially, but one loses the drive, forming noticeable lower highs later.
Many traders have recorded impressive results with these expectations. Thus, pros highly recommend it as a possible requirement for reversal trading.
That said, there are still “false” cases where prices never reversed after a divergence. Sometimes, prices may not immediately switch to the uptrend but consolidate for a prolonged period.
Hence, traders should always implement money and risk management strategies when using the concept for entries.
While divergence trading is powerful, it has clear limitations.
This is why many traders struggle with divergence. They either enter too early, misread the signal, or rely on indicators that are too slow or too noisy.
To trade divergence effectively, you need clarity, confirmation, and precise momentum analysis.
Many traders who’ve jumped on the ‘divergence train’ hardly regret it. More often than not, prices meet their expectations, which can be highly rewarding.
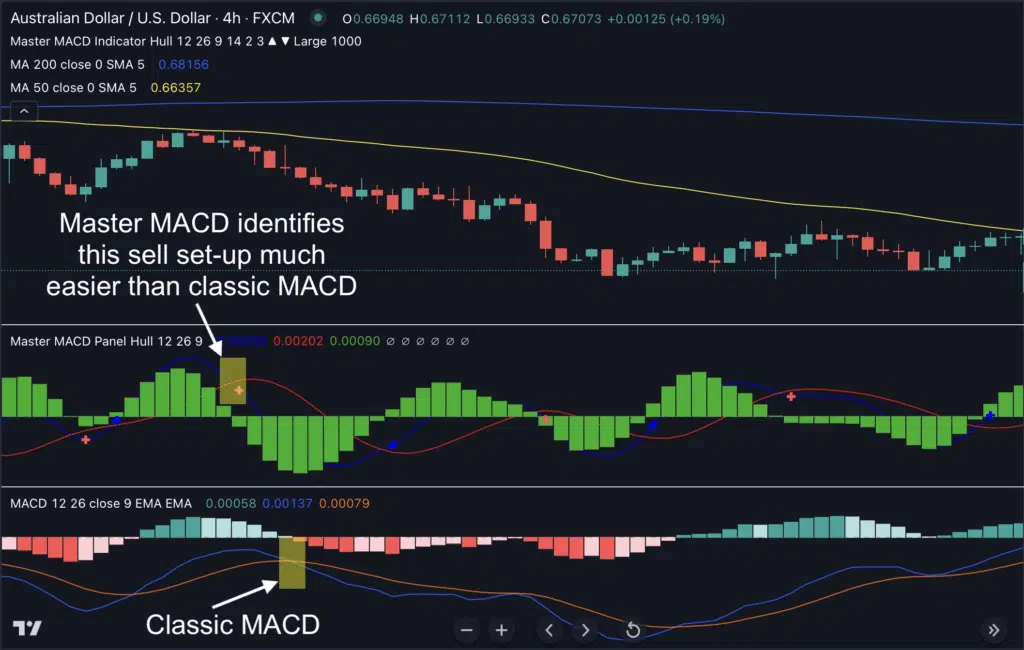
Fortunately, you can skip all the work and enjoy the concept with the Master MACD indicator for TradingView.
This powerful tool discloses potential reversals much faster than the classical MACD due to an adaptation of the Hull Moving Average. You’ll receive the buy or sell signal effortlessly and more accurately than your peers.
Below are some more advantages of the Master MACD:
Sounds too perfect? Try it for yourself today! You’ll be amazed by the results.
Divergence in trading occurs when there’s any inconsistency between closely related instruments or with an indicator. It signals a loss of momentum and possible trend reversal.
If you’re still struggling to understand the theory but want to exploit it, Indicator Vault’s Master MACD is highly recommended. It compares price action with a custom MACD indicator and presents trade opportunities without lifting a finger.
Please share this article with friends and trading colleagues to increase exposure to divergence and its benefits.
Also, leave a question or contribution in the engaging Comment Section below.