Trendlines are a basic yet effective tool that many traders utilize in their trading. It may be used in practically any strategy, including day trading, swing trading, and so on. Nevertheless, before you begin to level up your trading from it, you should first comprehend what it means. Let’s go through the fundamentals and have some fun!
Table of Contents
1. What is a trendline?
A trendline, as the names suggest, is a straight line that connects peaks and troughs to represent the current trend of market prices. Traders will gather this information as quickly as possible in order to make the best trading decisions.
Several individuals say this line are similar to support and resistance lines. The only difference is that the trend line is sloped rather than horizontal.
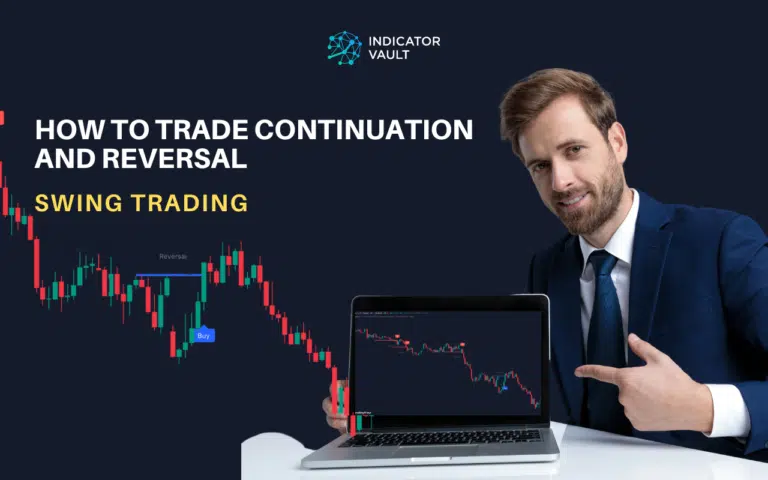
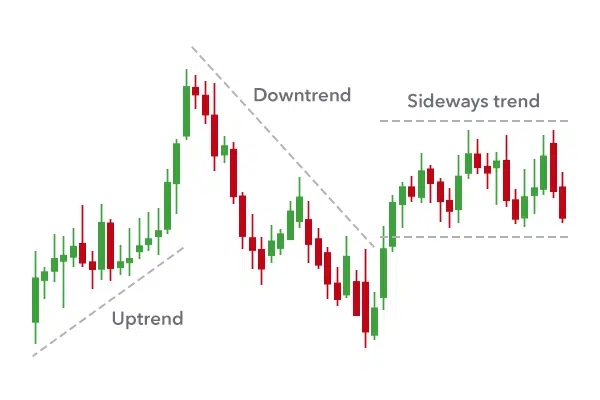
There are two main types of trendlines: uptrend and downtrend.
- Uptrend lines: These are diagonal lines drawn on a chart that connect two or more ascending lows. An uptrend line indicates that the price of the asset is trending upwards, and it can be used to identify potential buy signals.
- Downtrend lines: These are diagonal lines drawn on a chart that connect two or more descending highs. A downtrend line indicates that the price of the asset is trending downwards, and it can be used to identify potential sell signals.
- In addition to these two main types, traders may also use horizontal trendline, which are drawn at a specific price level and indicate a potential level of support or resistance.
2. Understanding trendlines
Trendlines are considered as one of the most useful tools by financial market technical analysts. Utilizing it allows users to identify the most recent price patterns in the market, which is the first step in a successful trade.
Sloping trendlines show the general direction of the market trend. There are the following two cases:
2.1 Trendline slopes up
A trendline that goes up shows that the asset is moving in an upward direction. That is, the number of currency pairs is growing, so traders are now more interested in investing. If this line goes up, it means that prices are moving steadily up. Also, it goes up quickly shows that the uptrend is getting stronger.
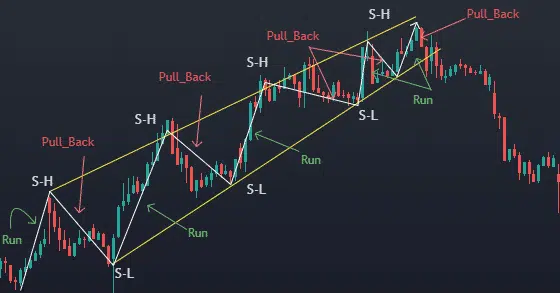
If the price breaks through the slope that goes up, it could mean that the trend is still going up, which could be a good time to buy. But if the price breaks through the trend line that goes up and then falls below it, it could mean that the uptrend is ending, which could be a good time to sell.
2.2 Trendline slopes down
In contrast to the above line that goes up, the trend of line that goes down shows that the overall trend of the asset is going down. That is, the pairs of currencies are slowly going down, making it harder to invest. If the downward sloping trendline is vertical, it could indicate that the downtrend is stabilizing. If the slope goes down quickly, it might mean that the downtrend is getting stronger.
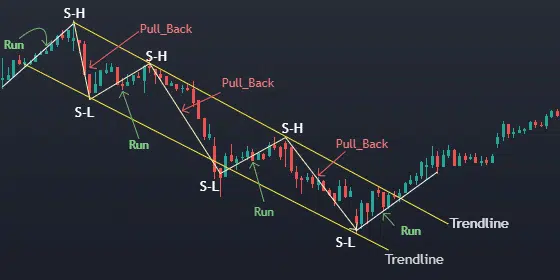
If the price breaks through a downward-sloping trendline and then rises above it, it could mean that prices are going down, which could be a good time to buy. But if the price breaks through the downward-sloping trendline and then falls below it, it could mean that the downtrend is still going on, which could be a good time to sell.
See more The Utility of The Trend of Lines
3. How to draw a trendline correctly
So the question is, “How do you draw it correctly?”
It’s easy. All you have to do is connect two or more price points on a chart.
However, you should not attempt to establish a trend line that matches to the market; doing so will simply lead to incorrect predictions.
In particular, for the uptrend line, you connect at least two ascending lows together and note that the previous bottom is lower than the second bottom. On the contrary, connecting at least two ascending lows you will get a downtrend line where the next peak is lower than the previous peak.
If the trendline is drawn correctly, it will produce the same outcomes as any other trading approach. Yet, it is important to note that drawing them precisely is extremely difficult; many traders attempt to construct trend lines that correspond to the market, but it is futile.
Don’t be concerned. I’ll show you a powerful indication that helps me overcome challenges in identifying patterns so that you may confidently master your game.
By utilizing the accurate trendline algorithm, Logic Trendline indicator for TradingView will do most of the heavy lifting for you.
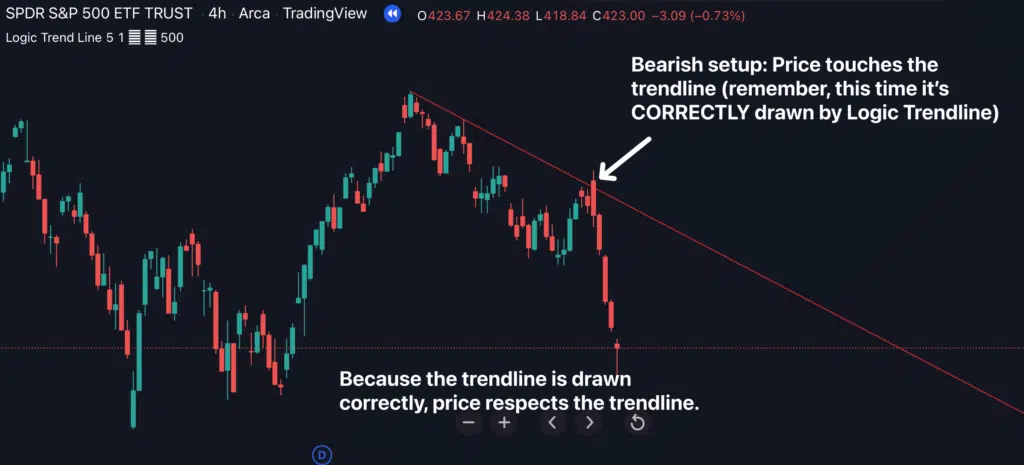
Here’s how it works:
Once you put the indicator on your chart, it automatically draws the trend of line that has a really good chance of working on your chart for you.
So you can be confident trading with that powerful line. You never feel lost and confused again.
4. Conclusion
Overall, trendline are a powerful tool in technical analysis and can help traders identify trends, potential levels of support and resistance, and potential trading opportunities.
However, it’s important to keep in mind that line are subjective and may vary depending on the trader’s interpretation of the market. To make informed trading decisions, it should be used in conjunction with other technical analysis tools to confirm potential signals.
If you’re looking for some knowledge-trading articles or an update on our newest indicators, you can find them here:
Feel free to leave a comment and share your thoughts with me. And don’t forget to share this blog with your friends on social media!