What is a bull flag? This guide explains how the pattern forms, how to confirm it properly, and how to trade it with precision. Learn expert techniques and discover how the Bull Bear Flag indicator improves accuracy in trending markets.
Table of Contents
If you’ve ever looked at a strong uptrend and wondered where to enter before the next big move, you’ve probably asked yourself: what is a bull flag and how can I trade it correctly?
This simple yet powerful chart pattern gives traders a high-probability way to catch continuation moves in trending markets.
In this post, we’ll break down what is a bull flag, how it forms, how to identify it on charts, and how to trade it efficiently. Plus, we’ll introduce a smart tool – the Bull Bear Flag indicator – that simplifies the entire process.
1. What is a bull flag pattern?
To fully understand what is a bull flag, you need to recognize that it is a bullish continuation chart pattern that appears when the market pauses briefly during an existing uptrend before continuing higher.
Imagine a strong rally, that’s the “flagpole.” Then, prices pull back slightly or move sideways, that’s the “flag.” Once the market breaks above this flag, traders see it as a signal that the uptrend is likely to continue.
In simple terms, when asking what is a bull flag, the answer is this: it represents a short consolidation phase after strong upward momentum, offering traders a strategic entry before the next leg higher begins.
The psychology behind the pattern
After a strong move higher, early buyers start taking profits, causing a small retracement. Meanwhile, new buyers wait for confirmation that the trend is still intact. This temporary pause creates a tight flag-shaped structure, and when momentum returns, the breakout above the flag often triggers another strong move upward.
2. What does a bull flag look like?
Now that we’ve answered what is a bull flag, let’s explore its structure visually.
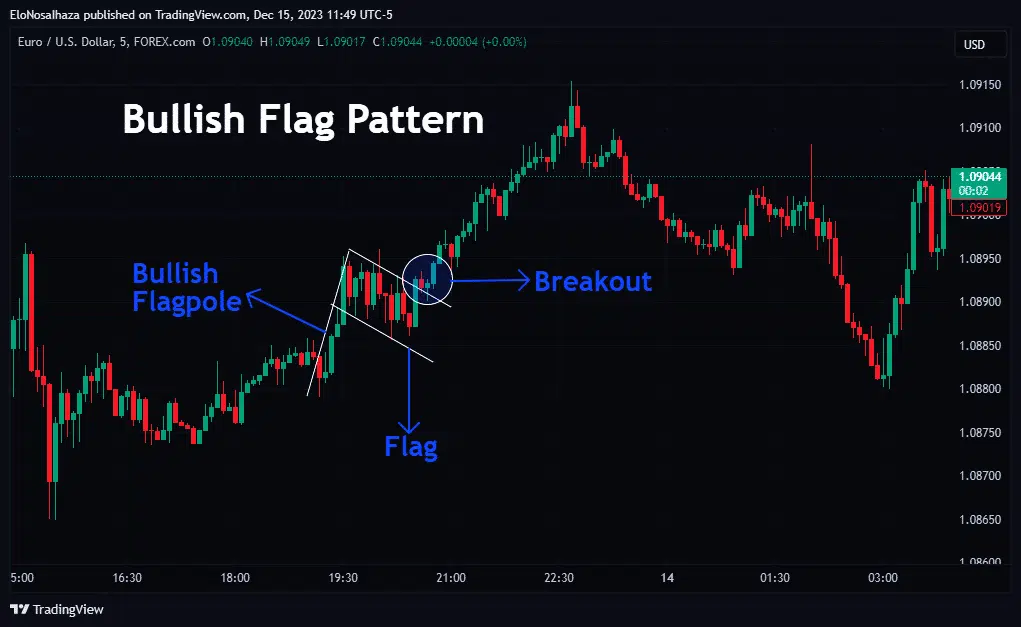
The bull flag resembles a flag flying on a pole, hence the name. It consists of two main parts:
- Flagpole: A sharp, nearly vertical price surge showing strong bullish momentum.
- Flag: A small, downward-sloping or sideways consolidation that follows the pole.
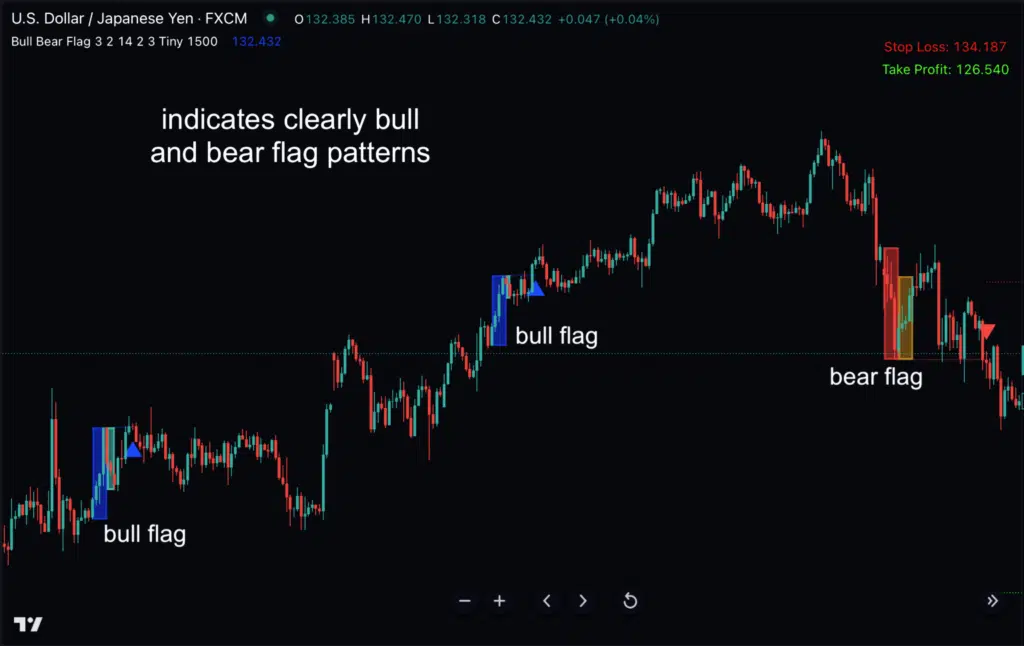
When price breaks above the flag’s upper boundary with increased volume or momentum, the bull flag pattern is considered “confirmed.”
Here’s how to visualize it:
On charts, bull flags can appear in any market (stocks, forex, crypto, or indices) and across all timeframes. The key lies in recognizing the structure, not the timeframe.
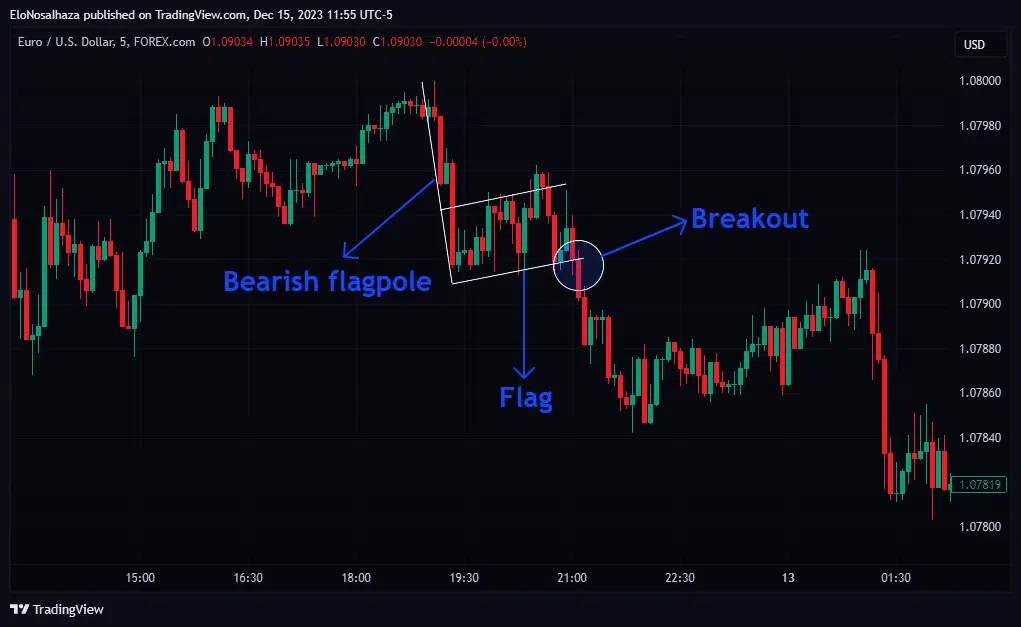
On the other hand, bearish-minded traders utilize bear flags, which are the opposite of bull ones. They indicate downtrend continuation moves after a down surge and minor retracement in price.
3. How to spot a bull flag pattern
If you truly understand what is a bull flag, the next step is identifying it correctly in real-time conditions.
Step 1: Look for a strong, impulsive move up
This is your flagpole. The initial move should stand out clearly, showing strong volume or momentum. A real bull flag doesn’t form after a weak or choppy move, it needs clear directional strength.
Step 2: Identify a small pullback or consolidation
After the surge, price tends to move slightly down or sideways in a tight range. This is the flag portion. The slope should ideally lean down or stay horizontal, never too steep or chaotic.
Step 3: Watch for breakout confirmation
The breakout occurs when price closes above the flag’s resistance line. Strong breakouts often come with increased volume or volatility, confirming that buyers are back in control.
Step 4: Measure the target
Many traders project the height of the flagpole from the breakout point to estimate a potential target. For instance, if the pole was 100 pips tall, they might expect another 100-pip rally after breakout.
4. Pro tips for spotting and trading this pattern
Even after understanding what is a bull flag, precision comes from execution.
Tip 1: Study the duration
The flag portion shouldn’t last too long, usually a few bars to a few days, depending on your timeframe. Long consolidations may weaken the pattern or indicate trend exhaustion.
As a rule of thumb, shorter, tighter consolidations often lead to more explosive breakouts.
Tip 2: Confirm market sentiment
Bull flags work best in strongly bullish markets. Before trading one, check whether the overall trend supports continued upside momentum. You can confirm this with moving averages or market structure analysis.
Avoid using bull flags in sideways or bearish environments, they often produce false signals there.
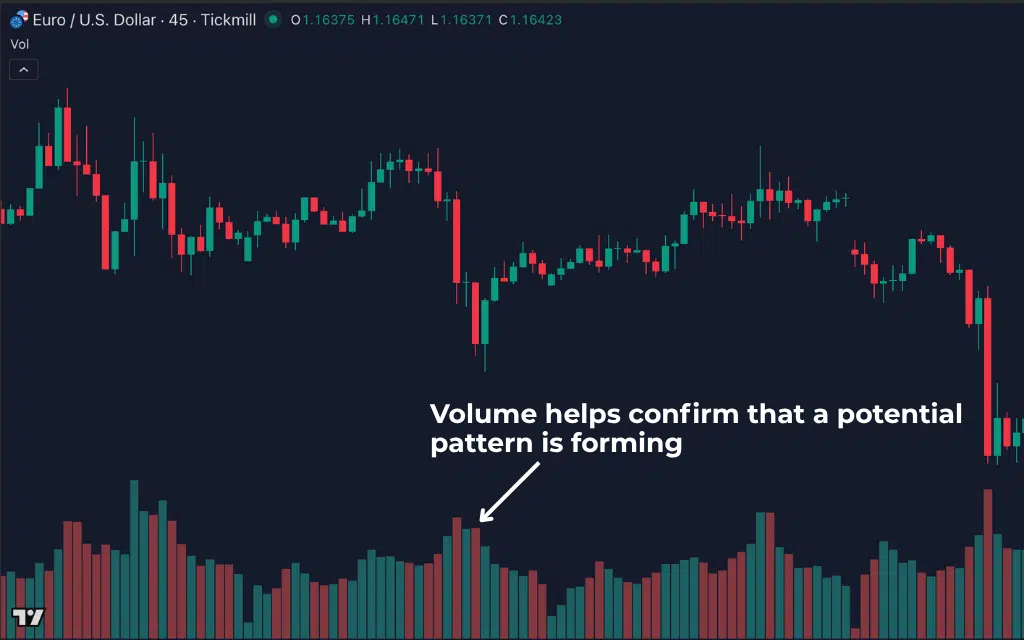
Tip 3: Combine with volume or volatility
Volume often contracts during the flag formation and expands again on breakout.
Similarly, you can use volatility indicators to detect compression before a breakout. This helps confirm that a “coiled spring” setup is forming.
Tip 4: Watch economic events
If you trade news-sensitive markets (like forex or stocks), major announcements can influence flag breakouts. A strong economic report could be the trigger that launches price out of consolidation.
Keep an eye on your economic calendar before committing to a setup.
Tip 5: Manage risk strictly
Even a textbook bull flag can fail, especially in volatile markets.
Define your stop-loss just below the flag’s lower boundary, and consider trailing stops to lock in profit after breakout.
Consistency in risk management matters more than being right every time.
5. Streamlining bull flag trading with the Bull Bear Flag indicator
Understanding what is a bull flag is one thing. Spotting it consistently across multiple charts is another.
The Bull Bear Flag indicator automatically detects bullish and bearish flag formations, helping you:
- Instantly spot real flag formations across markets and timeframes
- Avoid false breakouts by confirming valid structure and volume conditions
- Receive alerts for every high-probability continuation setup
- Trade both bullish and bearish flag formations effortlessly
The Bull Bear Flag indicator works by scanning the chart for specific price structures – a sharp impulsive leg followed by a controlled retracement, and highlights only those with strong continuation potential.
This saves hours of manual analysis while ensuring you never miss the cleanest setups.
If you’ve ever struggled with identifying trend continuation trades or got trapped by fake flags, this tool can dramatically improve your results.
Check out the Bull Bear Flag Indicator for TradingView and start spotting true flag setups with confidence.
6. Conclusion
So, what is a bull flag?
It is a bullish continuation chart pattern formed by a strong upward move followed by a brief consolidation before another breakout higher.
By understanding the structure, psychology, and confirmation rules behind what is a bull flag, traders can significantly improve their continuation trading strategy.
However, experts use the Bull Bear Flag indicator by Indicator Vault for much more accuracy.