Divergence is a common concept in trading market. Moreover, it is also very meaningful for investors who follow the school of technical analysis. As a result, it would be very interesting if you could use divergence trading to obtain high-probability trades. But first, let’s explore every nook and cranny of this concept!
Table of Contents
1. What is divergence?
Divergence is the conflict between the price of assets and indicators (usually momentum indicators). It occurs when the price and the technical indicator move in opposite directions.
This divergence is also a sign of potential weakness in the market. In other words, when it happens, the trend will shortly reverse or there will be a retracement chance.
2. Two common divergences
There are two popular types of divergence:
- Regular divergence: used to detect trend reversals
- Hidden divergence: used to detect trend continuation
Each type of divergence mentioned above will be divided into two subtypes including: a bullish bias and a bearish bias.
2.1. Regular bullish divergence
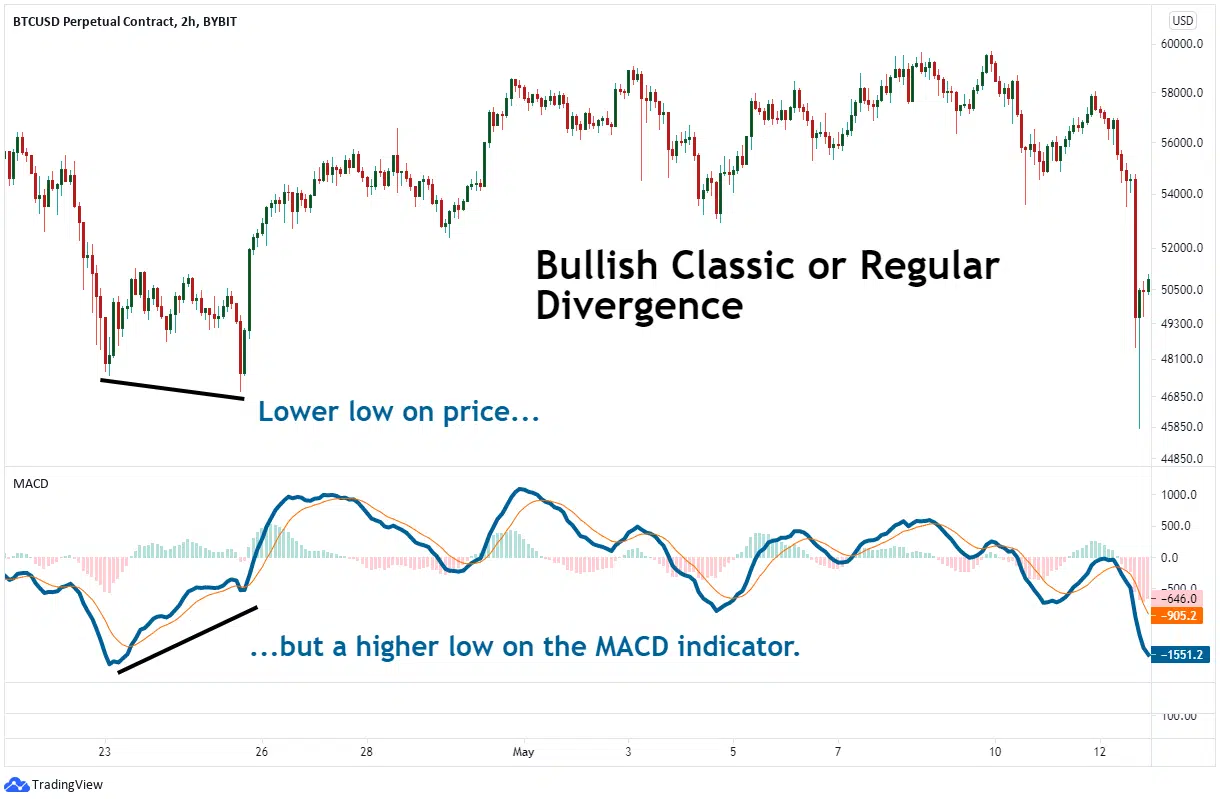
This type appears in a downtrend. Specifically when the price is making lower lows but the indicator is showing higher lows on the contrary.
Its meaning is that bears are exhausted. It is also a signal for a trend change; the market will soon shift from a downtrend to an uptrend. In this case, traders should prepare for buying.
2.2 Regular bearish divergence
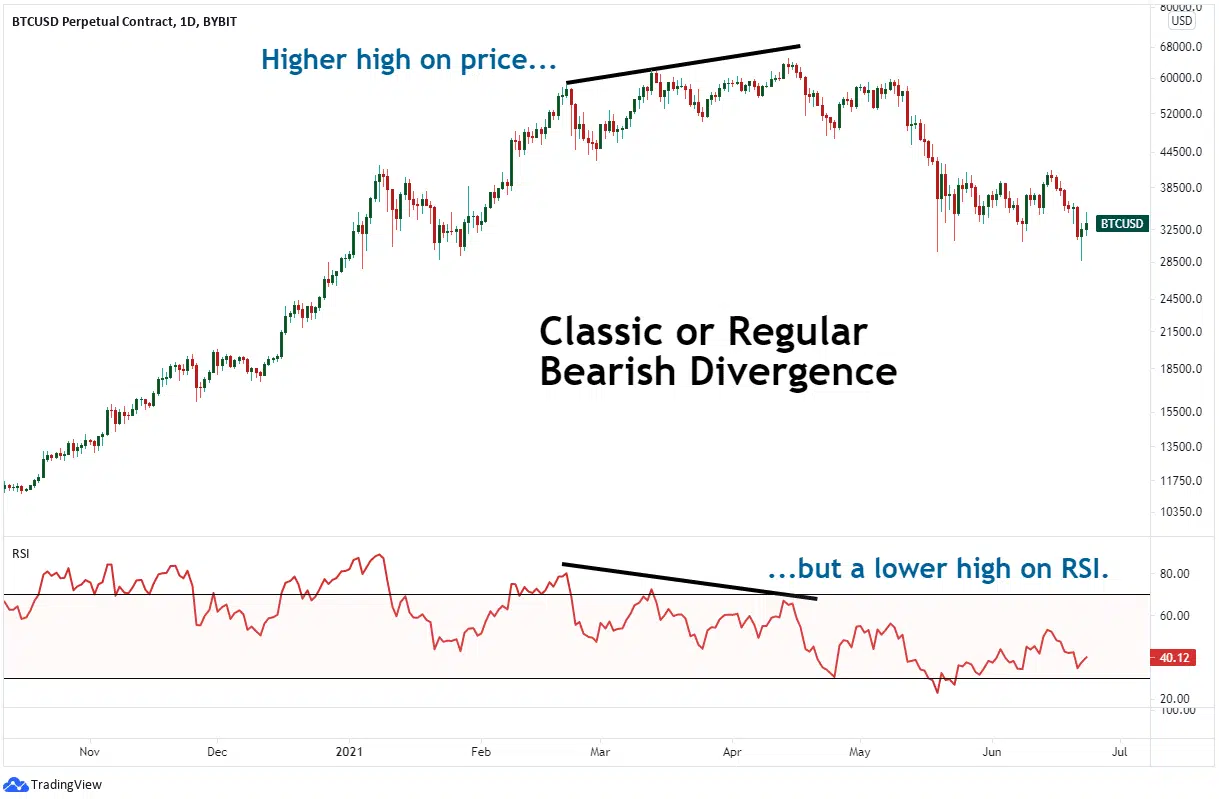
Two conditions are required for a regular bearish divergence to occur: the price chart is showing a high while the indicator is showing a lower high.
It signals that the market will trend from an uptrend to a downtrend. This is a good opportunity for forex traders to enter a sell trade.
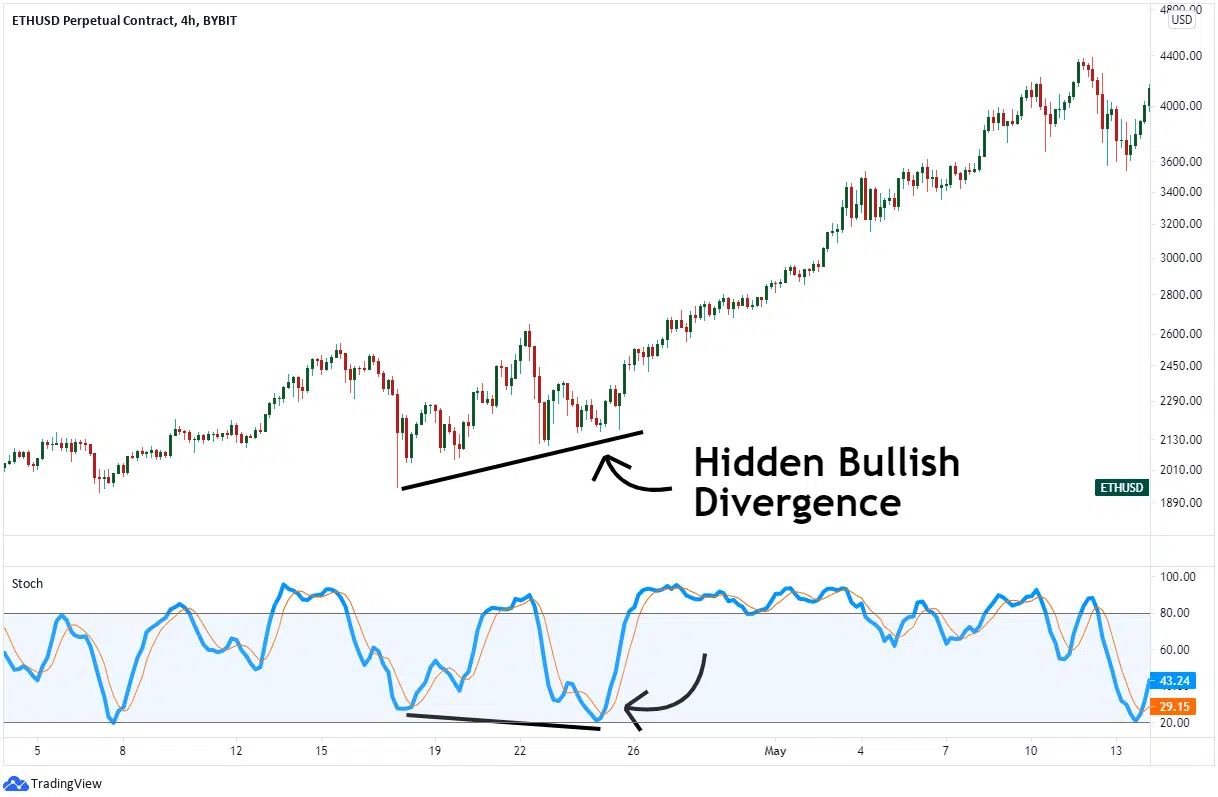
2.3 Hidden bullish divergence
The price makes a higher low but the indicator makes a lower low. The hidden bullish divergence happens at this point.
In this case, the price chart will continue its upward movement.; that is, the trader needs to get ready to buy.
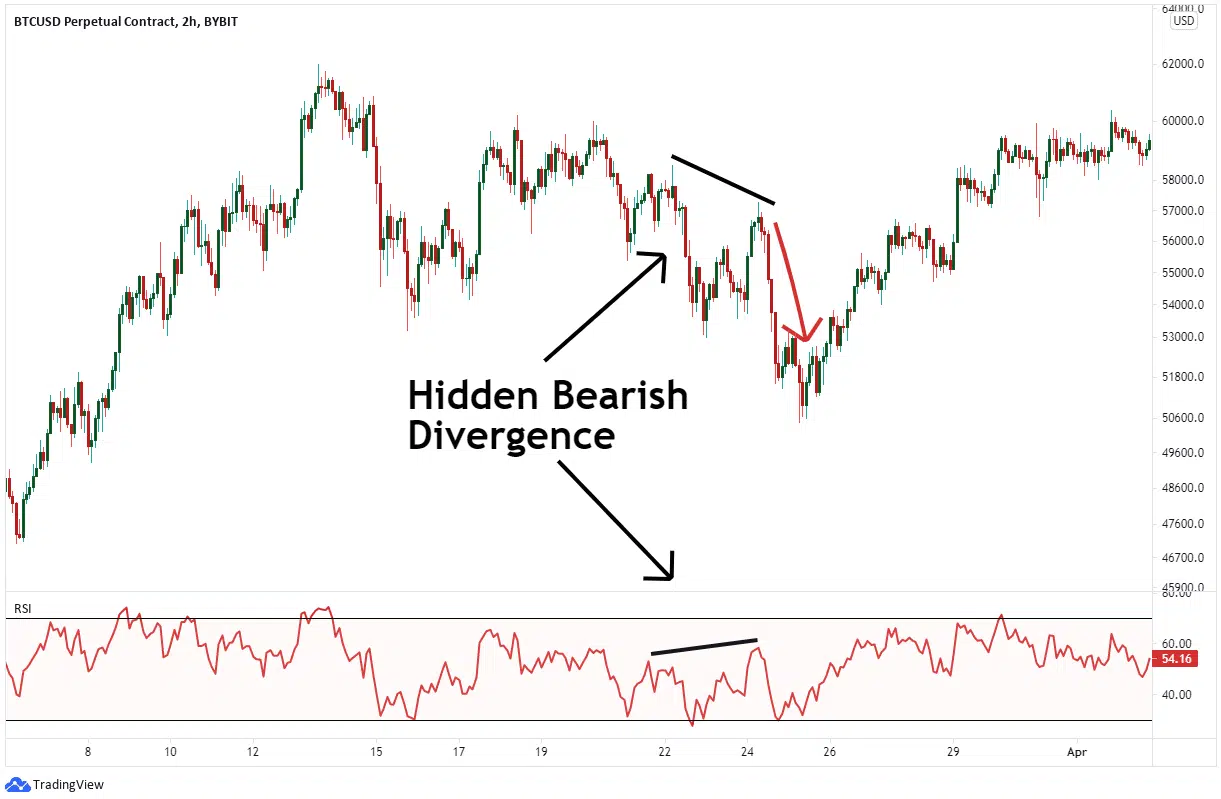
2.4 Hidden bearish divergence
This scenario emerges only when the price makes a lower high but otherwise the indicator makes a higher high.
Thanks to that, we can expect the downtrend to continue in the future. Moreover, this kind gives a clear signal to open a sell position.
3. Four notes for divergence trading
Before you head out there and start looking for potential divergence trading, here are 4 notes you should know about this concept.
3.1 Have knowledge of divergences
In a nutshell what you need to remember is: for divergences to exist, one of the following four things must be formed:
- Higher high than the previous high
- Lower low than the previous low
- Double bottom
- Double top
In addition, with 4 above types of divergences, that’s quite a lot to remember, isn’t it?
But to avoid common mistakes, the important thing I think you have to do is distinguish these types, recognize when they appear.
- Tips:
To avoid confusing the 4 types, you can divide them into 2 types: bullish and bearish divergence.
In a bearish pattern, you use the top of the price and the top of the indicator to determine if it is a regular divergence or a hidden period.
In contrast to the bullish pattern, you could use the bottom of the price and the bottom of the indicator to identify a regular or a hidden divergence.
3.2 Do not put 100% trust
When divergence occurs, it does not imply that the price will reverse immediately or that a reversal will appear soon.
On the other hand, divergence can linger for a long period, so if you only act on this one sign, it is easy to bring unexpected trading results.
3.3 Don't trade in a hurry
Most traders simply enter the trade as soon as they see a divergence in the market without thinking for another moment. That is a bad idea!
Because not all of those signals are really helpful. What you need to do next is eliminate false signals and find high-probability trade setups.
The advice is that you should not rush to trade right away. Take your time to observe more or wait for a brief pullback in price before entering.
3.4 Combined with other indicators
Not only with divergence, traders should use a combination of different indicators and analysis techniques in any of their analysis.
You can use price patterns, candlestick patterns and support and resistance zones in conjunction with divergence on multiple timeframes to increase your probability of winning each entry.
4. The best indicator for divergence trading
Before I introduce you to my favorite indicator for divergence trading, I want to make sure you’re familiar with a few others.
The first indicator I have to mention is RSI (Relative Strength Index). RSI is an oscillating indicator, we often know it for the main role of identifying overbought and oversold conditions of an asset. On the other hand, RSI is the most popular indicator in divergence trading because of its simplicity and observability.
The second is that MACD stands for Moving Average Convergence Divergence. It is composed of two moving averages (EMA) and a column histogram (MACD Histogram). In detail, the two EMAs include the fast EMA and the slow EMA. The MACD represents the difference of these two EMAs in the form of a histogram. MACD is considered a pretty quality indicator for investors interested in divergences.
Divergence Solution by Indicator Vault
This is one of my favorite indicators in divergence trading. It simplifies everything, even the four notes in part 3.
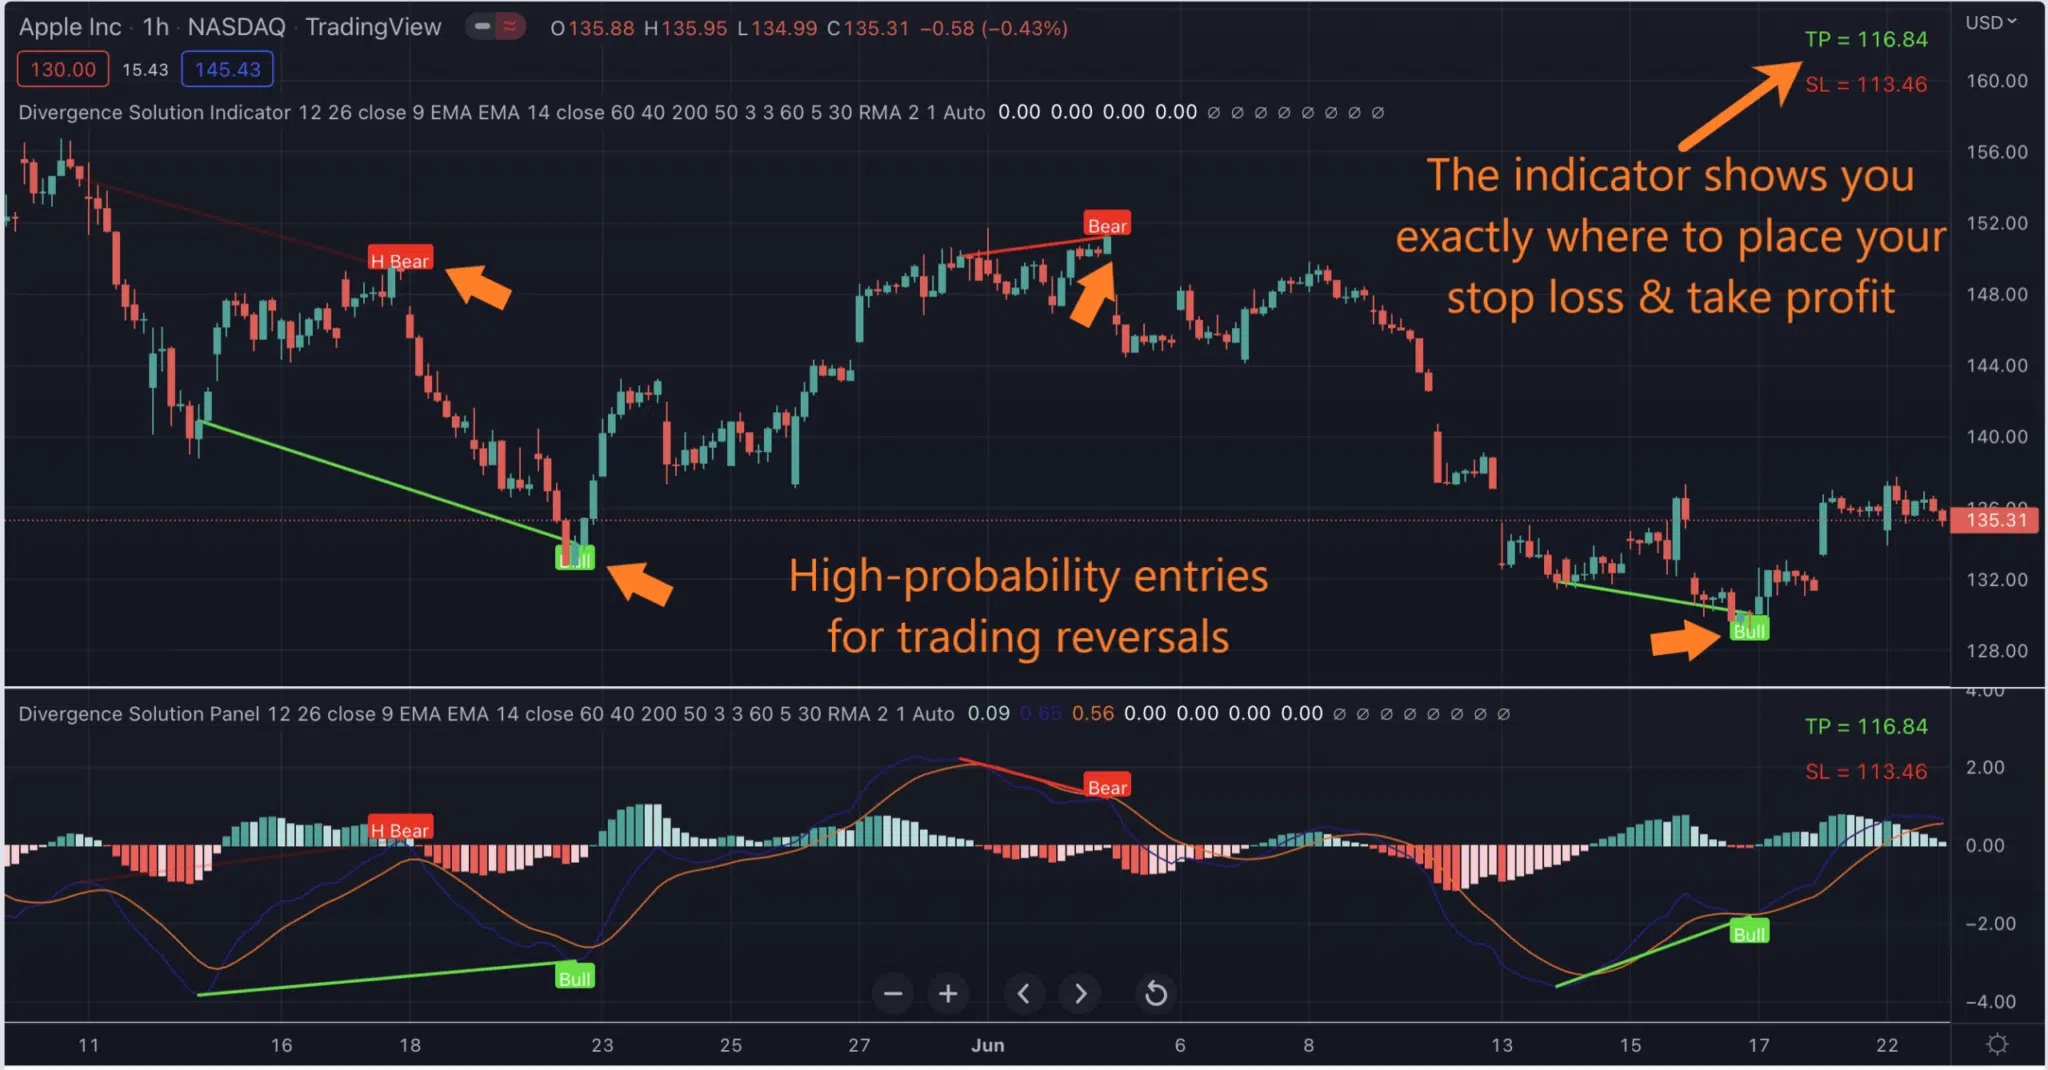
Here’s just a taste of what it can do for you:
- It detects all possible reversal trade setups based on divergence.
- Uses our patent-pending triple confirmation algorithm to rank these trade setups by winning probability.
- Eliminates most (if not all) false signals and shows you only the very best trade entries that have the highest probability of winning.
That alone is attractive enough, isn’t it?
But that’s not all. There are some powerful features about this indicator waiting for you to discover it here
Remember that: Just with the default settings for stop loss and take profit always ensure that the reward:risk ratio of each trade is 3:1.
5. The bottom line
It can be said that divergence is an important signal in trend trading and is trusted by many people. However, as I mentioned, you should use it in combination with some technical analysis as well as other powerful tools to add further probability of success in your trading. The tip is that you can try our indicator – Divergence Solution – which helps you best handle divergences, increasing your chances of setting up a divergence trading leading to a profitable trade.
If you’re looking for some knowledge-trading articles or an update on our newest indicators, the following channels will be helpful:
What do you think? Do you have any suggestions for using divergence trading?
Comment below to share your idea!
Find this article useful? Share this blog with your friends on social media!