Learn how to use each technical indicator effectively, understanding leading indicators vs lagging indicators, and master tools like Moving Average, RSI, MACD for bettering trading decisions.
1. Introduction
Table of Contents
Most traders use at least one technical indicator on their charts.
Whether it’s a Moving Average, RSI, or MACD, these tools are everywhere. But here’s the problem, many traders use them without fully understanding how they work or when they should be used.
This often leads to confusion, late entries, and conflicting signals.
If you want to trade more effectively, you need to go beyond simply adding indicators to your chart. You need to understand what they actually do, when they work best, and when they don’t.
2. What is a technical indicator?
A technical indicator is a mathematical calculation based on price, volume, or market activity that helps traders analyze market psychology. Instead of predicting the future, a technical indicator helps you interpret what the market is doing right now.
For example, a Moving Average smooths price data to reveal trends, while RSI and MACD measure momentum and potential reversals.
Each indicator has a specific purpose, and understanding that purpose is the first step to using it correctly.

3. Two categories of technical indicators
All indicators can generally be divided into two groups: leading indicators and lagging indicators.
3.1. Leading indicators
Leading indicators aim to signal potential price movements before they happen.
Tools like RSI are often considered leading indicators because they can show overbought or oversold conditions before a reversal occurs.
However, while they can provide early signals, they also come with a higher risk of false signals.

3.2. Lagging indicators
Lagging indicators confirm trends after they have already started.
A classic example is the Moving Average, which follows price and helps identify the direction of the trend.
While lagging indicators are more reliable in confirming trends, they often provide signals later than leading indicators.

4. Four types of technical indicators
Beyond categories, indicators can also be grouped by what they measure.
4.1. Trend following
Trend-following indicators help traders identify the direction of the market.
The Moving Average is one of the most widely used tools for this purpose. It smooths out price data and makes trends easier to see.

4.2. Momentum
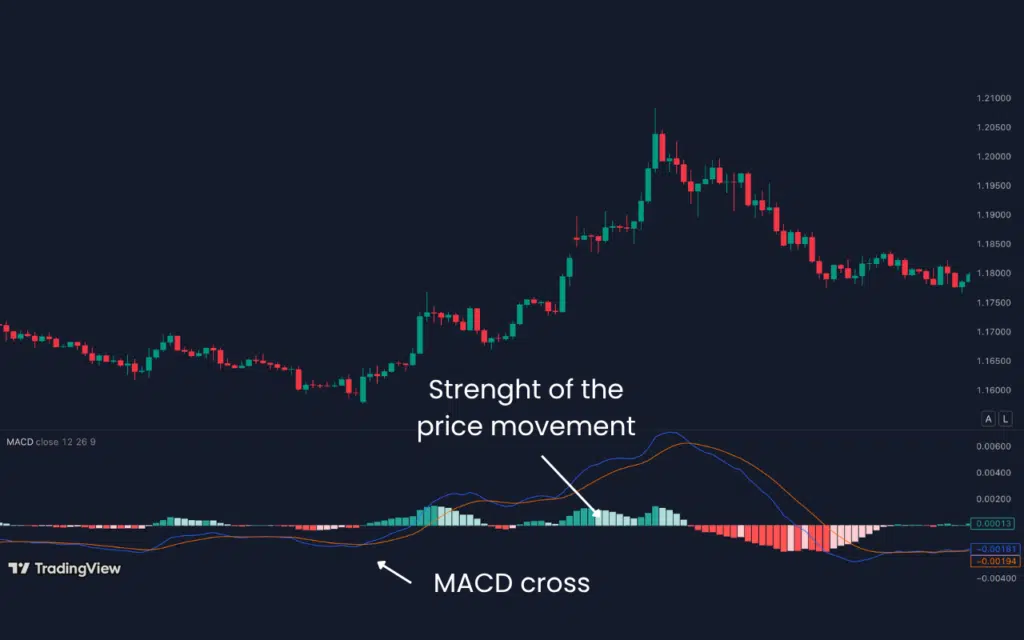
Momentum indicators measure the speed and strengths of price movements.
RSI and MACD are two popular examples. They help traders understand whether a trend is gaining strength or losing momentum.
4.3. Volatility
Volatility indicators show how much the price is moving. They help traders understand whether the market is calm or experiencing strong movement, which is important for timing entries and exits.

4.4. Volume
Volume indicators focus on trading activity. They provide insight into how strong a move is by analyzing how much buying or selling is behind it.

5. Why use technical indicators?
Technical indicators are widely used in trading because they help turn raw price action into clearer, more structured decisions. Instead of relying only on instinct, traders use indicators to identify trend direction, spot possible entry and exit points, manage risk through stop-loss and take-profit planning, and confirm whether a signal is strong enough to act on.
They can also save time by making charts easier to read and reducing emotional decision-making during fast-moving markets. That said, indicators work best as part of a broader trading plan, not as standalone guarantees, and they tend to be more effective when matched to the right market conditions and combined thoughtfully rather than overcrowding the chart.
- To identify the market trend
Technical indicators help traders understand whether the market is moving up, moving down, or staying sideways. This gives them a clearer view of the overall market direction before making a trade. - To find entry and exit points
Indicators can help traders spot possible buy and sell opportunities based on current market conditions. This makes it easier to decide when to enter a trade and when to close it. - To manage risk better
Traders also use technical indicators to estimate where stop-loss and take-profit levels should be placed. These levels are often based on previous price behavior, which helps traders control risk more effectively. - To confirm trade signals
A single signal is not always enough. Technical indicators can be used to confirm other trade ideas and reduce false positives, helping traders make decisions with more confidence.
6. 4 Crucial questions about technical indicators you should ask before trading
6.1. What do you want to use the indicator for?
As with other activities, the choice of tool or equipment is dictated by what you want to perform with it. You don’t use a wide camera lens to take pictures or a bread knife to slice steak, do you?
If you wish to track patterns, then moving averages can be the ideal alternative. If you like spotting market tops and bottoms, oscillators such as Stochastic or RSI may be your best choice.
If you’re scratching your head and wondering what’s going on, return to our School of Pipsology and brush up on momentum indicators and oscillators.

6.2. Do you know how the indicator works?
Next, in order to properly analyze the signals generated by the technical indicator, you need to understand how it is calculated.
To comprehend the output, you don’t need to remember the complicated formulae, but it helps to know what sort of data is fed into them (for example, the average of the past X closing prices or the ratio of highs to lows in the preceding X bars).
6.3. When does the indicator fail?

Understanding how the technical indicator operates is insufficient. Awareness of potential failure points is also helpful.
Since there is no sign that guarantees success 100% of the time, you need to be aware of situations in the market when it may not perform as well as you’d hoped.
If you blindly follow crossovers, for instance, you might get caught up in turbulent price movement since moving averages don’t generate trustworthy indicators in range bound situations.
If you depend on leading indicators with the improper settings, you may be fooled by oscillators that predict reversals too early.
Now for the last inquiry…
6.4. What settings should you use?
Assuming you’ve already determined the indicators to utilize your approach, it’s time to choose the appropriate settings.
Remember that shorter/lower settings result in more sensitive indicators that create more signals. Longer/higher settings, on the other hand, produce fewer signals and have a latency. Where is the ideal setting between this whole range of sensitive and often faulty signals on one end and trailing but more reliable ones on the other?
Some argue that the default settings are often the best since they are what most market observers use anyhow. This essentially implies that they have a self-fulfilling impact.
However, if you prefer settings that can integrate the most recent market circumstances or have a solid track record with other indicators, backtesting may be the solution.
In Indicator Vault, we have everything you need. With the mission to assist you in bettering your chart analysis and trading abilities, we have developed many indicators to help you trade more pleasant, stress-free (and hopefully profitable)
Get Instant Access To The ENTIRE Collection Of ALL Of Our Top-Rated Custom Indicators for Tradingview
Trust me. It will be worth it.
7. The bottom line
A technical indicator is not a magic solution.
Tools like Moving Average, RSI, and MACD can provide valuable insights, but only when used correctly.
By understanding the difference between leading indicators and lagging indicators, and by asking the right questions before trading, you can turn indicators from confusing signals into powerful decision-making tools.
In the end, success does not come from using more indicators, but from using them with clarity and purpose.
We’ve also put up the articles 3 Popular Forex Trading Strategies To Trade More Profitably and 3 Easy And Profitable Trading Strategies For Beginners to help you out a little. Check it out now!