One of the most expensive mistakes a trader can make is misidentifying market direction. You enter a trade thinking it’s a buy-the-dip opportunity, only to realize you’ve caught a falling knife. On the flip side, you might exit a winning position in a panic, only to watch the market resume its original trend without you.
Understanding the distinction between retracement vs reversal is the secret to staying on the right side of the market.
Table of Contents
1. What is a Retracement?
A retracement, often called a pullback, is a temporary, short-term counter-move against the prevailing trend. Think of it as a healthy cool-off period. Even the strongest trends don’t move in a straight line; they breathe.
- Duration: Short-term (typically lasting a few bars or days).
- Magnitude: Usually shallow, often respecting Fibonacci levels like 38.2% or 50%.
- Market Sentiment: Driven by short-term profit-taking. The underlying trend remains intact.
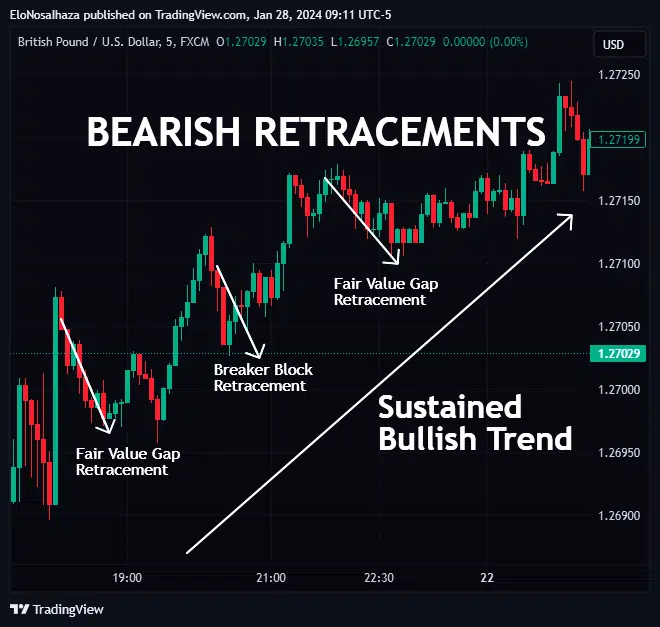
1.1 Bullish Retracement
A bullish retracement occurs during an uptrend. After a strong move upward, the price temporarily drops as traders take profits, but the overall market sentiment remains positive.
- Primary Trend: Moving Up (Higher Highs).
- The Retracement: A short-term drop or “dip” in price.
- The Opportunity: Traders look to “buy the dip” at key support levels, expecting the price to bounce and continue making new highs.
- Key Signal: Price stays above the previous swing low and often bounces off a Fibonacci 50% or 61.8% level.
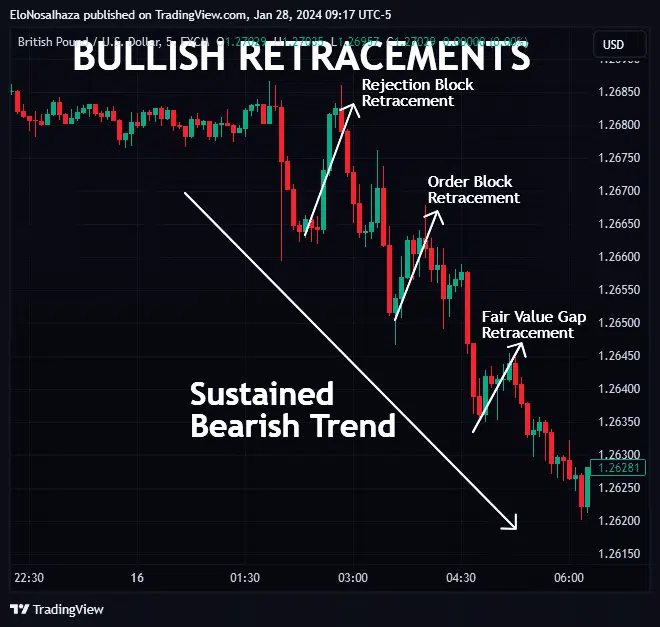
1.2. Bearish Retracement
A bearish retracement occurs during a downtrend. After a sharp drop, the price temporarily bounces upward. This isn’t a recovery; it’s simply a relief rally before the sellers take control again.
- Primary Trend: Moving Down (Lower Lows).
- The Retracement: A short-term rise or bounce in price.
- The Opportunity: Traders look to sell the rally or short the bounce at key resistance levels, expecting the price to turn back down.
- Key Signal: Price fails to break the previous swing high and often gets rejected at a descending trendline or supply zone.
2. What is a Reversal?
A reversal is a fundamental change in the dominant market force. It marks the end of the current trend and the beginning of a new one in the opposite direction.
- Duration: Long-term and sustained.
- Magnitude: Deep and significant, often breaking major swing lows or highs.
- Market Sentiment: Driven by institutional shifts and fundamental changes in supply and demand.
2.1 . Bullish Reversal
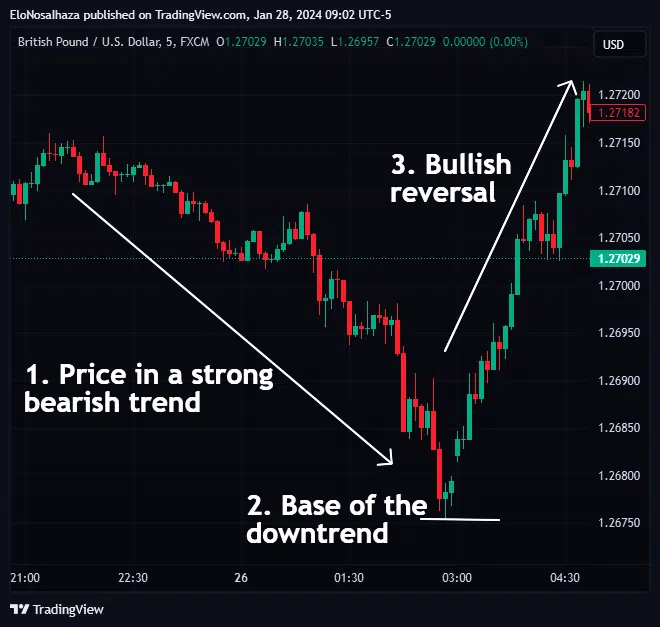
A bullish reversal occurs at the end of a downtrend. It indicates that the sellers have lost control and the buyers are starting to push the price back up.
- Market Context: The market has been making lower highs and lower lows.
- The Shift: Price hits a floor (support) and fails to make a new low.
- Key Patterns: Look for Double Bottoms, Inverted Head and Shoulders, or Bullish Engulfing candles.
- Result: The trend flips from down to up.
2.2 Bearish Reversal
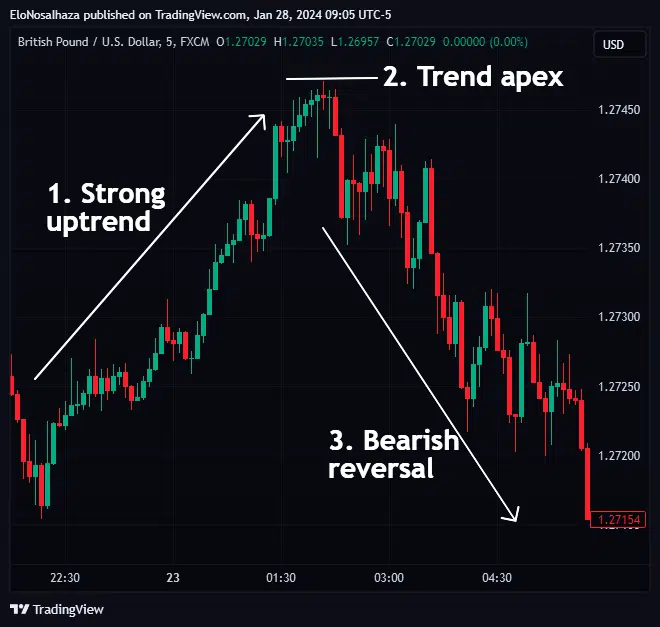
A bearish reversal occurs at the peak of an uptrend. It signals that the buying exhaustion has set in and the sellers are beginning to take over.
- Market Context: The market has been making higher highs and higher lows.
- The Shift: Price hits a ceiling (resistance) and fails to break higher.
- Key Patterns: Look for Double Tops, Head and Shoulders, or Shooting Star candlesticks.
- Result: The trend flips from up to down.
3. Retracement vs. Reversal: Key Differences at a Glance
To help you quickly distinguish between a temporary dip and a total trend shift, here is a comparative breakdown of the core technical signals:
| Feature | Retracement (Pullback) | Reversal (Trend Change) |
|---|---|---|
|
Price Action |
Minor counter-move; trend stays intact |
Major shift; trend direction flips |
|
Volume |
Typically decreases on the pullback |
Surges as the new trend gains momentum |
|
Chart Patterns
|
Candles show long wicks (rejection) |
Double Tops, Head & Shoulders, or breaks in structure
|
|
Technical Levels |
Price bounces off Moving Averages (50/200 MA) |
Price decisively breaks through major S/R levels |
3.1. Trend Continuity vs. Trend Flip
The primary difference lies in the intent of the market.
- Retracement: This is a temporary counter-move within an existing trend. The market structure remains intact; in an uptrend, the price continues to make Higher Highs and Higher Lows. It is essentially the market “taking a breath” or traders taking short-term profits before the primary move resumes.
- Reversal: This is a fundamental change in the dominant direction. The trend is officially flipped when the sequence of highs and lows is broken. For example, an uptrend ends when the price creates a Lower High followed by a Lower Low, signaling that the bears have seized control.

3.2. Volume Behavior
Volume is the fuel of the market and often reveals the smart money’s next move.
- Retracement: During a pullback, volume typically decreases. This suggests that there is no massive conviction behind the counter-move; it is simply a lack of active buyers at that moment rather than an aggressive influx of sellers.
- Reversal: You will often see a sudden surge in volume moving against the original trend. This high-volume spike indicates that institutional players are aggressively entering new positions in the opposite direction. If the price drops on high volume, it is a warning sign that the big money is exiting.

3.3. Price Action and Candlestick Patterns
The shape of the candles tells a story of rejection versus acceptance.
- Retracement: These are often characterized by long-wick candles (like Pin Bars or Hammers) that show a quick rejection of lower prices. You will frequently see these rejections occur at key Fibonacci retracement levels (like the 0.5 or 0.618 levels), indicating that buyers are waiting to buy the dip.

Reversal: These are marked by larger, structural patterns that take time to form. Look for Double Tops/Bottoms, Head and Shoulders, or Rising/Falling Wedges. A reversal is confirmed by a decisive close beyond a previous major swing point, signaling a “break of structure.”

3.4. Technical Support and Resistance
Indicators like Moving Averages (MA) act as a floor or ceiling for the trend.
- Retracement: Price tends to treat dynamic levels (like the 20-EMA, 50-SMA, or 200-SMA) as support. If the price touches a moving average and bounces, the trend is still healthy. The retracement is seen as a low-risk entry point within that “supportive” framework.
- Reversal: A true reversal is characterized by an aggressive breach of these major levels. When the price slices through the 50 or 200-period MA with high momentum and stays below it, the “dynamic floor” has collapsed. This indicates that the trend’s gravity has shifted and a new direction is likely beginning.
4. How to spot a true reversal before it happens
To avoid being trapped, professional traders look for specific signals that a retracement is actually a reversal:
- Momentum Divergence: If price makes a new high but your MACD or RSI makes a lower high, the trend is losing steam.
- Volume Spikes: A massive surge in volume moving against the primary trend is a red flag that institutions are exiting.
- Break of Structure: In an uptrend, a reversal is often confirmed when price fails to make a higher high and instead breaks below the previous swing low.

5. Tools To Master Market Timing
Manually analyzing every tick can lead to analysis paralysis. That’s why many traders use specialized tools to automate the process
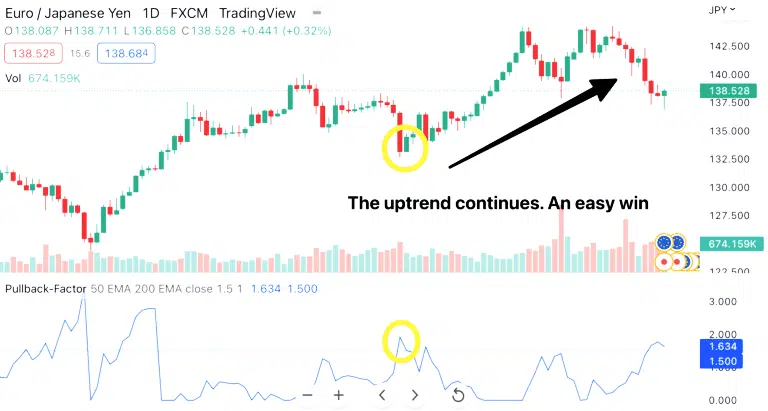
Trendlines, MAs, and the Fibonacci tool have proven considerably efficient. However, the Pullback Factor for TradingView is miles ahead of every strategy.
It is a volatility-based technical tool that recognizes and signals pullbacks from beginning to end. This grants users the opportunity to partake in the continuation move stress-free.
Succinctly, here are some perks the indicator offers over other techniques:
- Assurance of high-probability setups during pullbacks
- Early awareness of fake retracements and potential reversals
- Ability to explore several markets, including stocks, indices, and futures
- Quickest trade entry and exits, thanks to timely alerts within and outside TradingView
Confirm these and many more benefits by clicking here.
6. Conclusion:
In the debate of retracement vs reversal, your job isn’t to guess, it’s to confirm. By waiting for technical alignment and using the right indicators, you can trade pullbacks with confidence and exit reversals with your profits intact.
Similarly, pullback traders employ several recommended techniques to leverage retracements, like installing the Pullback Factor for TradingView.
Please share this article with friends, colleagues, and any ambitious retail trader. Also, remember to leave feedback in the ever-engaging Comment Section.