Understanding the MACD strategy can significantly improve how you read market momentum and identify high-probability trade setups.
In this guide, you’ll learn what the MACD is, how bullish and bearish signals work, and how to apply divergence and trend-following techniques in a structured trading strategy.
Table of Contents
1. What is the MACD in trading?
The MACD is a momentum oscillator that tracks the relationship between two moving averages of an asset’s price. It acts as a trend-following heartbeat, showing traders whether the current momentum is accelerating or fading.
Unlike simple moving averages, the MACD provides a faster look at price changes, making it more aligned with how active markets move. Because it measures the distance between averages, it highlights convergence (slowing momentum) and divergence (increasing momentum) before they are obvious on the price chart.
2. Types of MACD Signals in Trading
To master a MACD strategy, you must distinguish between bullish and bearish momentum shifts to apply the concept correctly.
2.1 Bullish MACD Signal
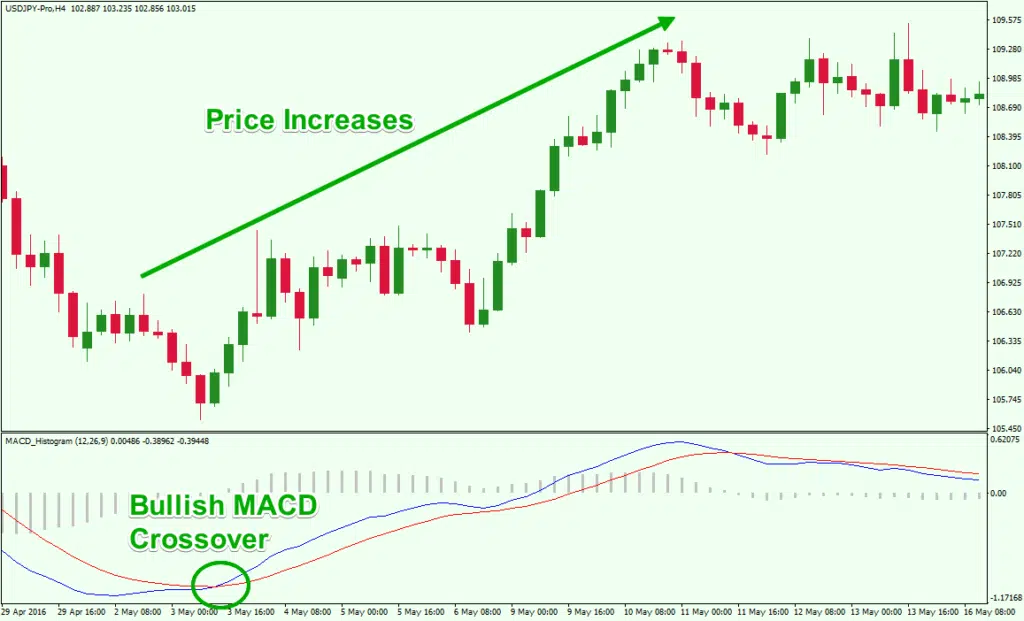
A bullish signal forms when the MACD line crosses above the signal line, typically below the zero level. This indicates that buying pressure is accelerating and a new uptrend may be starting.
Traders use this for trend trading entries, looking for price to move upward as the histogram bars grow taller above the zero line. This is often the “accumulation” phase where smart money begins to push prices higher.
2.2 Bearish MACD Signal

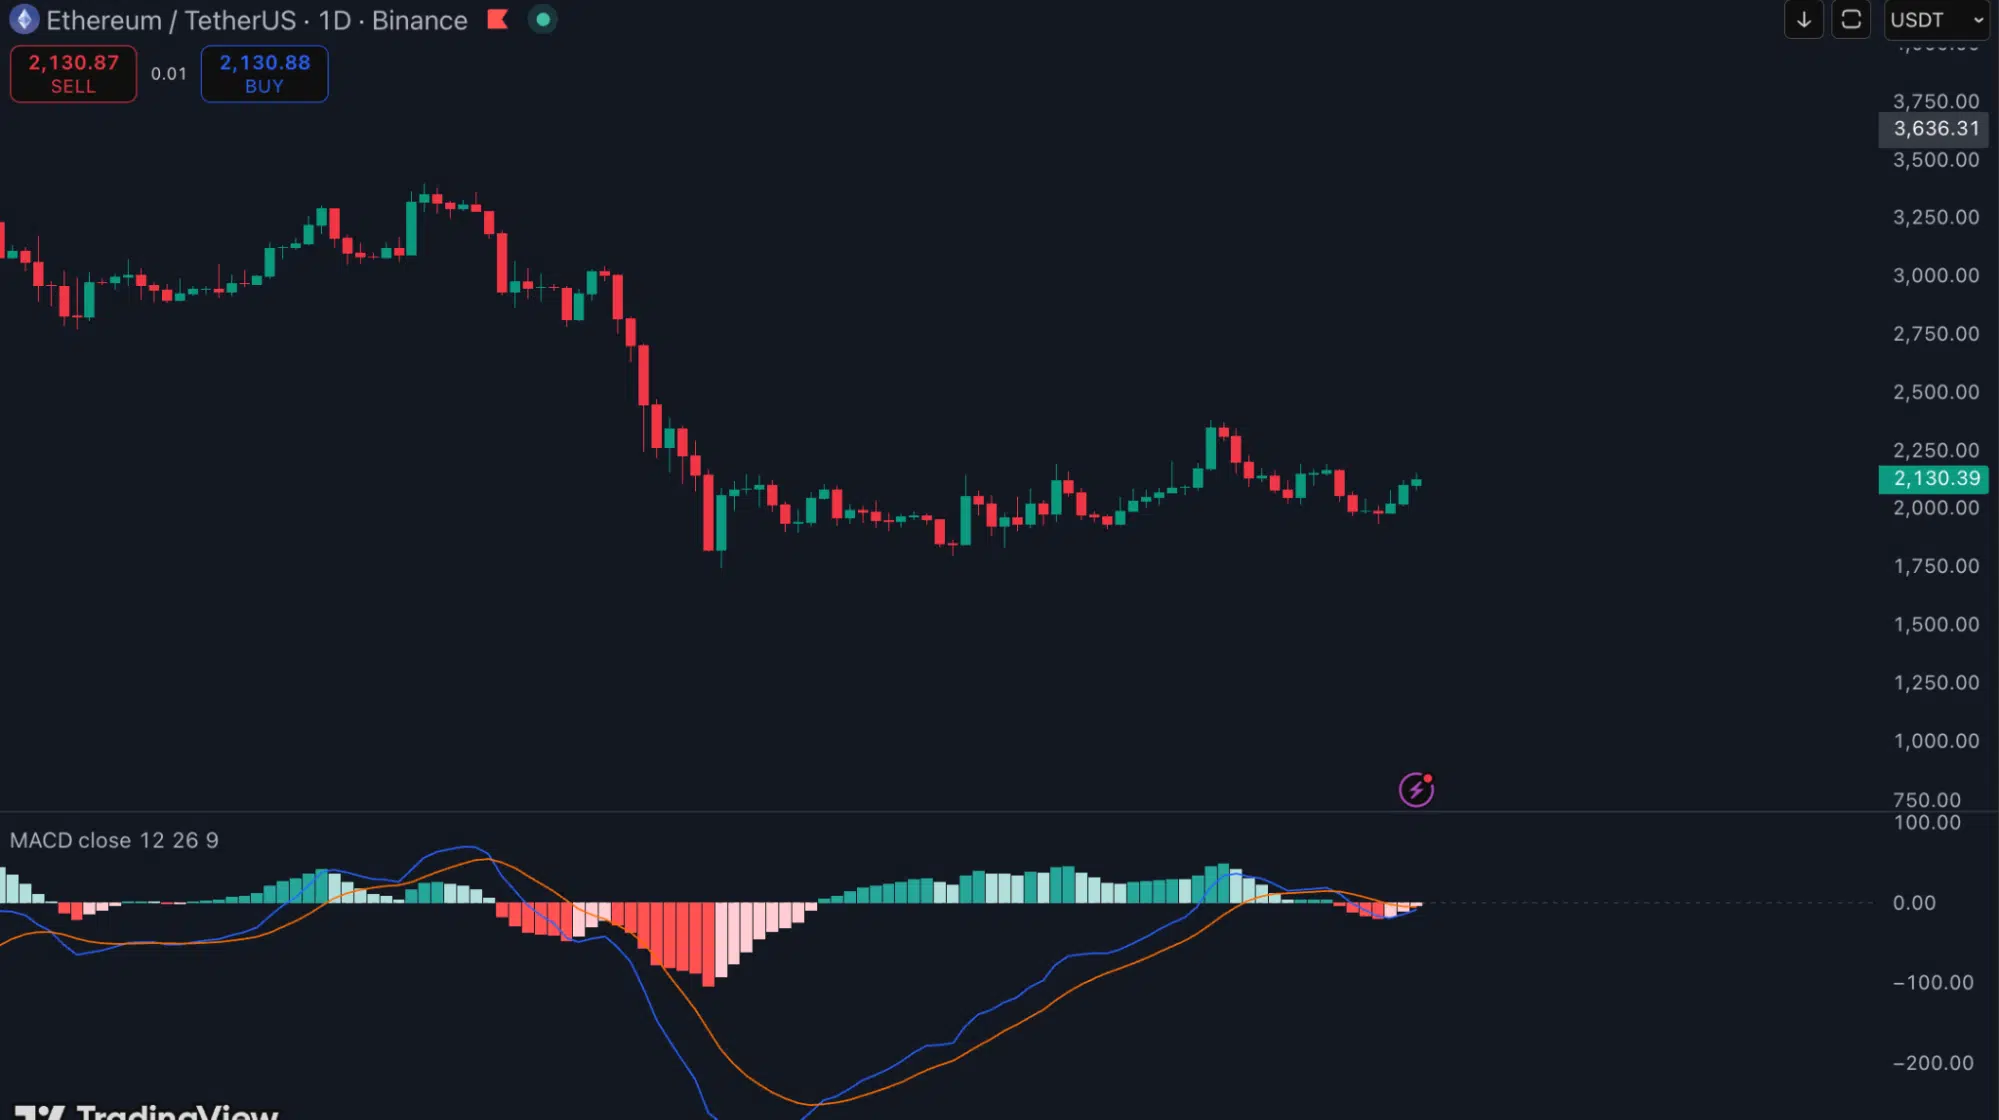
A bearish signal forms when the MACD line crosses below the signal line, often after an extended move up. This indicates that selling pressure is taking over and the previous trend is losing steam.
When the MACD stays below the signal line and the zero level, it confirms a bearish environment. These zones are commonly used to identify short-selling opportunities or to exit long positions before a major drop.
3. Advanced MACD Strategies: Boosting Accuracy with Confluence
3.1. The Signal Line Crossover
The most common way to leverage the MACD is the crossover between the MACD line and its nine-day EMA (the Signal Line).

- Bullish Signal: Triggered when the MACD moves above the signal line.
- Bearish Signal: Triggered when the MACD moves below the signal line.
- The Histogram Rule: Pay attention to the length of the histogram bars. Longer bars indicate stronger momentum; when they are expanding, the price is more likely to continue in the trending direction.

3.2 The Zero-Line Crossover
This strategy focuses on the center of the indicator to confirm a full trend flip.

- Long Entry: When the MACD crosses from below to above the zero line, it confirms that the bulls have regained control.
- Short Entry: When it crosses from above to below the zero line, it signals increasing downward momentum, offering a prime window for short positions.
3.3. The Money Flow Index (MFI) + MACD
The MFI uses both price and trading volume to identify overbought or oversold conditions.
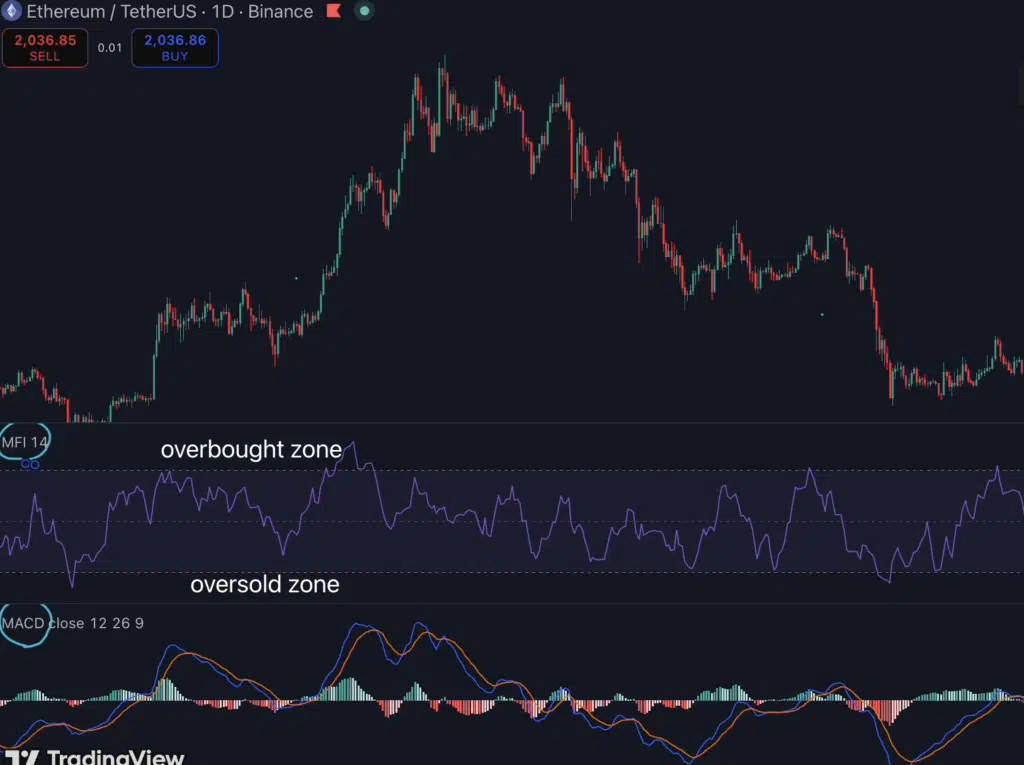
- How it works: The MFI oscillates between 0 and 100. Readings below 20 are oversold, while above 80 are overbought.
- The Strategy: Use the MFI to find extreme market conditions and wait for a MACD crossover to confirm the reversal. Because MFI focuses on volume spurts, it produces fewer but often more reliable signals.
3.4 The trio MACD + RSI + SMA
Professional traders often combine these three distinct tools to gain a 360-degree view of the market. This combination allows you to see the past, present, and potential future of a trend.
| Indicator | Primary Role | Strategic Value |
|---|---|---|
|
MACD
|
Momentum Heartbeat
|
Identifies the strength and direction of the current trend.
|
|
RSI |
Future Projection
|
Pinpoints overbought/oversold levels to predict where a reversal might occur. |
|
SMA |
Trend Filter |
Acts as a lagging “anchor” to confirm if the overall trend is still intact.
|
Here’s how to use the trio:
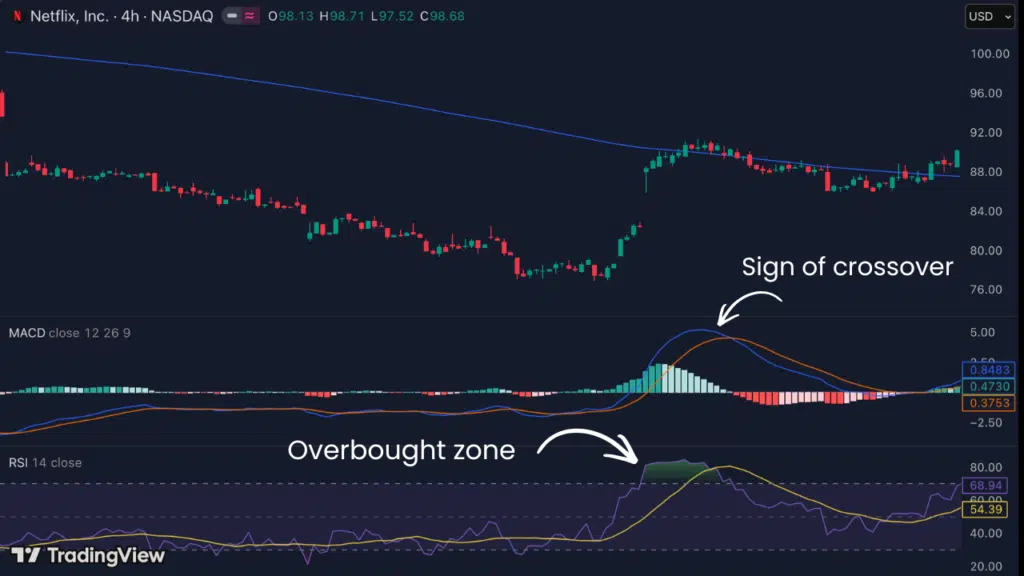
Step 1: Use the RSI (typically set to 14 periods) to see if the market is overextended. If RSI is at 80, be wary of buying, even if the MACD is bullish.
Step 2: Wait for the MACD to show a crossover to signal that momentum is officially shifting.
Step 3: Use the SMA (like a 50 or 200-period) to ensure you aren’t trading against the big picture. Only take long MACD signals if the price is also above the SMA.
4. Advantages and Limitations of MACD Strategies
There are lots of advantages that traders love, one of them is that the MACD strategies provides objective, visual triggers:
- Crossovers: Clear cross points for entries and exits.
- Zero-Line Flips: Definitive shifts from bullish to bearish territory.
- Histogram Growth: A visual representation of whether momentum is accelerating or fading.

However, we need to mention of some the limitations that traders should not ignore
Inherent Lag: As a moving-average-based tool, the MACD is a lagging indicator that reflects past price action. This can result in crossovers occurring after a significant portion of the move has already passed, potentially leading to late entries.
Overbought/Oversold Ambiguity: Unlike the RSI, the MACD lacks absolute limits (e.g., 0 to 100). This makes it difficult to pinpoint “true” overextended levels, as a high reading may simply indicate a strong trend rather than an imminent reversal.
False Divergences: In aggressive trends, the MACD can signal bearish divergence multiple times while the price continues to climb. Relying solely on these signals without further confirmation can lead to trading against a powerful market move.
5. Simplifying Analysis with the Master MACD Indicator
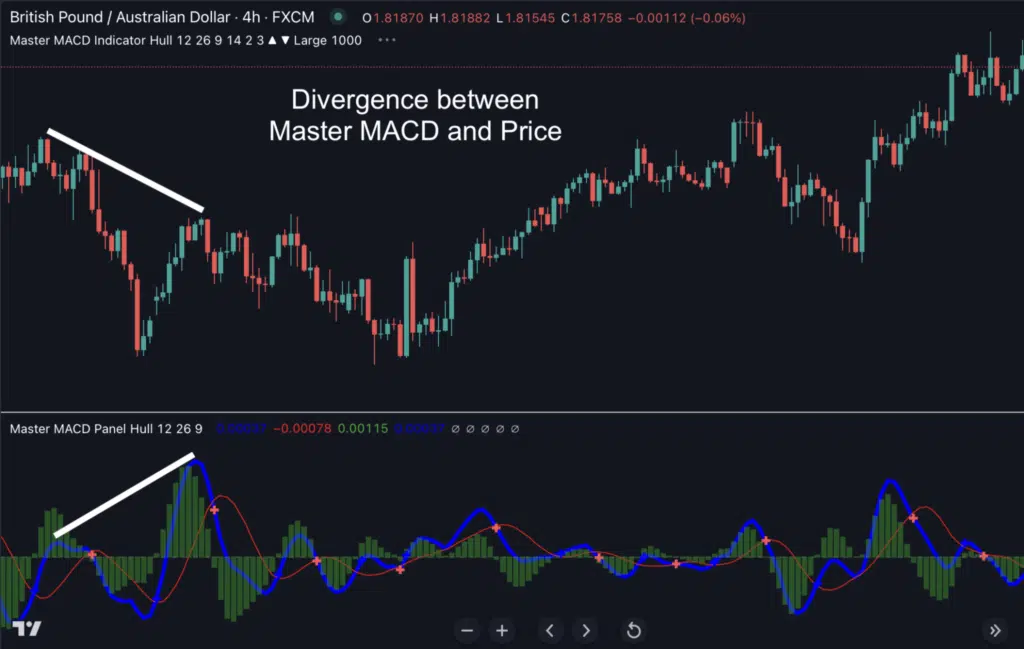
The Master MACD for TradingView (or MT4/NT8) is designed to eliminate the lag and noise of the standard version. It highlights divergence automatically and identifies high-probability breakout zones in real time.
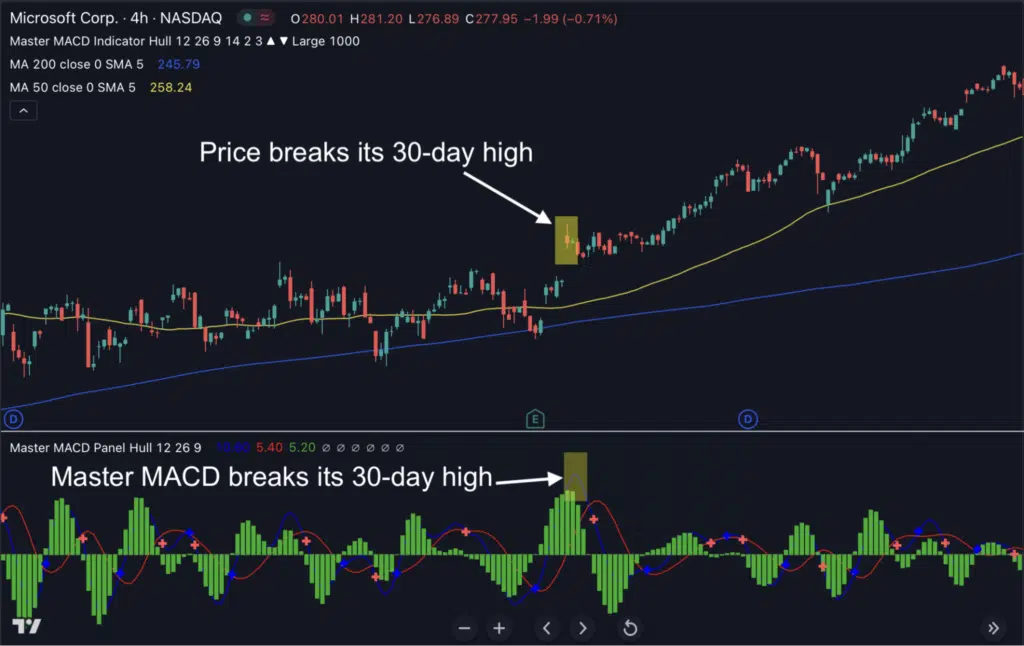
5.1 How the Indicator Works
The upgraded tool detects institutional momentum by filtering out minor price fluctuations. Once a valid trend or divergence is identified, it is displayed directly on the chart, allowing you to focus on execution rather than manual calculation.

5.2 Key Benefits for Traders
The main strength of this professional tool lies in its actionable insights. It helps traders:
- Identify high-probability breakout zones.
- Spot hidden divergence that manual analysis might miss.
- Align trades with the dominant market trend.
- Maintain consistent risk management with clear visual signals.
Whether you are a day trader looking for quick scalps or a swing trader following long-term trends, a structured MACD strategy provides the clarity needed to trade with confidence.
Ready to move beyond basic indicators? Check out the Master MACD indicator here.
6. Final Thoughts
Mastering the MACD strategy gives you a clearer view of the market’s internal momentum. By understanding how to read crossovers, breakouts, and divergence, you can plan trades with greater precision and avoid being caught on the wrong side of a trend.
While basic indicators can be a starting point, professional-grade tools like Master MACD make it easier to apply these concepts consistently and profitably.