3MA Dashboard for TradingView
📌 Scans up to 10 different symbols and 7 different timeframes for high-probability trend-following trade setups.
📌 When the long-term trend, and the medium-term trend, and the short-term trend are IN SYNC.
📌 It uses CUSTOM, NEXT-GENERATION Moving Average algorithm. And that could mean increased accuracy, increased versatility, and most importantly, LESS LAG.
$1,999.00
It uses CUSTOM, NEXT-GENERATION Moving Average algorithm. And that could mean increased accuracy, increased versatility, and most importantly, LESS LAG.
What’s even BETTER? It also scans up to 10 different symbols for high-probability trend-following setups.
So you can INSTANTLY identify the trends in MULTIPLE markets with just one glance at the chart:
What exactly is this indicator?
The “3MA Dashboard for Tradingview” indicator scans up to 10 different symbols and 7 different timeframes for high-probability trend-following trade setups.
This kind of trade setups occur when the long-term trend, medium-term trend, and short-term trend are IN SYNC. When all these trends are in sync, there’s a great likelihood that a new trend has established.
And to fully understand why 3MA Dashboard for Tradingview — the brand-new indicator I’m about to share with you is such a GAME-CHANGER, let me take you back to the very beginning:
3 months ago, I released the Trend Symphony indicator – the predecessor of our brand-new 3MA Dashboard – to a very small group of beta testers.
And it’s quickly receiving rave reviews.
For good reasons:
Its unique algorithm gives you a precise alert IMMEDIATELY when the long-term trend, and the medium-term trend, and the short-term trend are IN SYNC.
We call it the “Trend Symphony” indicator.
And it’s my favorite Tradingview indicator for trend trading. Here’s why:
The “Trend Symphony for Tradingview” indicator gives you an alert (you’ll get visual, sound, push, and email alerts) IMMEDIATELY when the long-term trend, and the medium-term trend, and the short-term trend are IN SYNC.
When all the trends are in agreement, it means that there’s a high probability that the price will move strongly in that particular direction.
Let me show you an example of the Trend Symphony indicator in action:
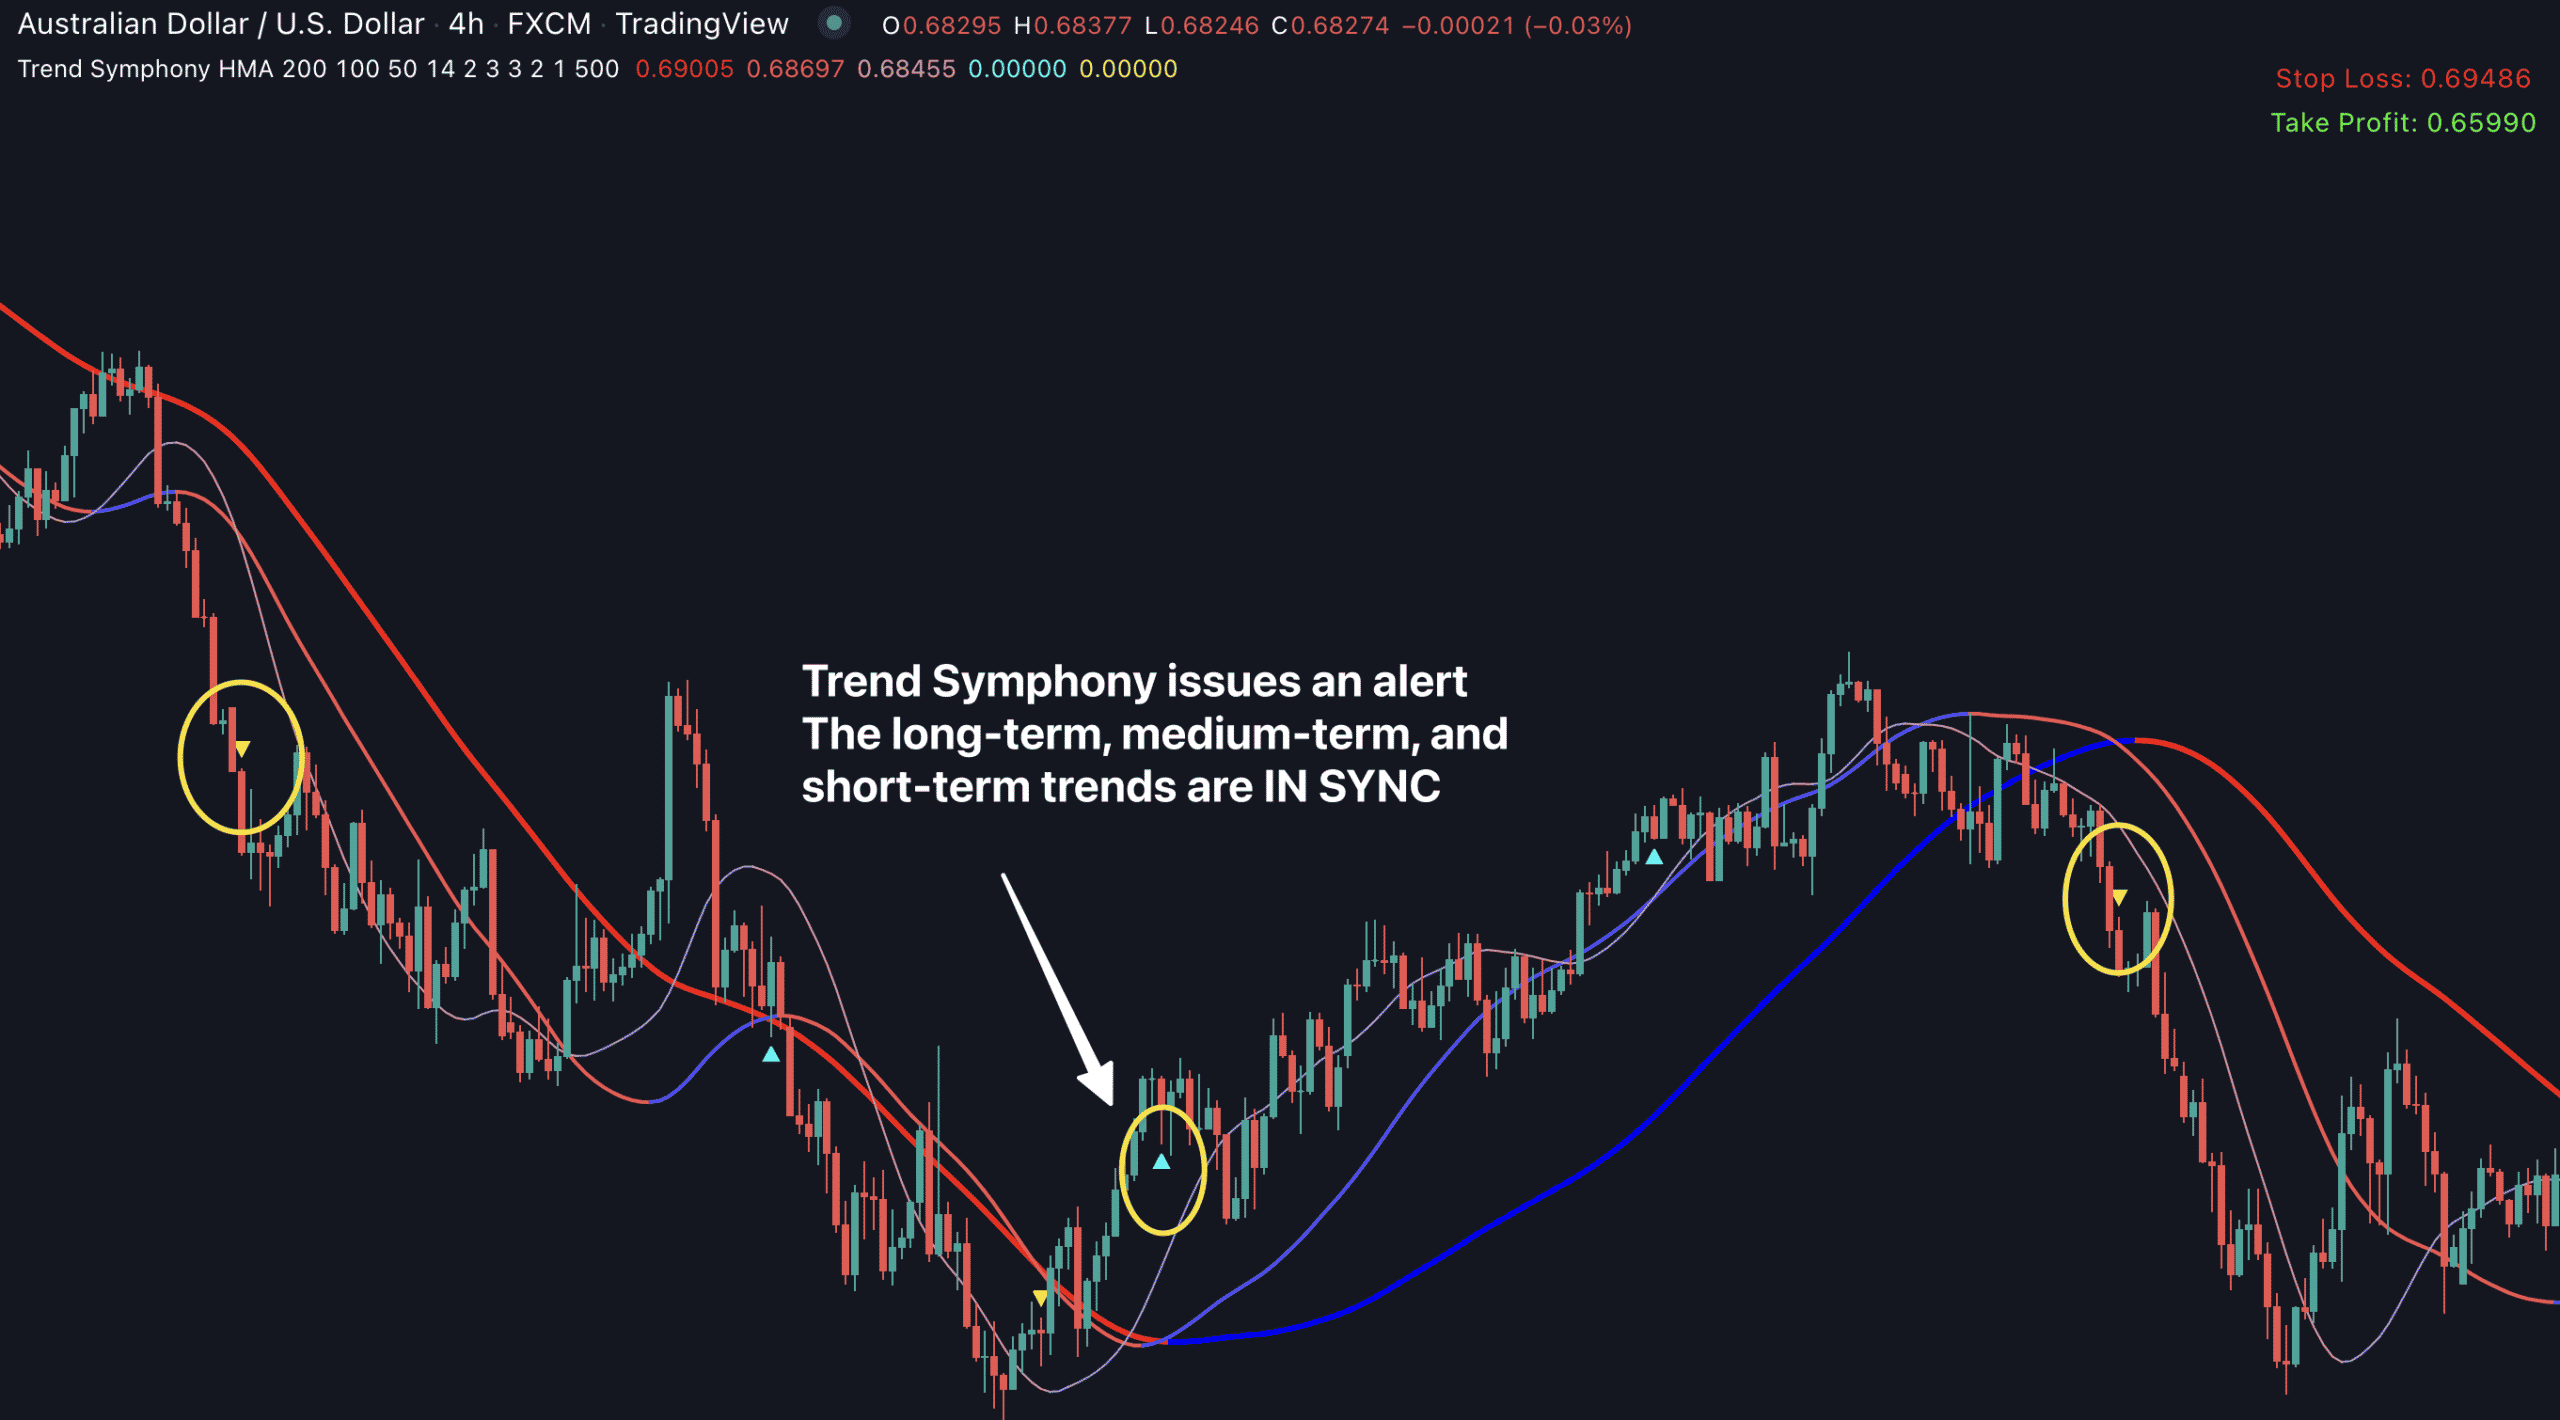
In this example, the fast moving average (represents the short-term trend) is above the medium moving average (represents the mid-term trend). Which, in turn, is above the slow moving average (represents the long-term trend).
When this happens, we conclude that all the trends are in sync. And the market is in an uptrend.
That’s why in this example, we could consider placing a long trade as soon as Trend Symphony issues an alert.
(Of course, when the opposite pattern appears – the fast moving average is below the medium moving average which is below the slow moving average – we conclude that the market is in a downtrend.)
And get this. Perhaps the most interesting feature of Trend Symphony is that:
Trend Symphony lets you define 3 moving averages: Fast, Medium, and Slow.
And you can choose from TEN (10) types of moving averages:
1) Simple Moving Average (SMA)
2) Exponential Moving Average (EMA)
3) Smoothed Moving Average (SMMA)
4) Linear Weighted Moving Average (LWMA)
5) Exponential Moving Average (DEMA)
6) Triple Exponential Moving Average (TEMA)
7) Kaufman’s Adaptive Moving Average (KAMA)
8) Jurik’s Moving Average (JMA)
9) Hull Moving Average (HMA)
10) Least Squares Moving Average (LSMA)
Amazing, isn’t it?
Not only that…
You’ll get an alert immediately when the 3 moving averages are IN SYNC.
1) Bullish alerts: the long moving average above the middle moving average and the middle moving average above the short moving average.
2) Bearish alerts: the long moving average below the middle moving average and the middle moving average below the short moving average.
What’s more?
Trend Symphony delivers these alerts, IMMEDIATELY, to you via:
1) Arrows: red arrow (by default) for the bearish signal and green arrow (by default) for the bullish signal.
2) Pop-up terminal window (Alert).
3) PUSH notification
4) Email notification
And that’s not all. Check this out:
Trend Symphony helps you SEE the dominant trend immediately.
And it does that by changing the colors of the 3 moving averages.
1) When the market is in an uptrend, all the moving averages are in BLUE
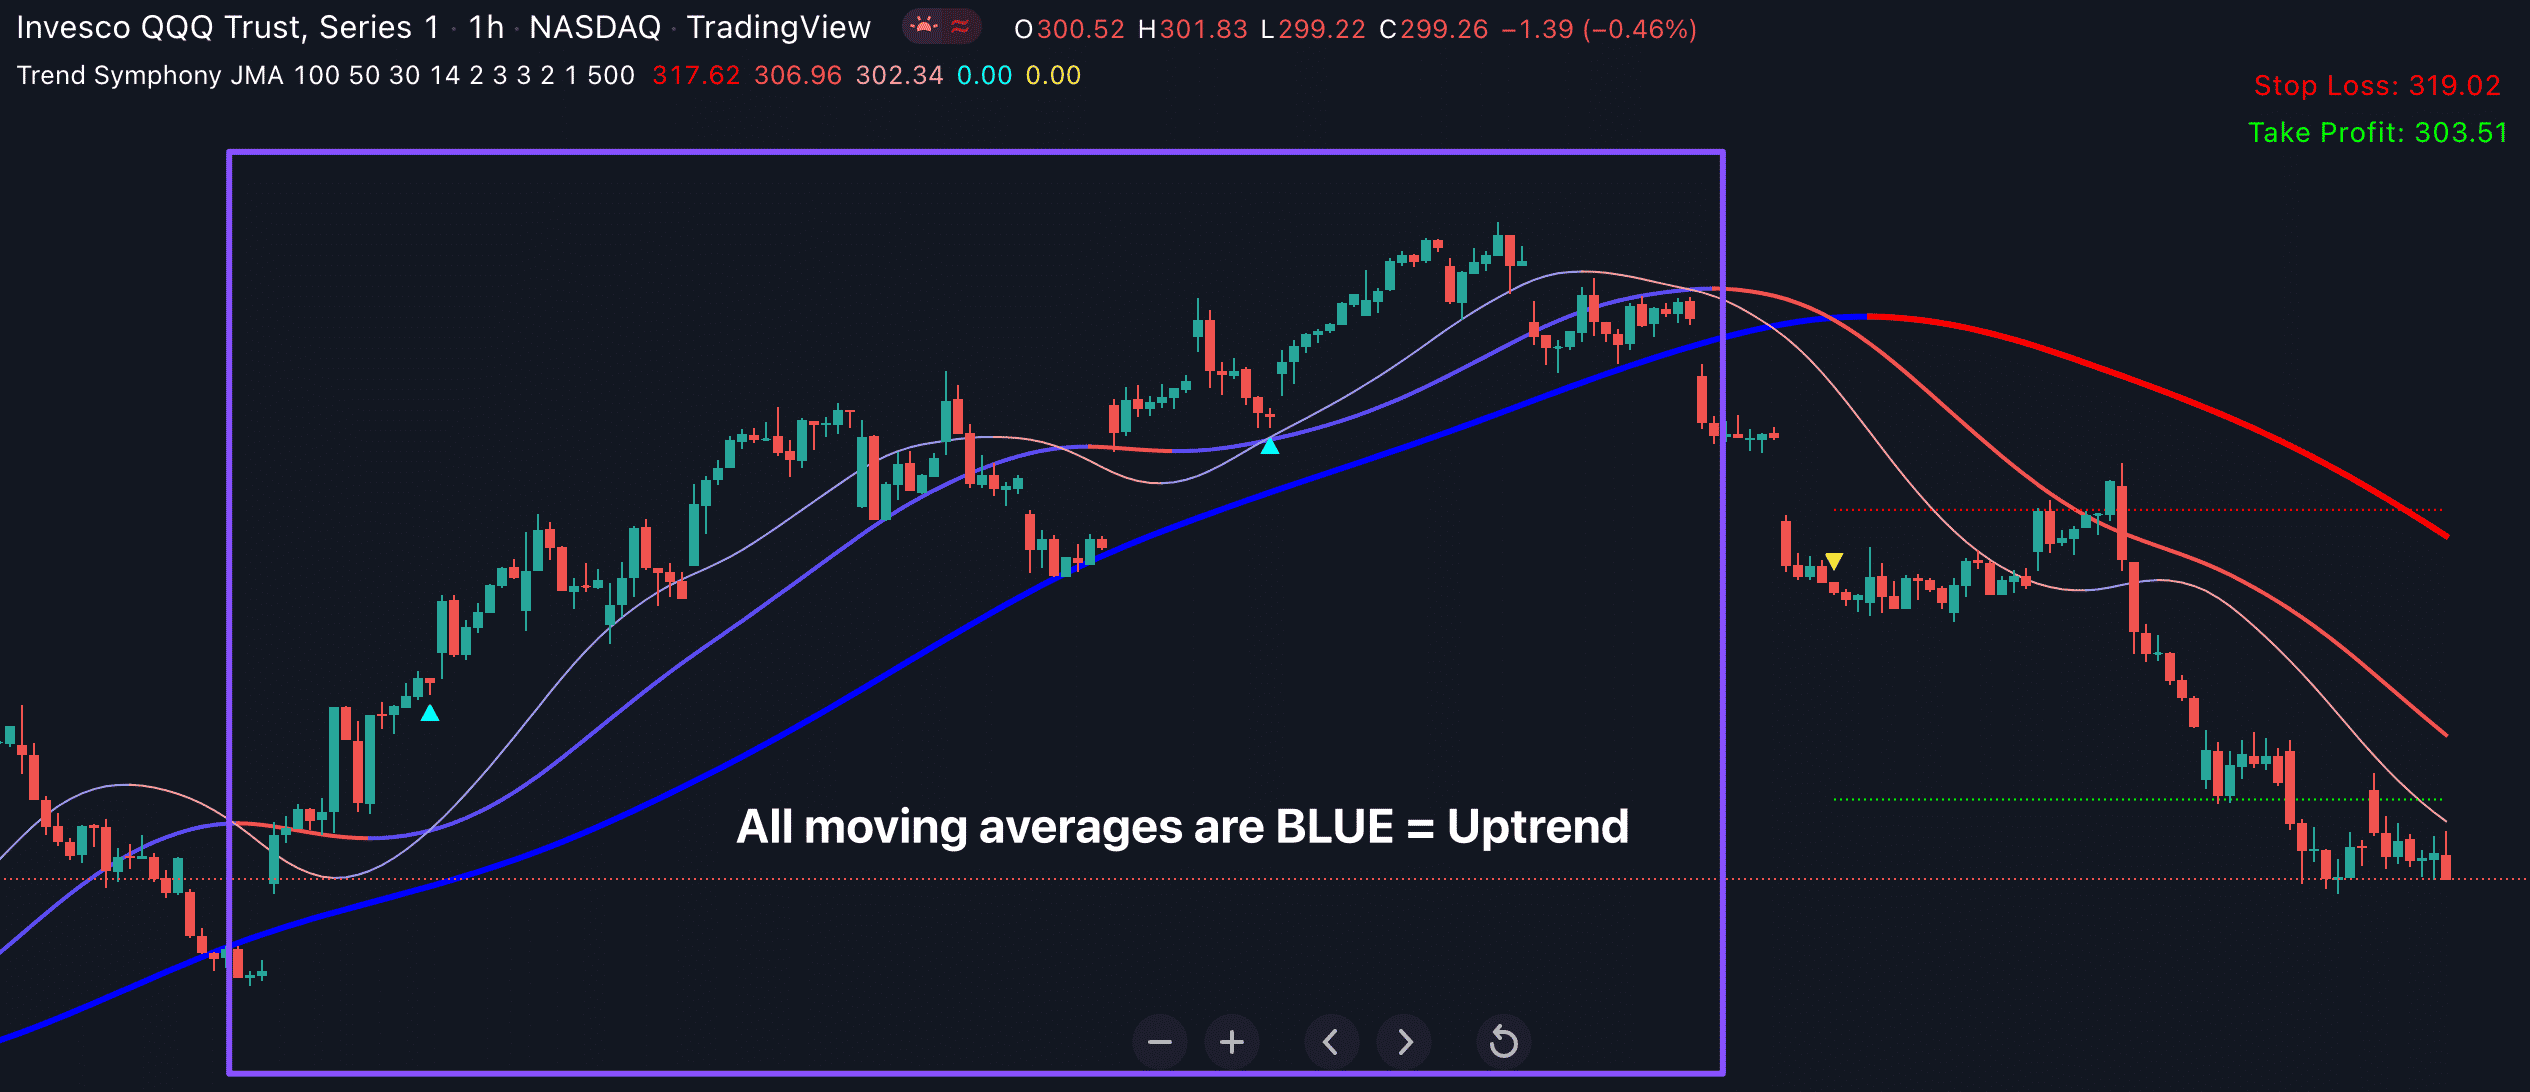
2) When the market is in a downtrend, all the moving averages are in RED

But that’s not all…
Today, we’re taking it to a whole new level:
So 3 months ago, we released the Trend Symphony for Tradingview indicator to a small group of beta testers
And it’s quickly receiving rave reviews.
Among the emails we received from happy Trend Symphony beta testers, one stands out.
He said: “Trend Symphony works. No doubt about it. But I trade 5 currency pairs plus stocks and S&P500.
Takes quite some time to go through each symbol to see which trade setups have formed.”
Gave me an idea.
What if we could apply our infamous “Dashboard” concept and design to these trade setups?
What if we could develop some kind of market scanner that SCANS all the symbols you want to trade, on ALL time-frames for this kind of high-probability trend-following trade setups?
And shows you all the recently formed trade setups in all markets, on all timeframes in ONE beautiful, easy-to-use dashboard.
I’m happy to say: WE’VE DONE IT.
We call this new indicator:
3MA Dashboard for Tradingview
It’s actually a suite of 2 amazing scanners:
- 3MA Dashboard MTS (MTS stands for Muti-Symbol) that scans up to 10 different symbols for this kind of trend-following trade setups.
- 3MA Dashboard MTF (MTF stands for Multi-Timeframe) that scans up to 7 different time-frames for these high-probability setups.
Let’s take a look at each of these scanners in action:
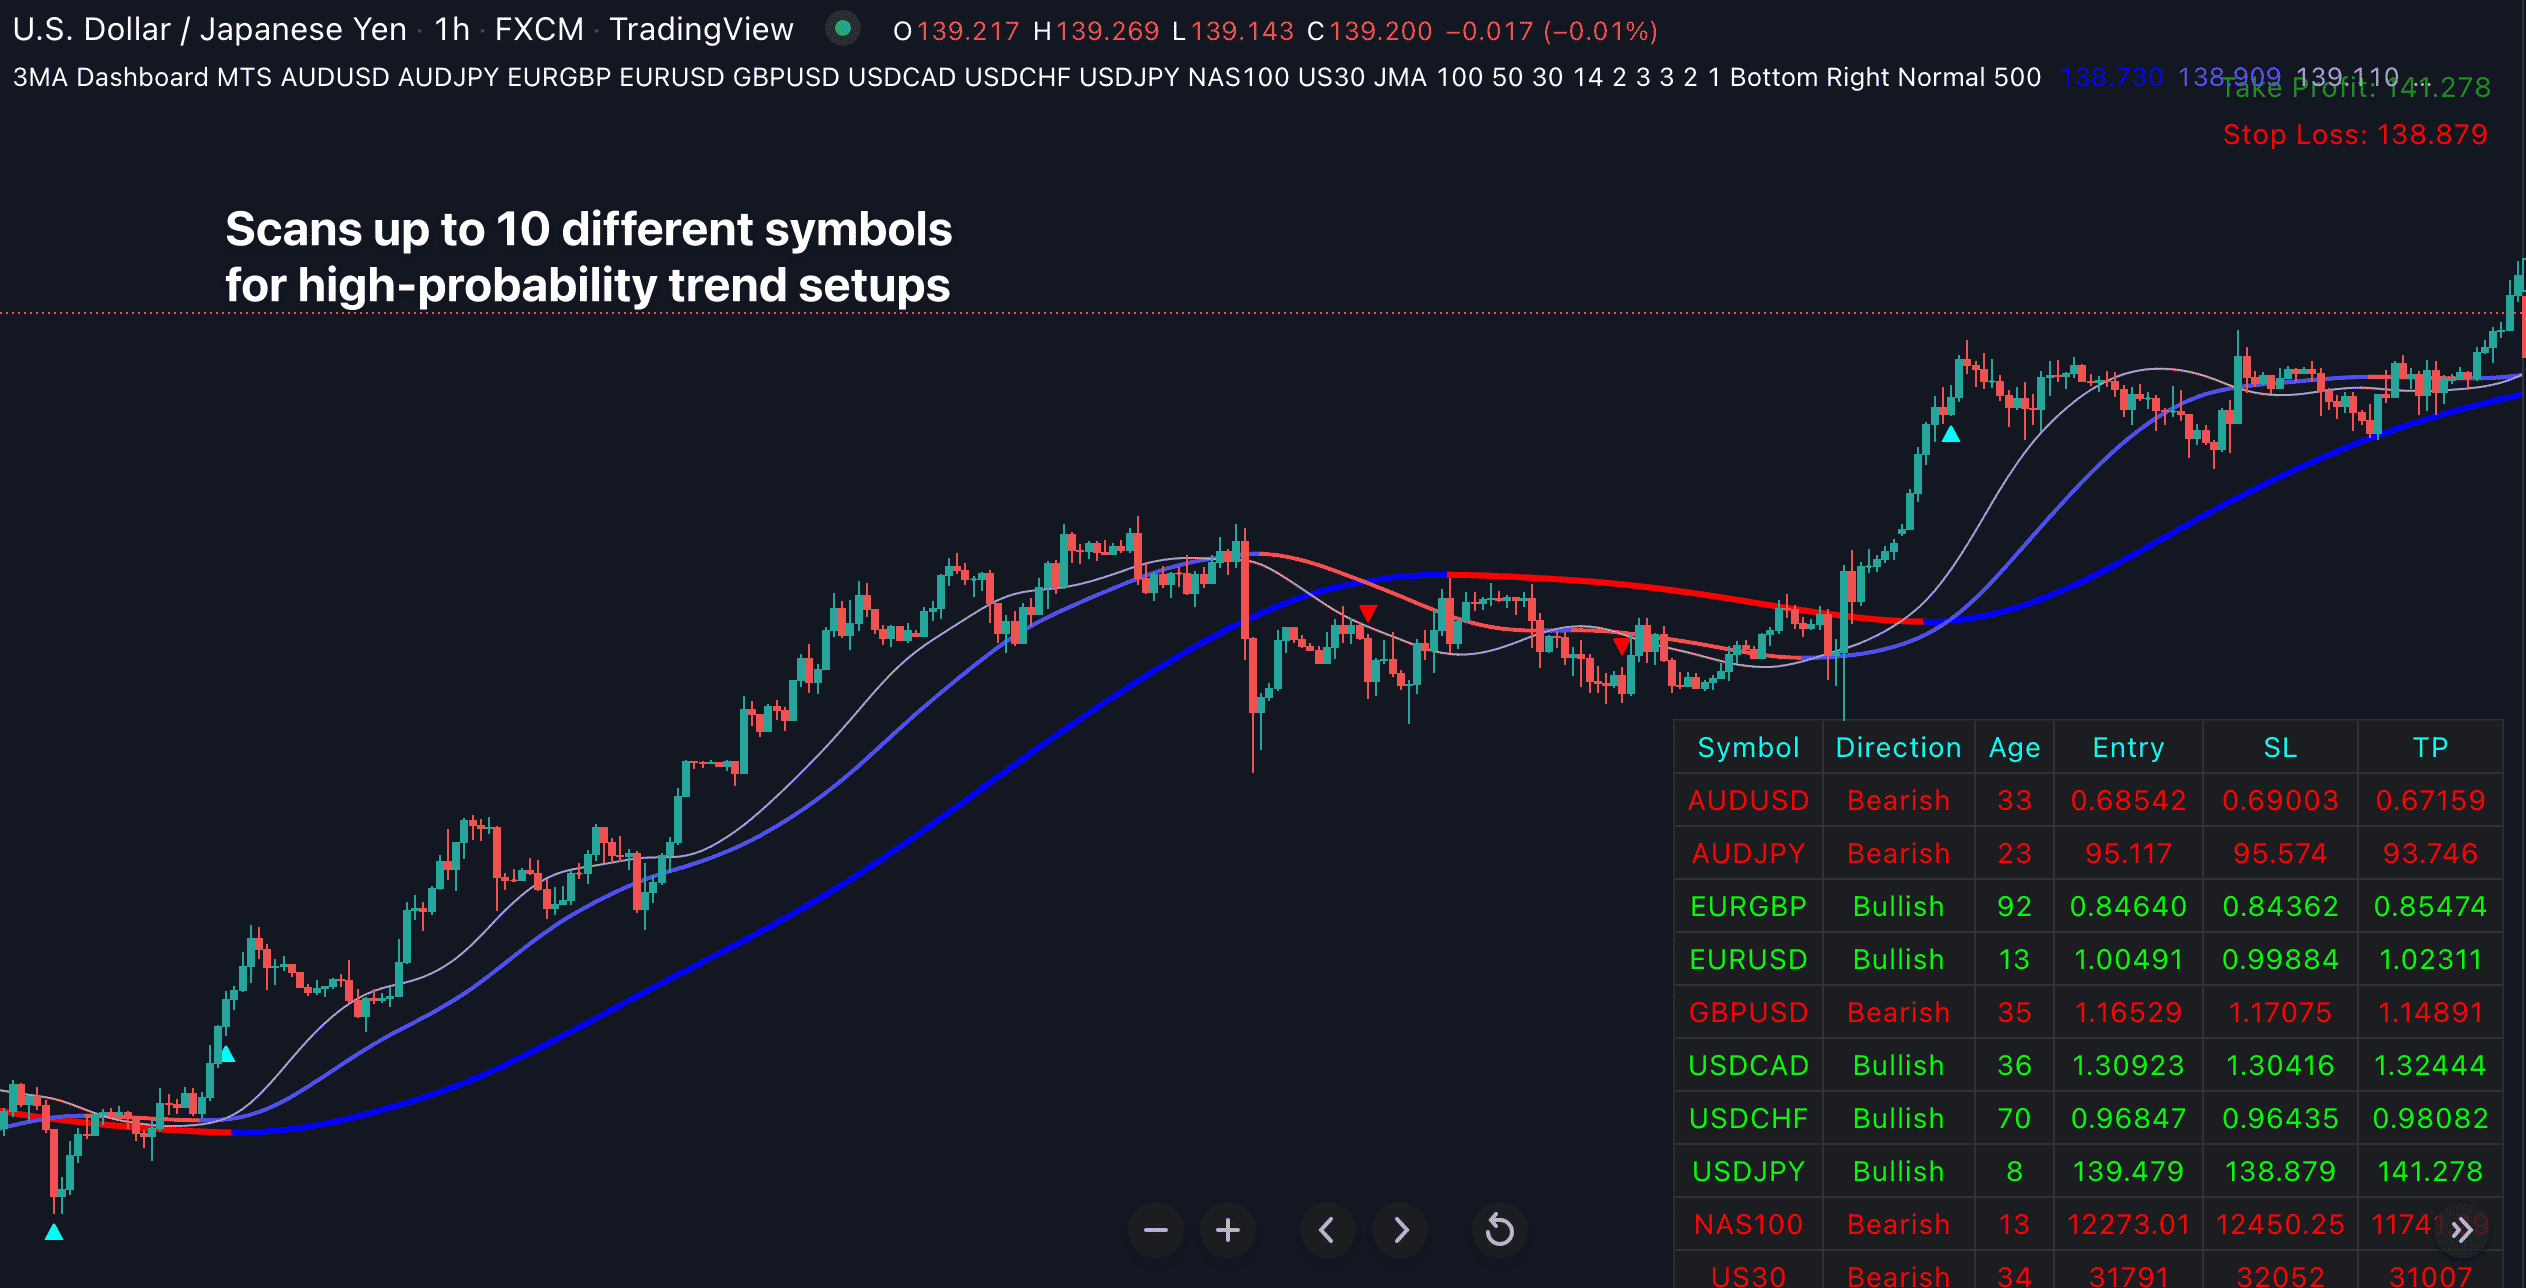
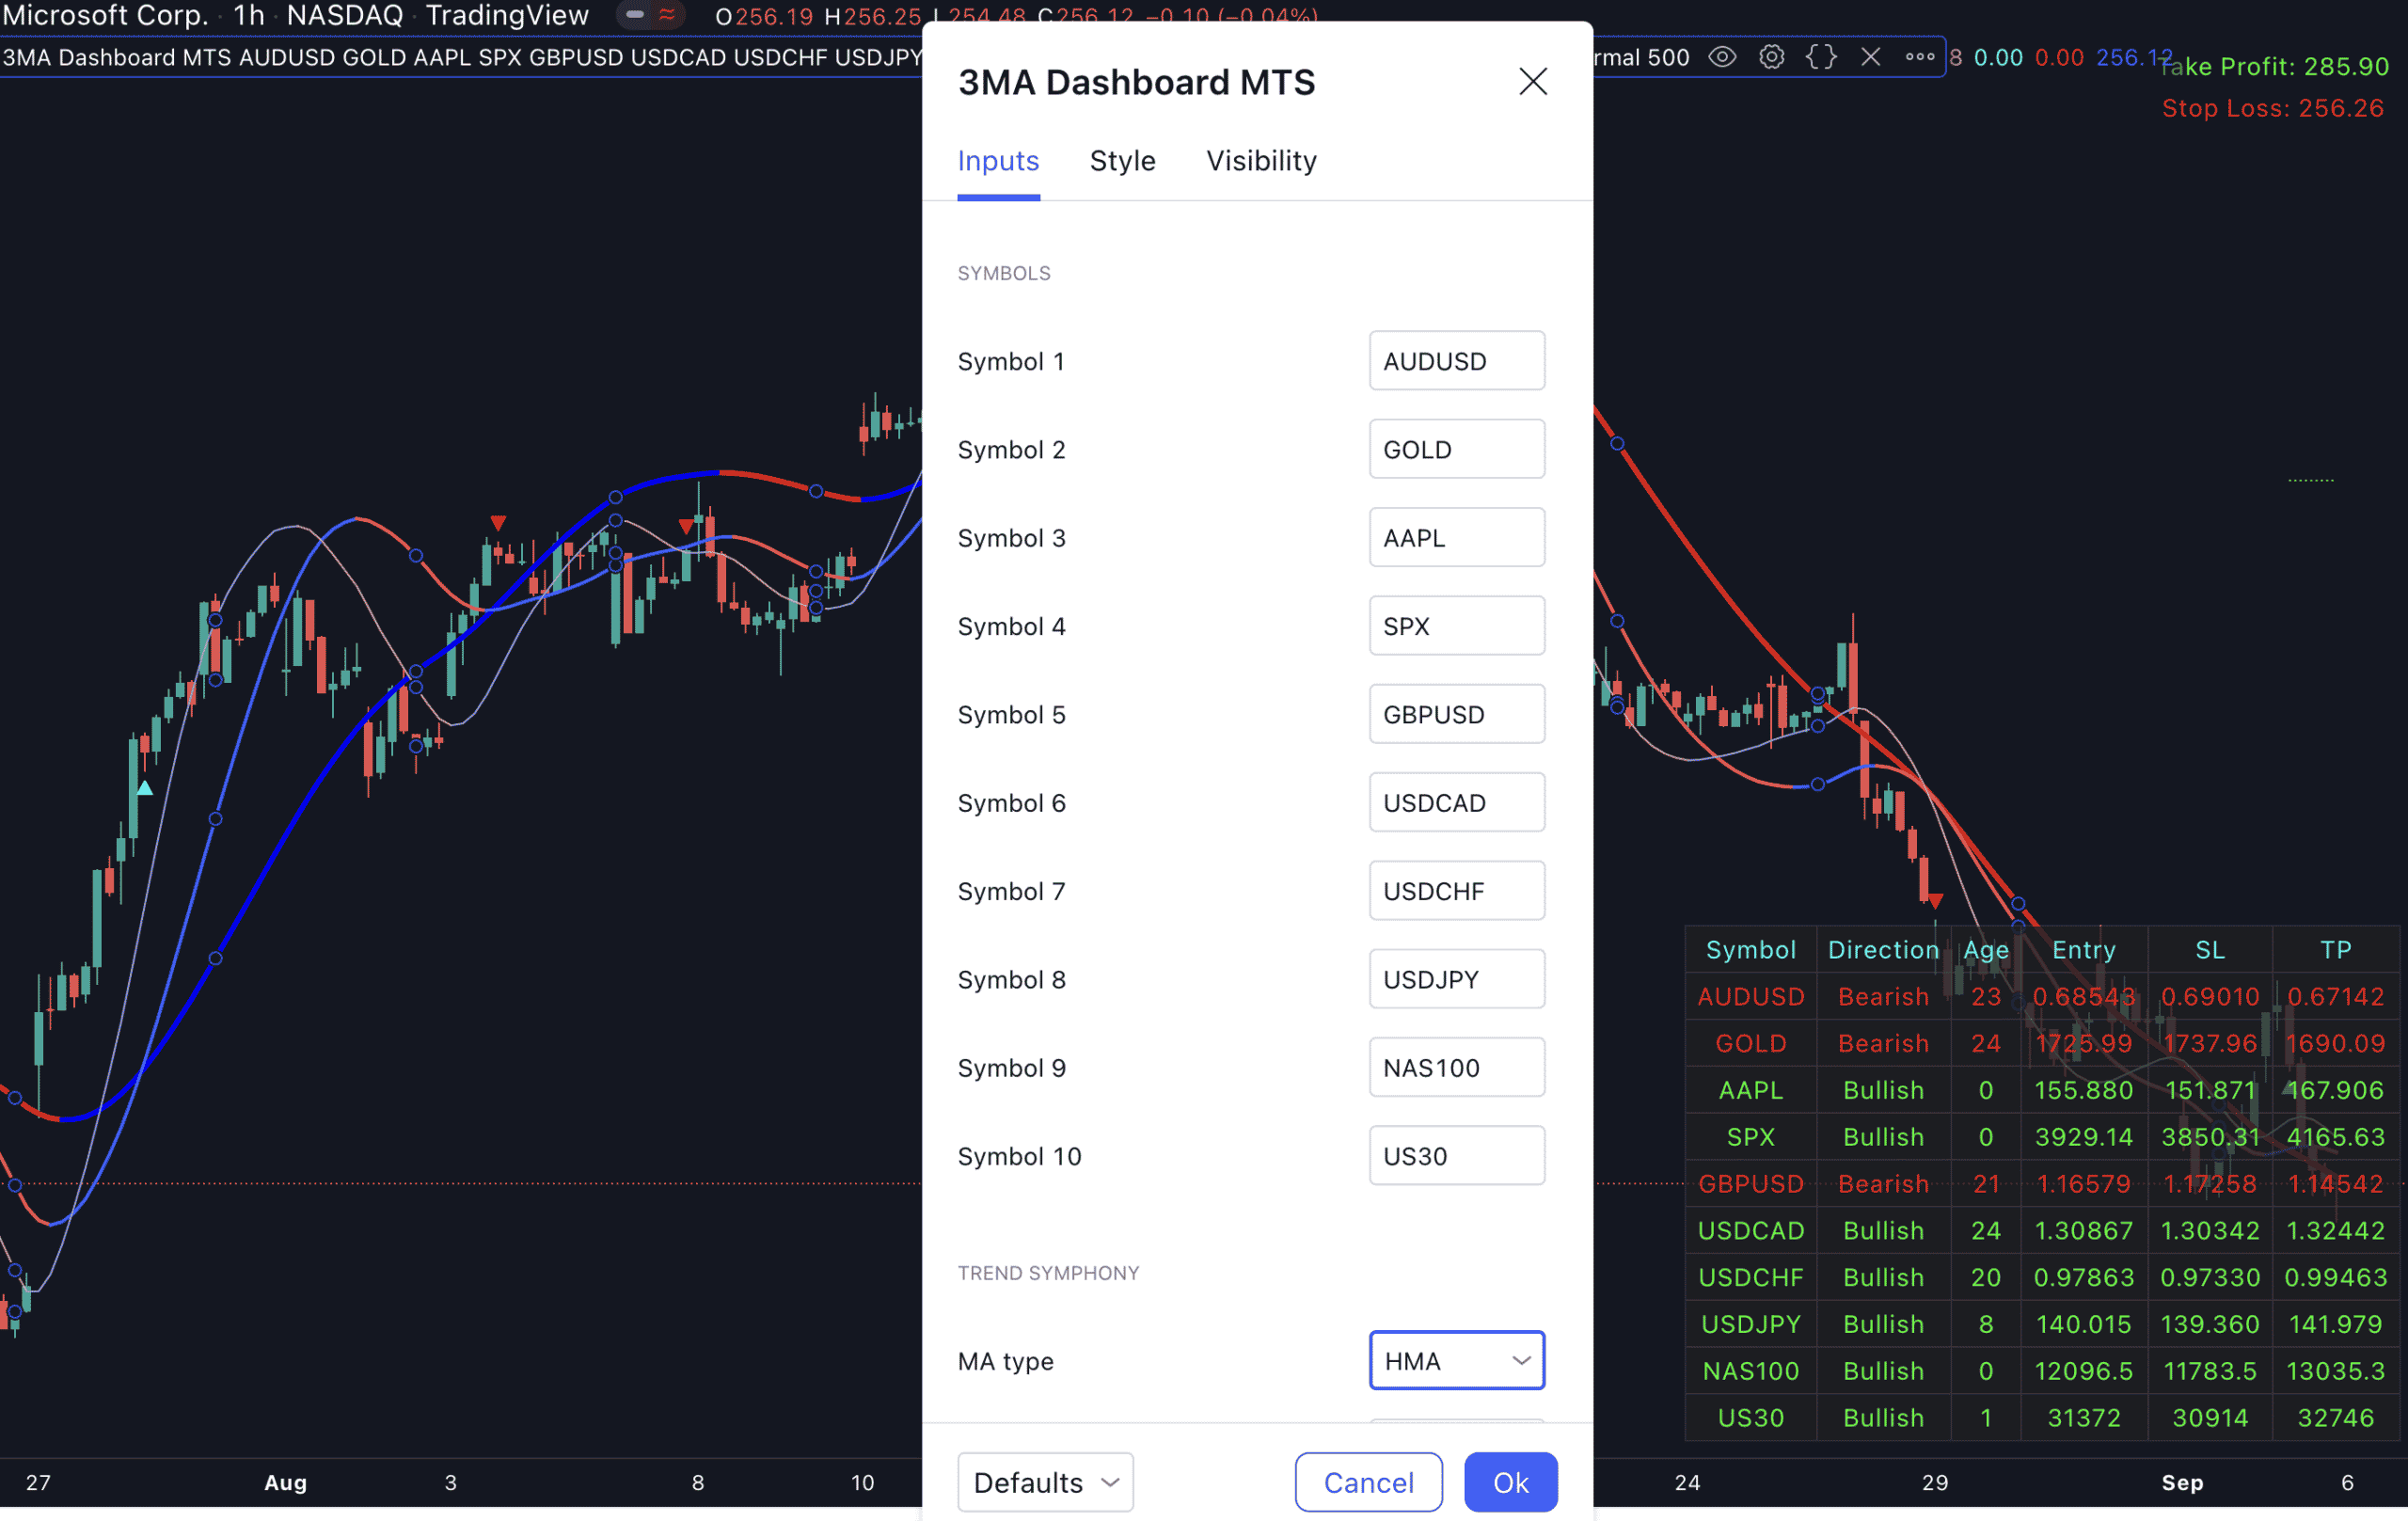
3MA Dashboard MTS in action:
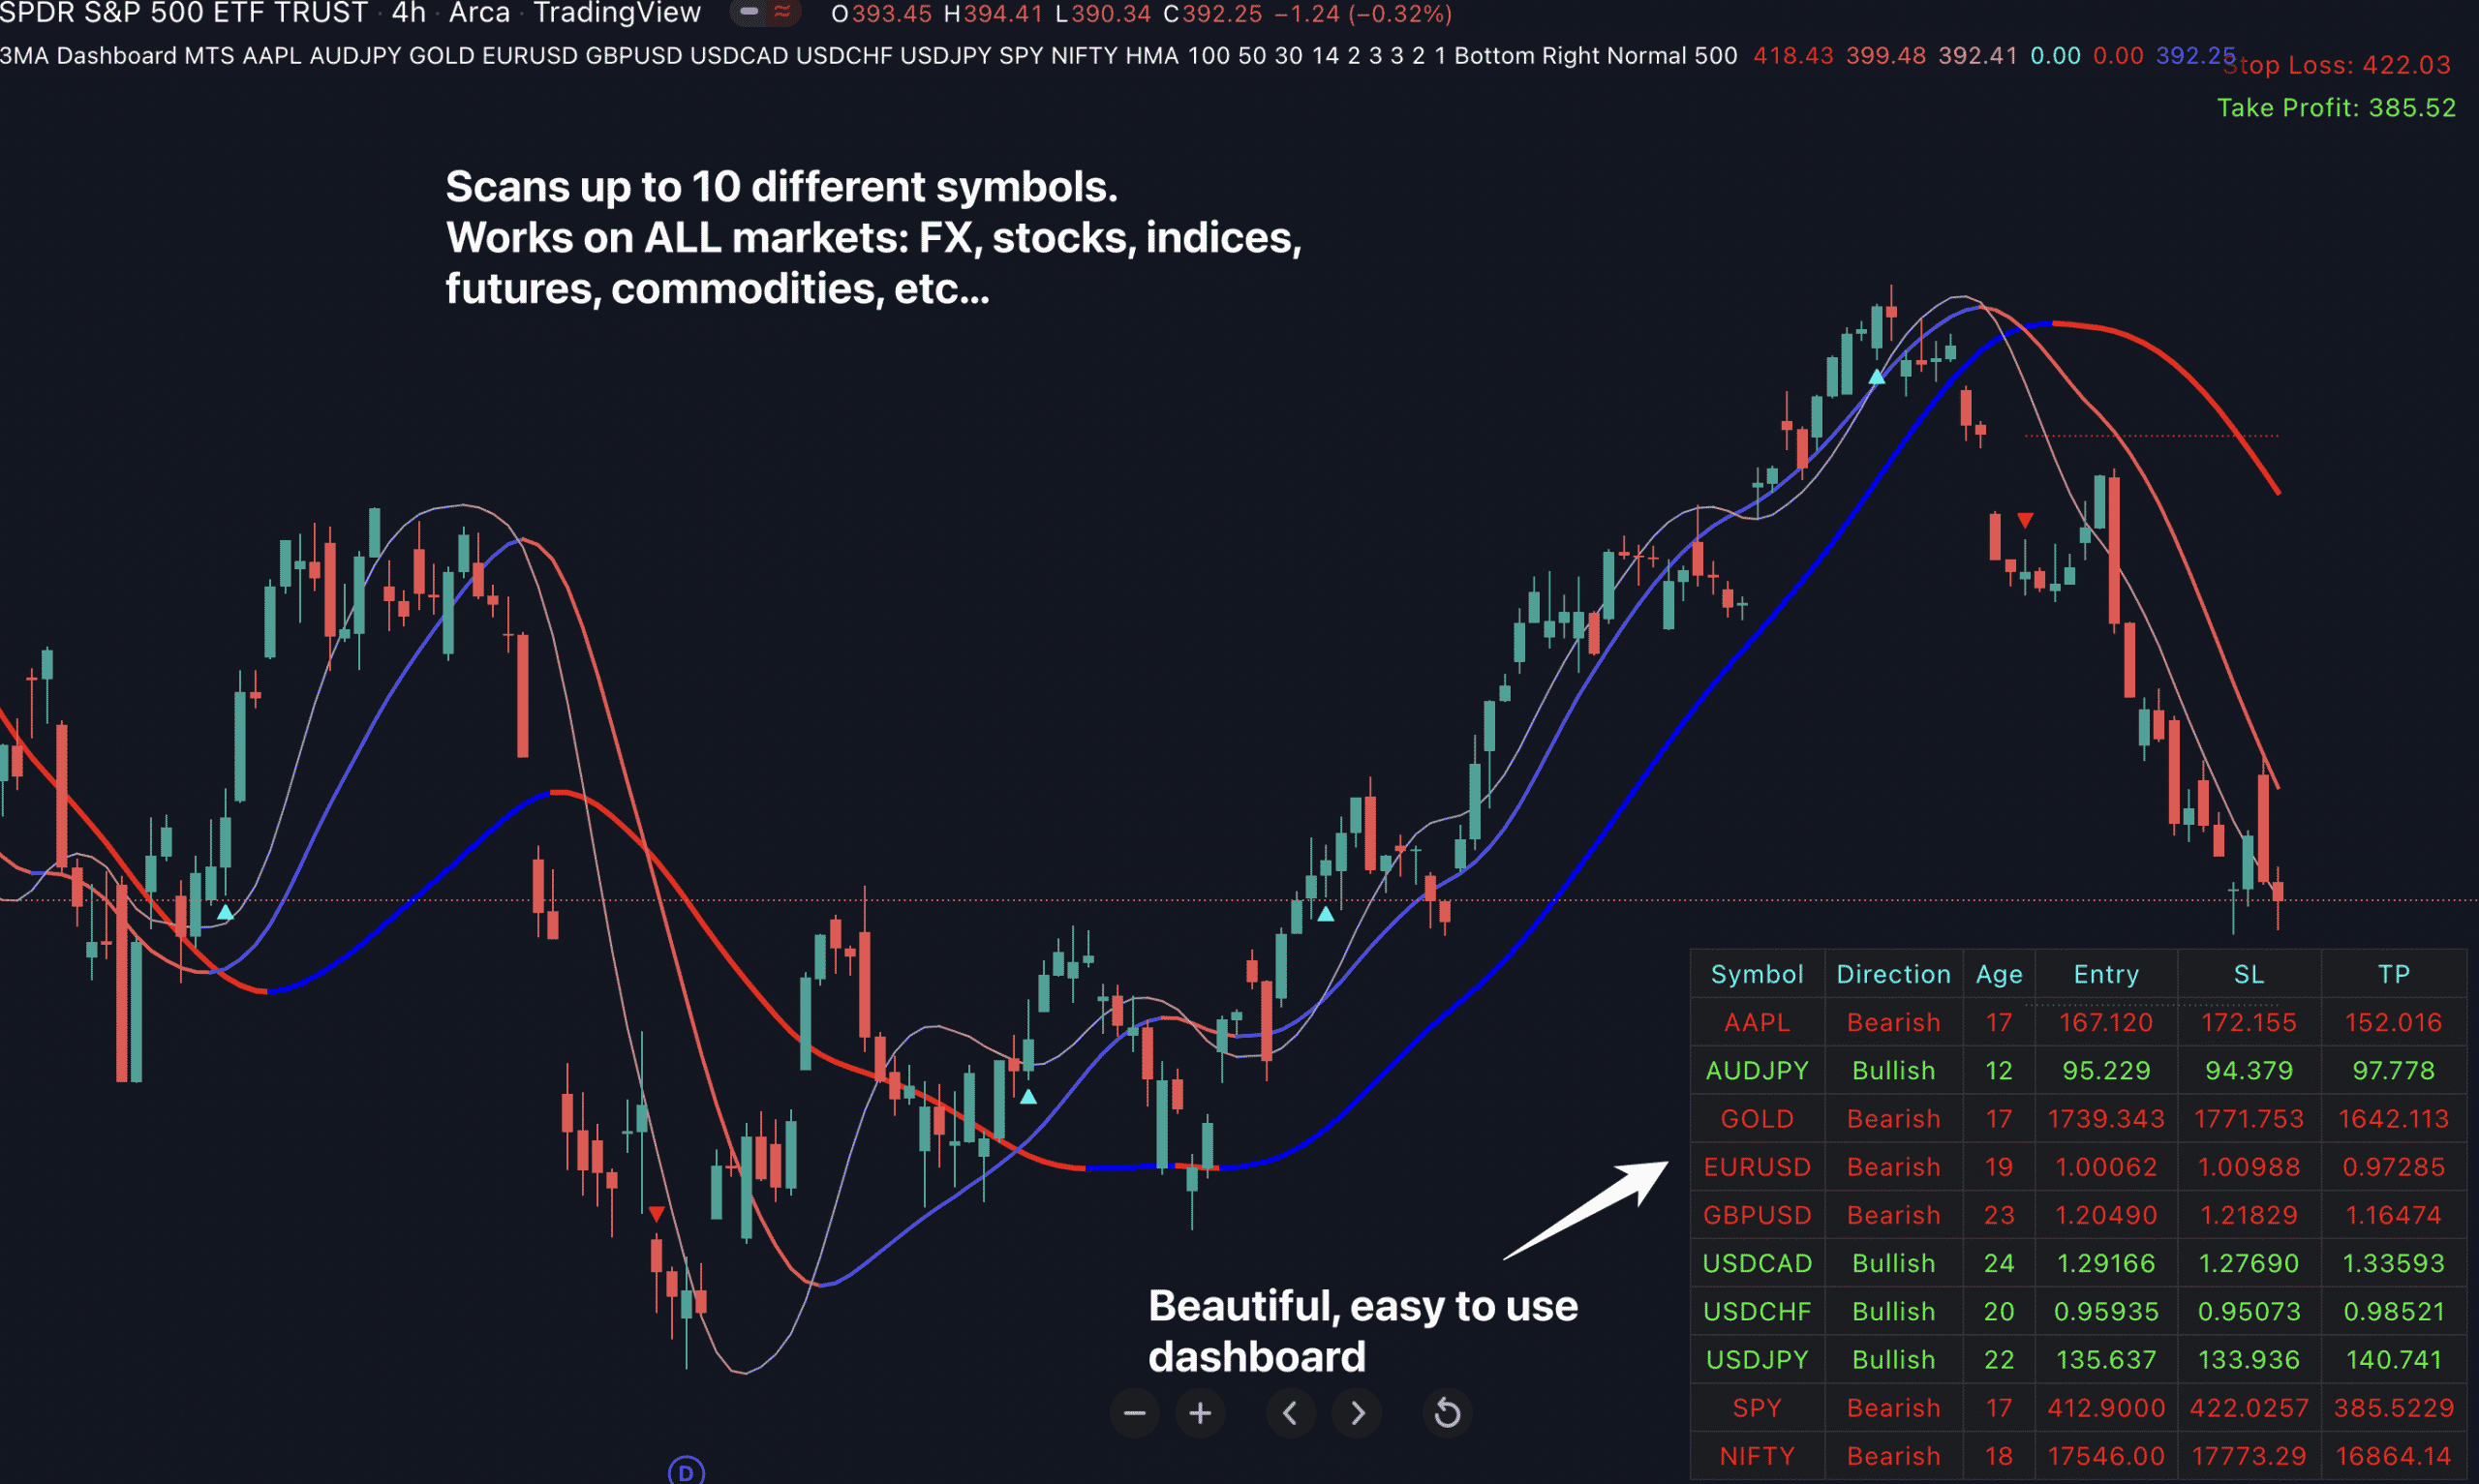
With 3MA Dashboard MTS in your toolkit, you’ll be able to see which trade setups has just formed on each of these symbols… simply by glancing at the dashboard.
And it works in ALL markets, whether it’s FX, stocks, indices, commodities, futures, etc…
Plus… you’ll also receive an INSTANT alert as soon as a trade setup appears on each of these symbols.
Once a trade setup is found, 3MA Dashboard MTS will also show you a suggestion on where to place your stop loss and take profit.
You may use these SL/TP as a starting point to build your own strategy.
Now, let’s take a look at the…
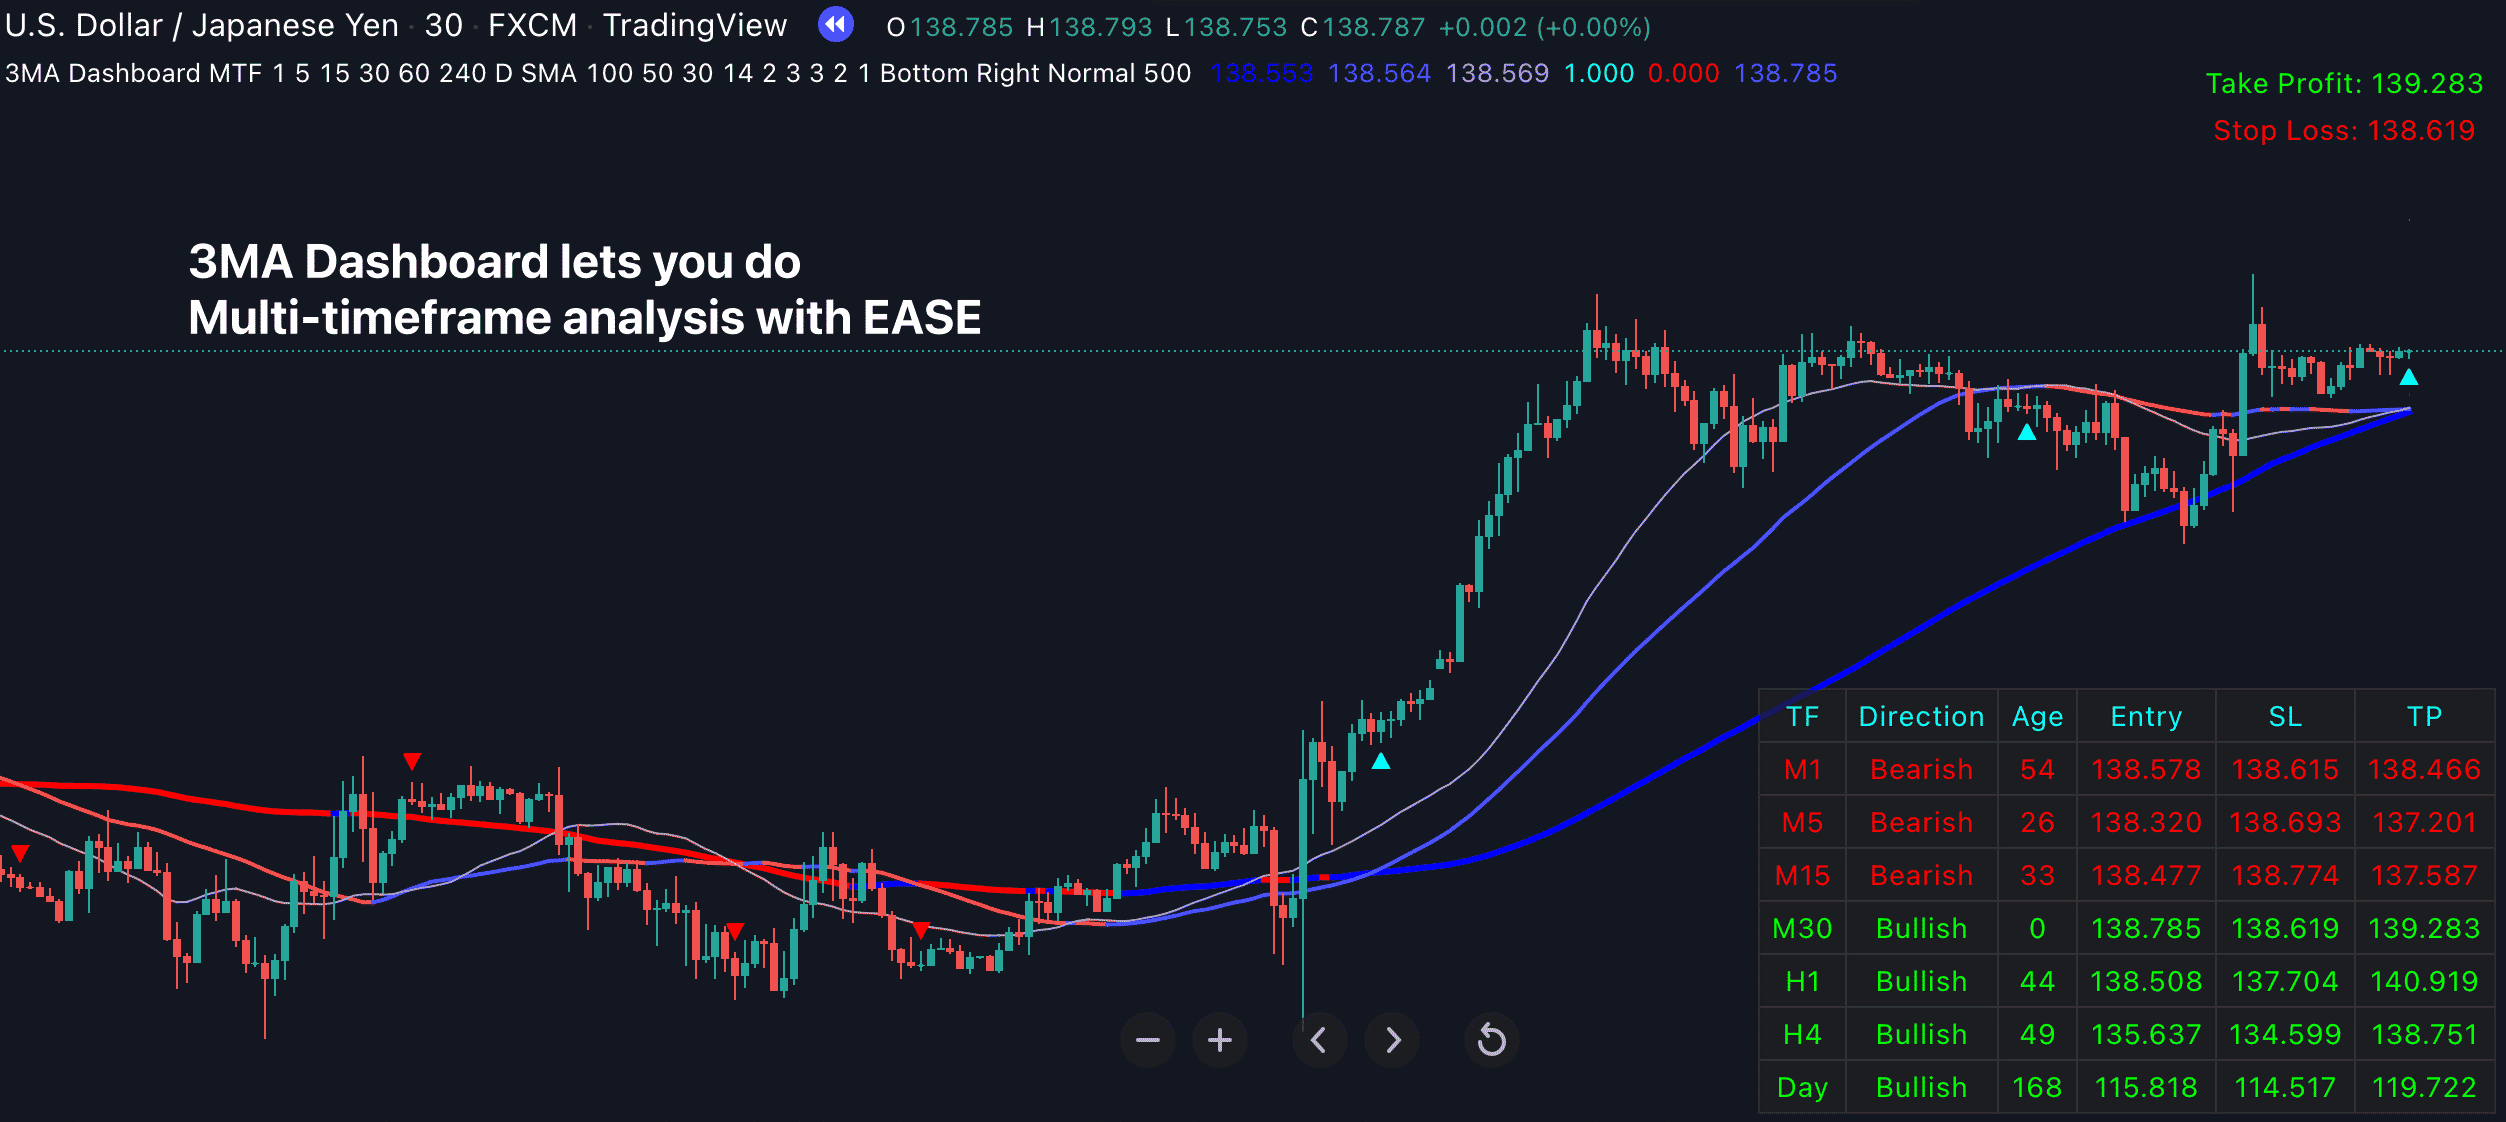
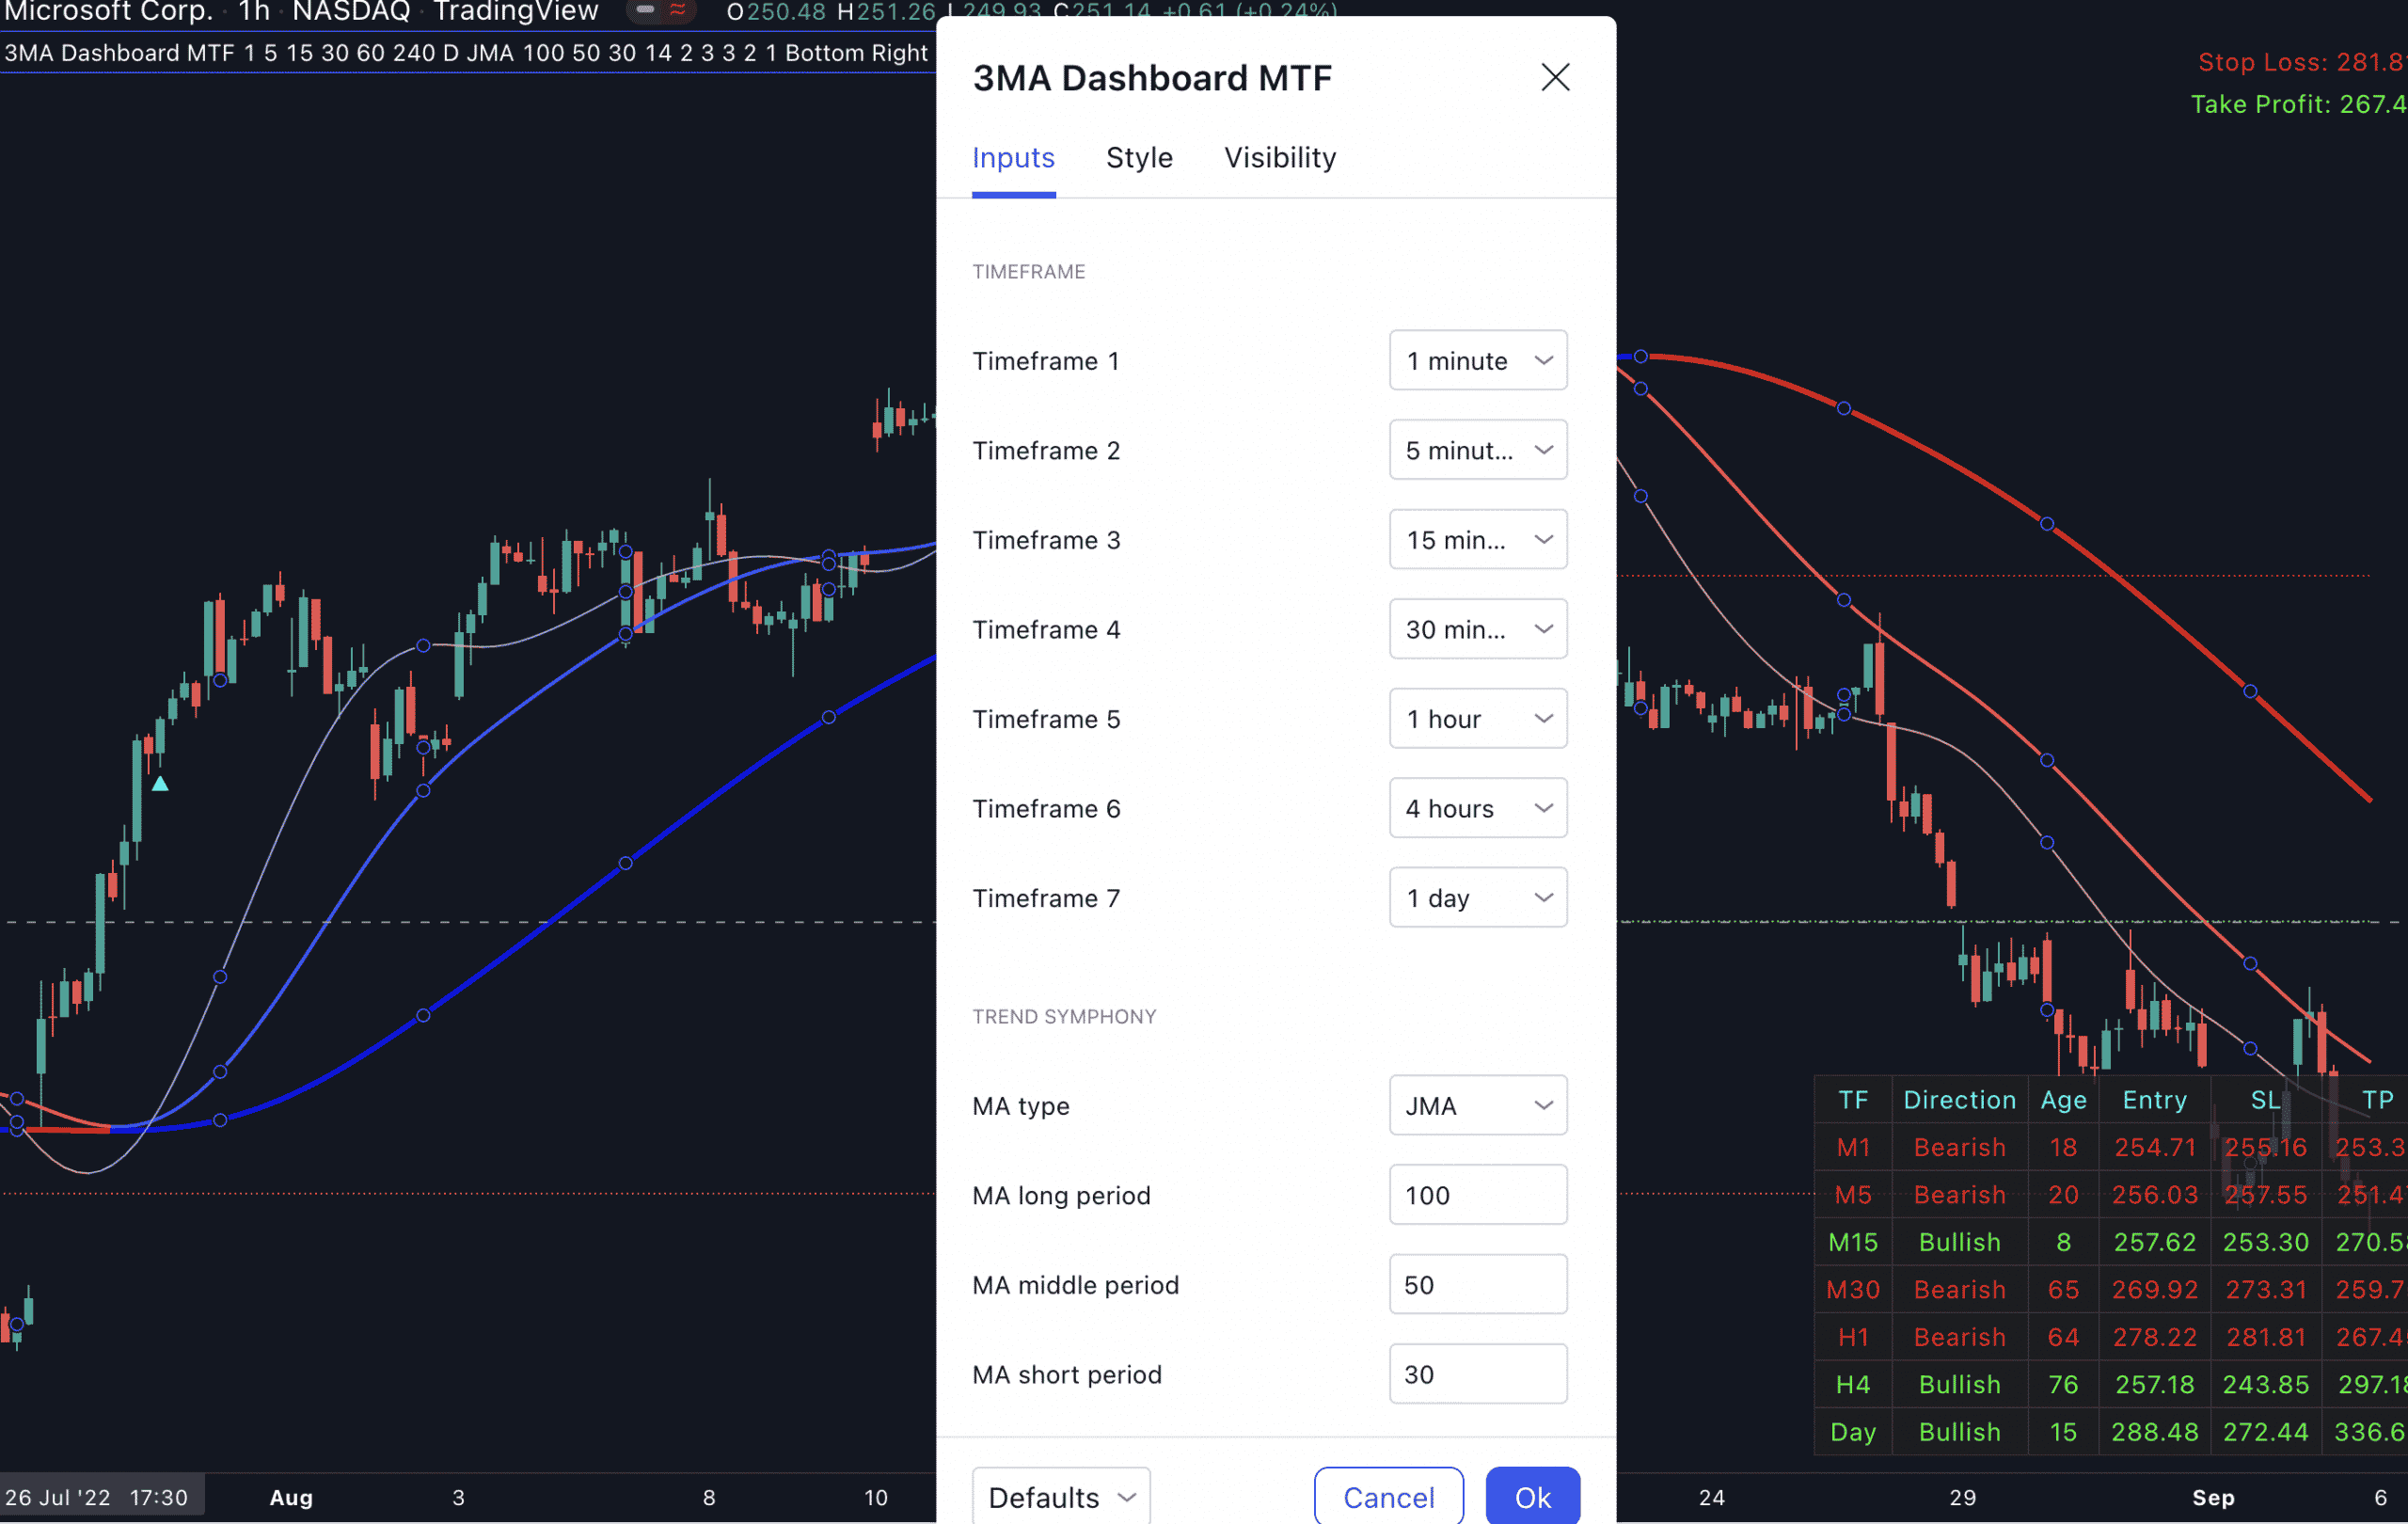
3MA Dashboard MTF in action:
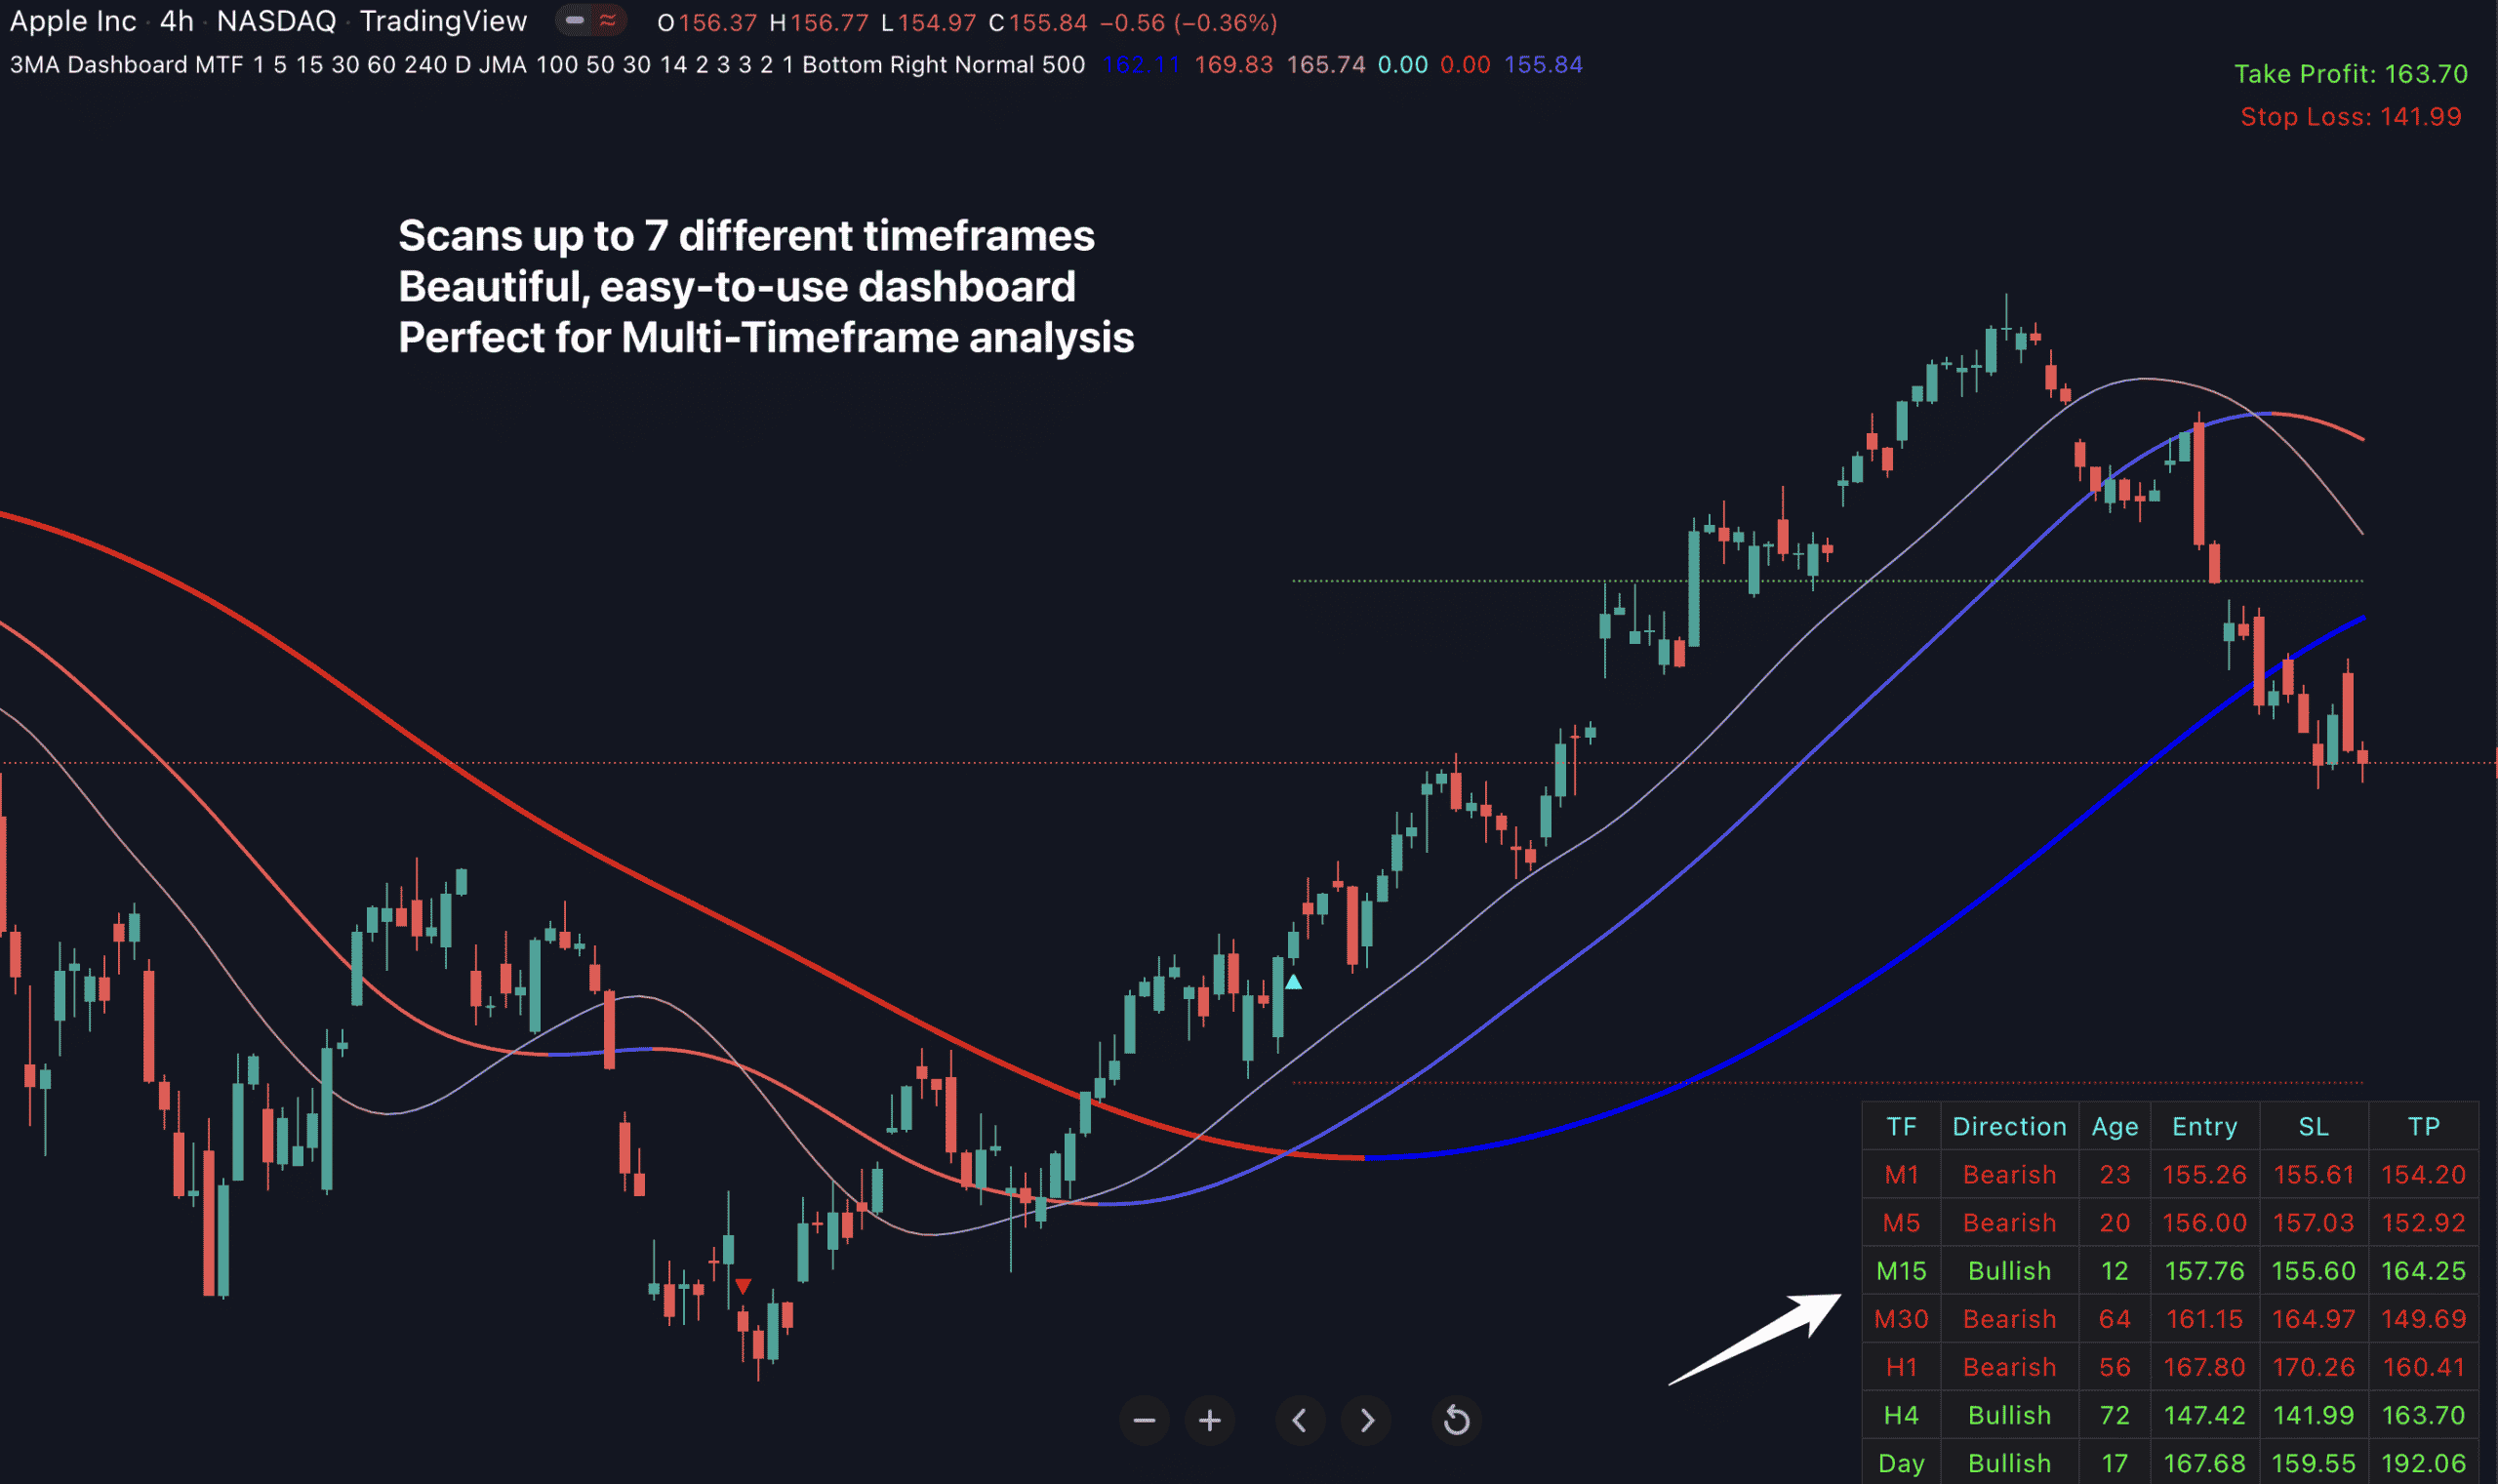
3MA Dashboard MTF is hands-down my favorite tool for spotting the dominant trend across MULTIPLE timeframes.
If you do any form of multi-timeframe analysis, I’m confident you’ll love it.
Just one glance at 3MA Dashboard MTF, and you’ll instantly see which trend-following trade setups has just formed on SEVEN different timeframes.
On top of that, you’ll receive all kind of alerts (sound, visual, pop-up, email) as soon as a new trade setup has formed on each of the 7 timeframes.
Once a trade setup is found, 3MA Dashboard MTF will also show you a suggestion on where to place your stop loss and take profit.
In other words, it gives you all the crucial information you need: High-probability trade entry, stop loss, take profit…
So…
Let our 3MA Dashboard do the heavy lifting for you…
First, it will scan 10 different symbols and 7 time-frames for high-probability trend-following setups. And all these calculations are done so fast, you won’t even notice the time.
Second, the indicator will display a beautiful dashboard on your chart where you can see exactly what trend-following setup has recently formed on MULTIPLE symbols or on MULTIPLE time-frames.
With just one look at the dashboard, you’ll instantly know all the information you need to make a good trading decision:
You’ll instantly know which trade setup appears on every time-frame (from 1-minute to monthly) and on every symbol.
Not only that, you’ll also know the exact direction of that setup – whether it’s bullish or bearish.
And you’ll know exactly how long ago that particular setup was formed.
And you’re in total control. You can specify which symbols and which time-frame you want the indicator to scan for these trend-following setups.
For 3MA Dashboard MTF, simply pick the timeframes you’d like the indicator to scan for trade setups:
And for 3MA Dashboard MTS, simply enter the Symbol you’d like the indicator to scan for trade setups.
You may enter up to 10 different symbols. It works in ALL markets: FX, indices, stocks, commodities, futures, etc…
Lets you pick your favorite custom Moving Average
3MA Dashboard also lets you choose your favorite method of defining the trend: Choose from 10 different kinds of custom moving average:
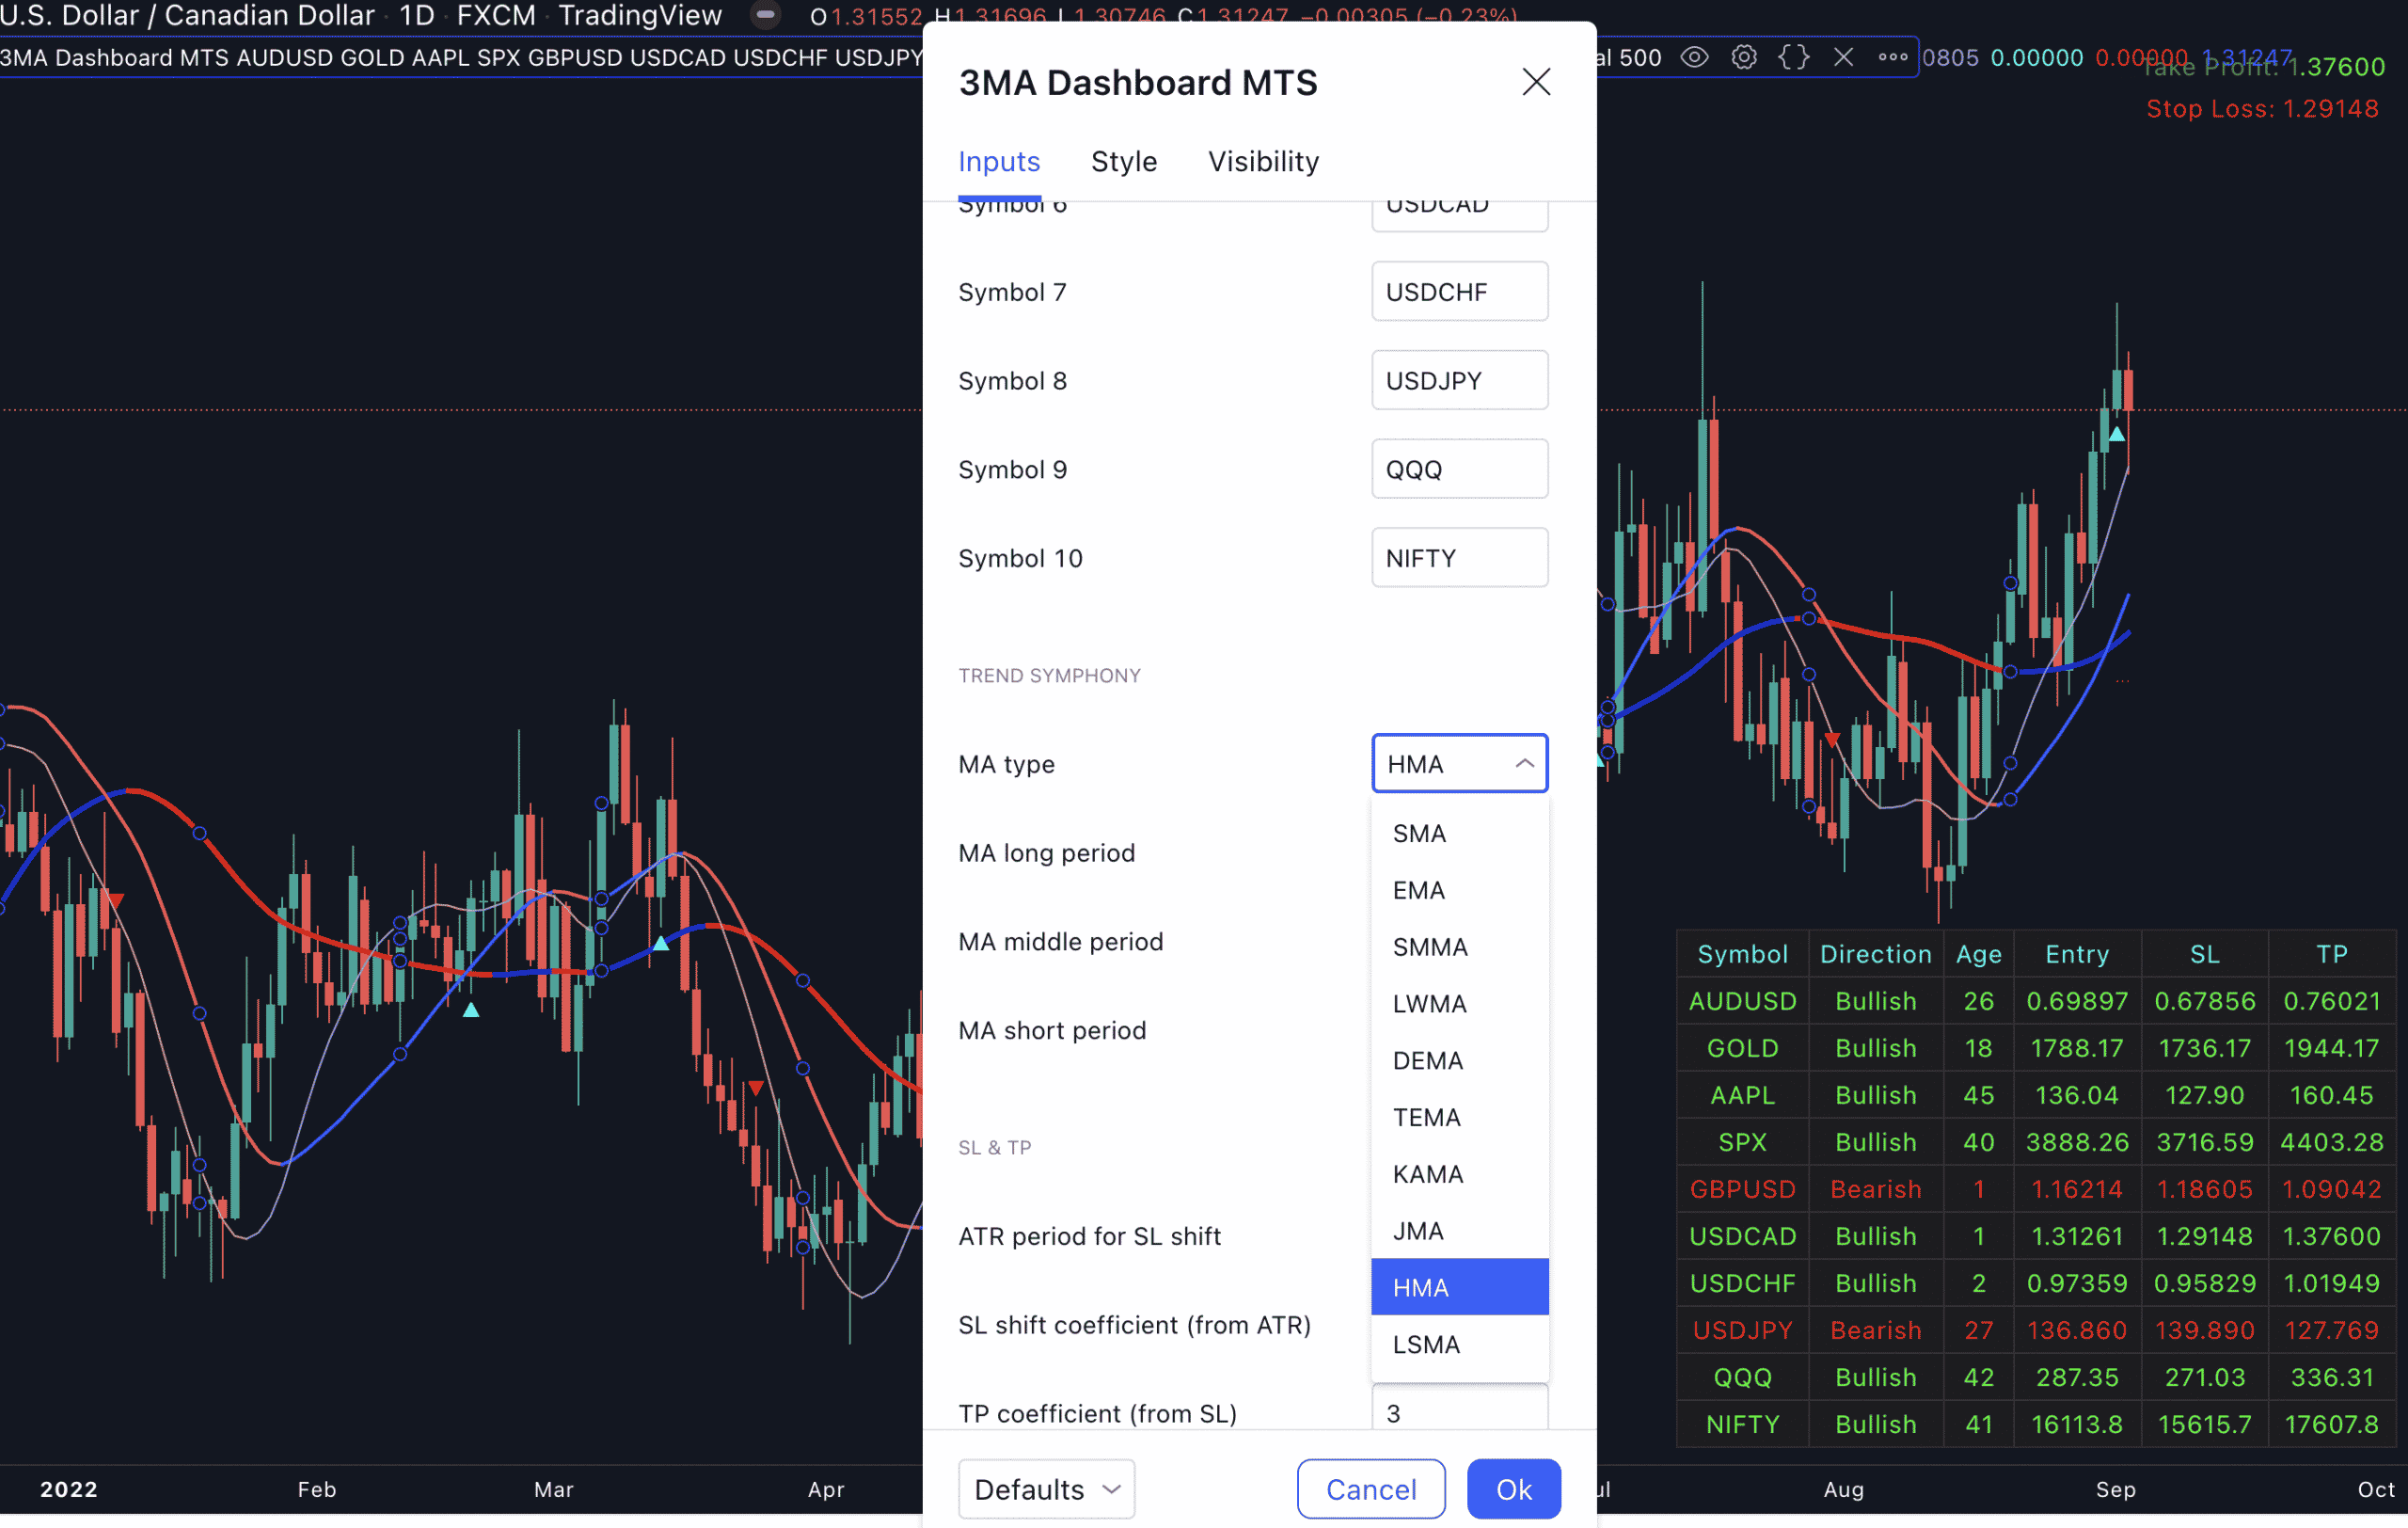
Pretty cool, isn’t it?
By the way, it’s very very easy to trade with 3MA Dashboard indicator because you’ll also get:
The indicator gives you all kinds of alerts: Pop-up, Sound, Email, and Push Notifications as soon as a setup appears…

You’ll get all kinds of alerts: Pop-up, Sound, Email, and Push Notifications as soon as a new trade setup appears…
And you can customize these alerts in any way you want.
Watch this video guide to see how it works:
Frequently Asked Questions
After purchasing, you’ll fill out a short form that asks for your Tradingview username. And then, we’ll grant your username access to all our indicators within 24 hours.
It works on ALL markets internationally that are available on Tradingview: FX, stocks, indices, commodities, futures, etc…