
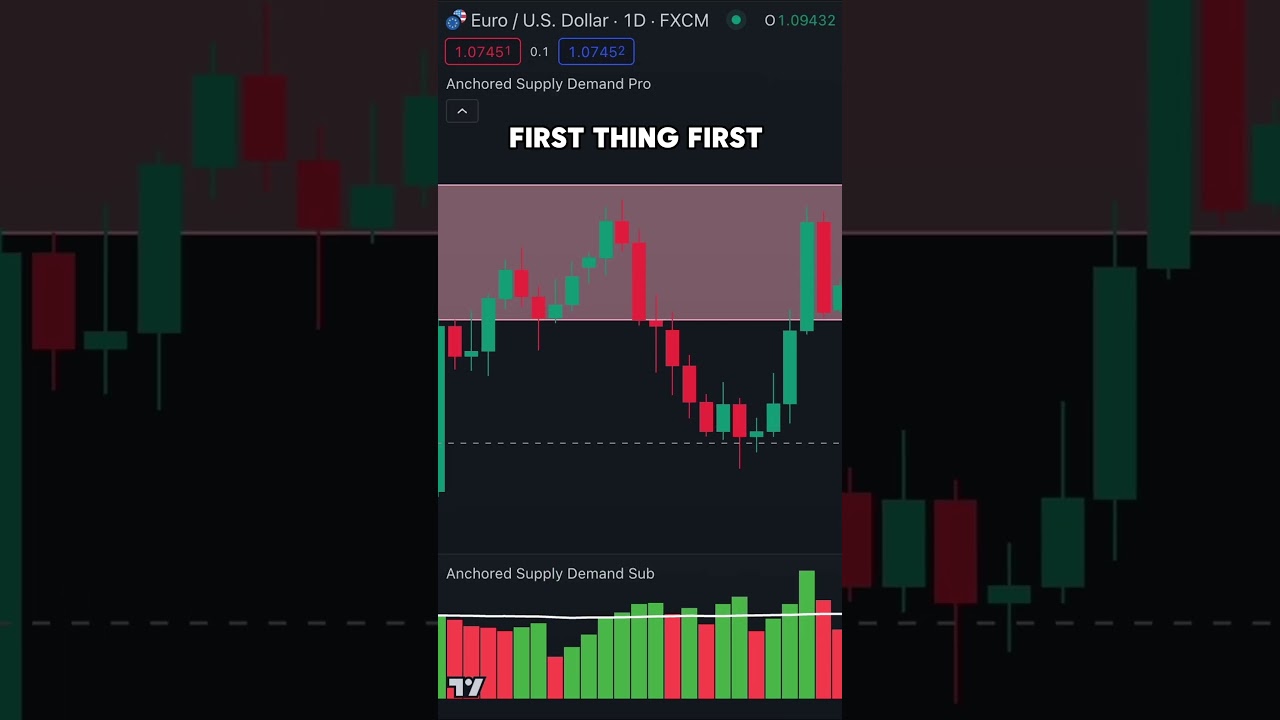
Anchored Supply Demand for TradingView
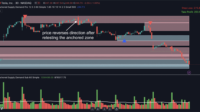
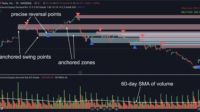
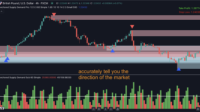
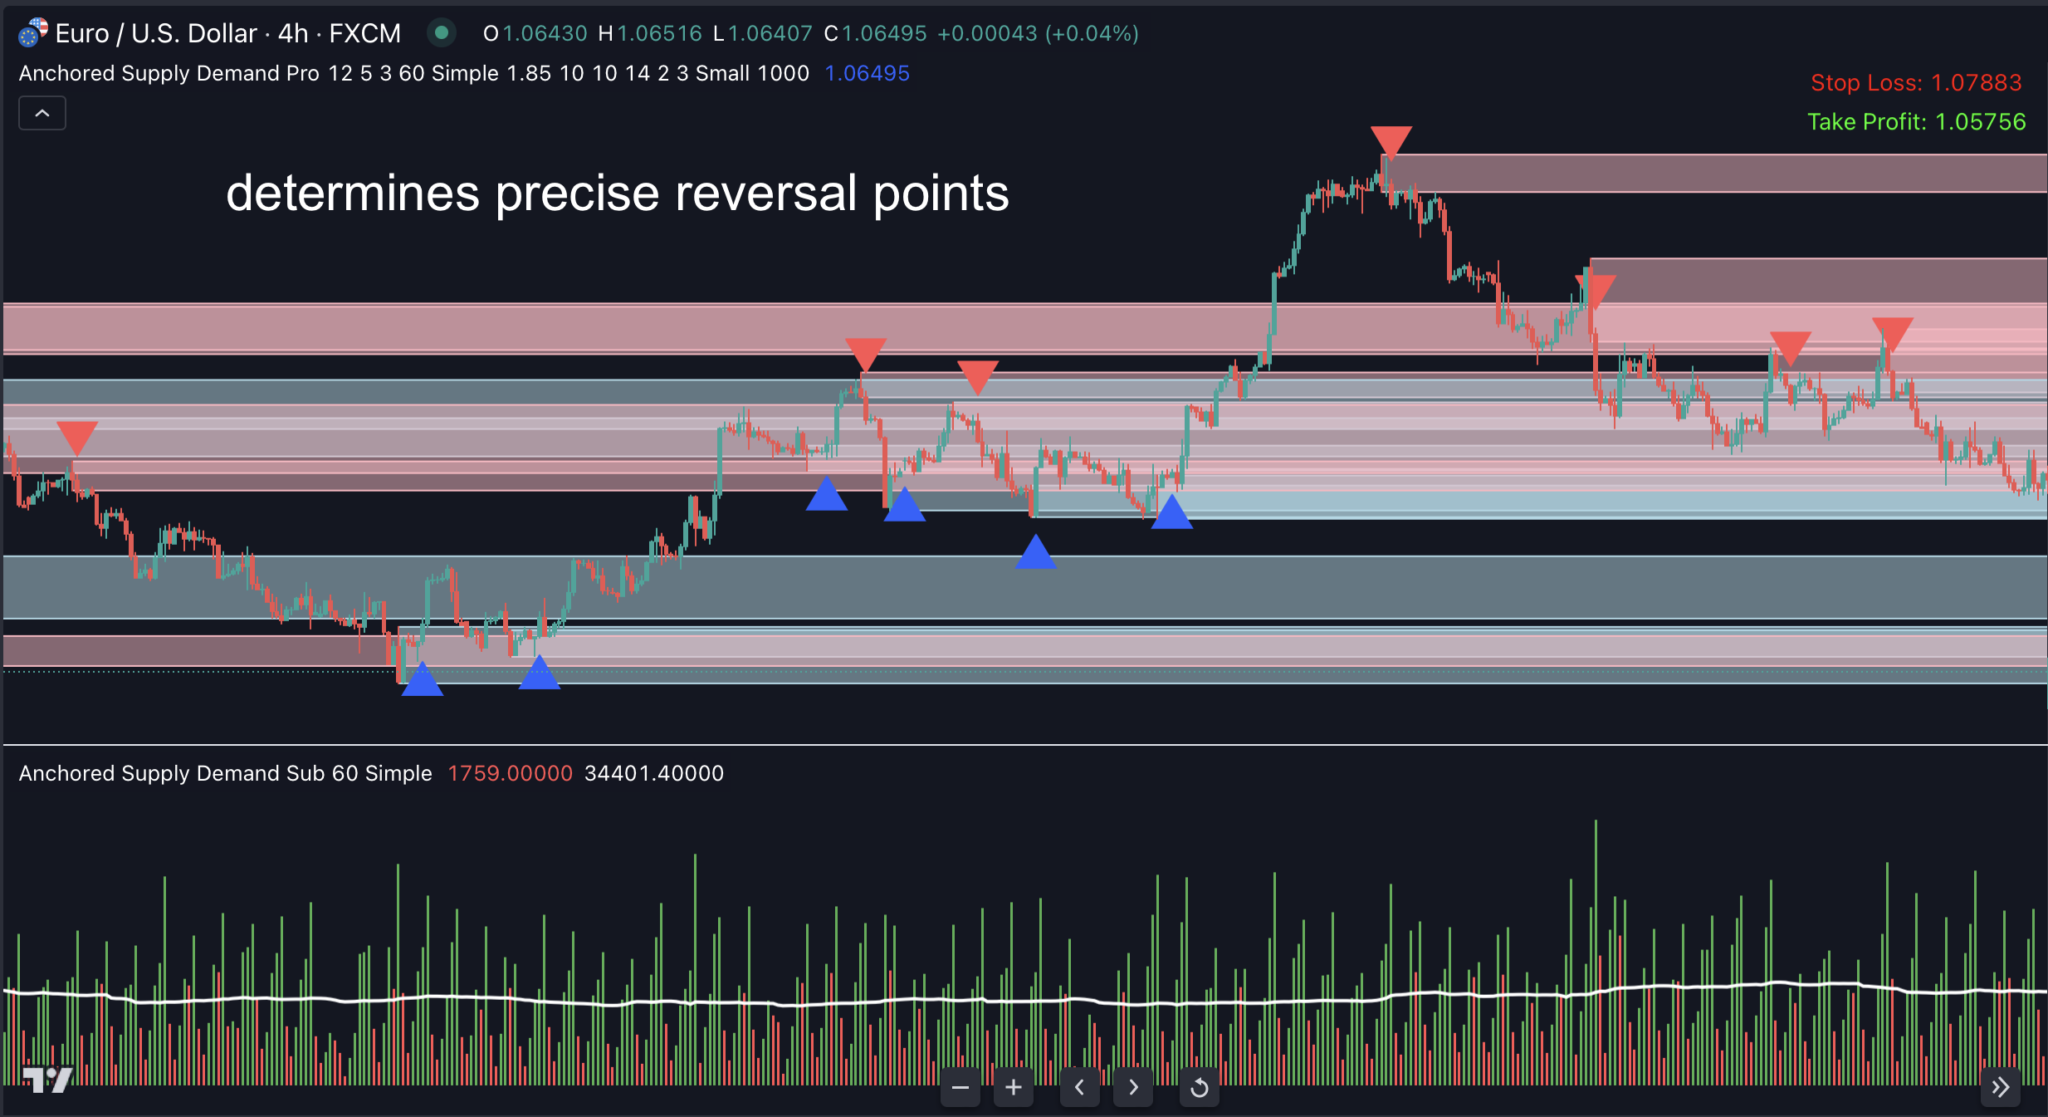
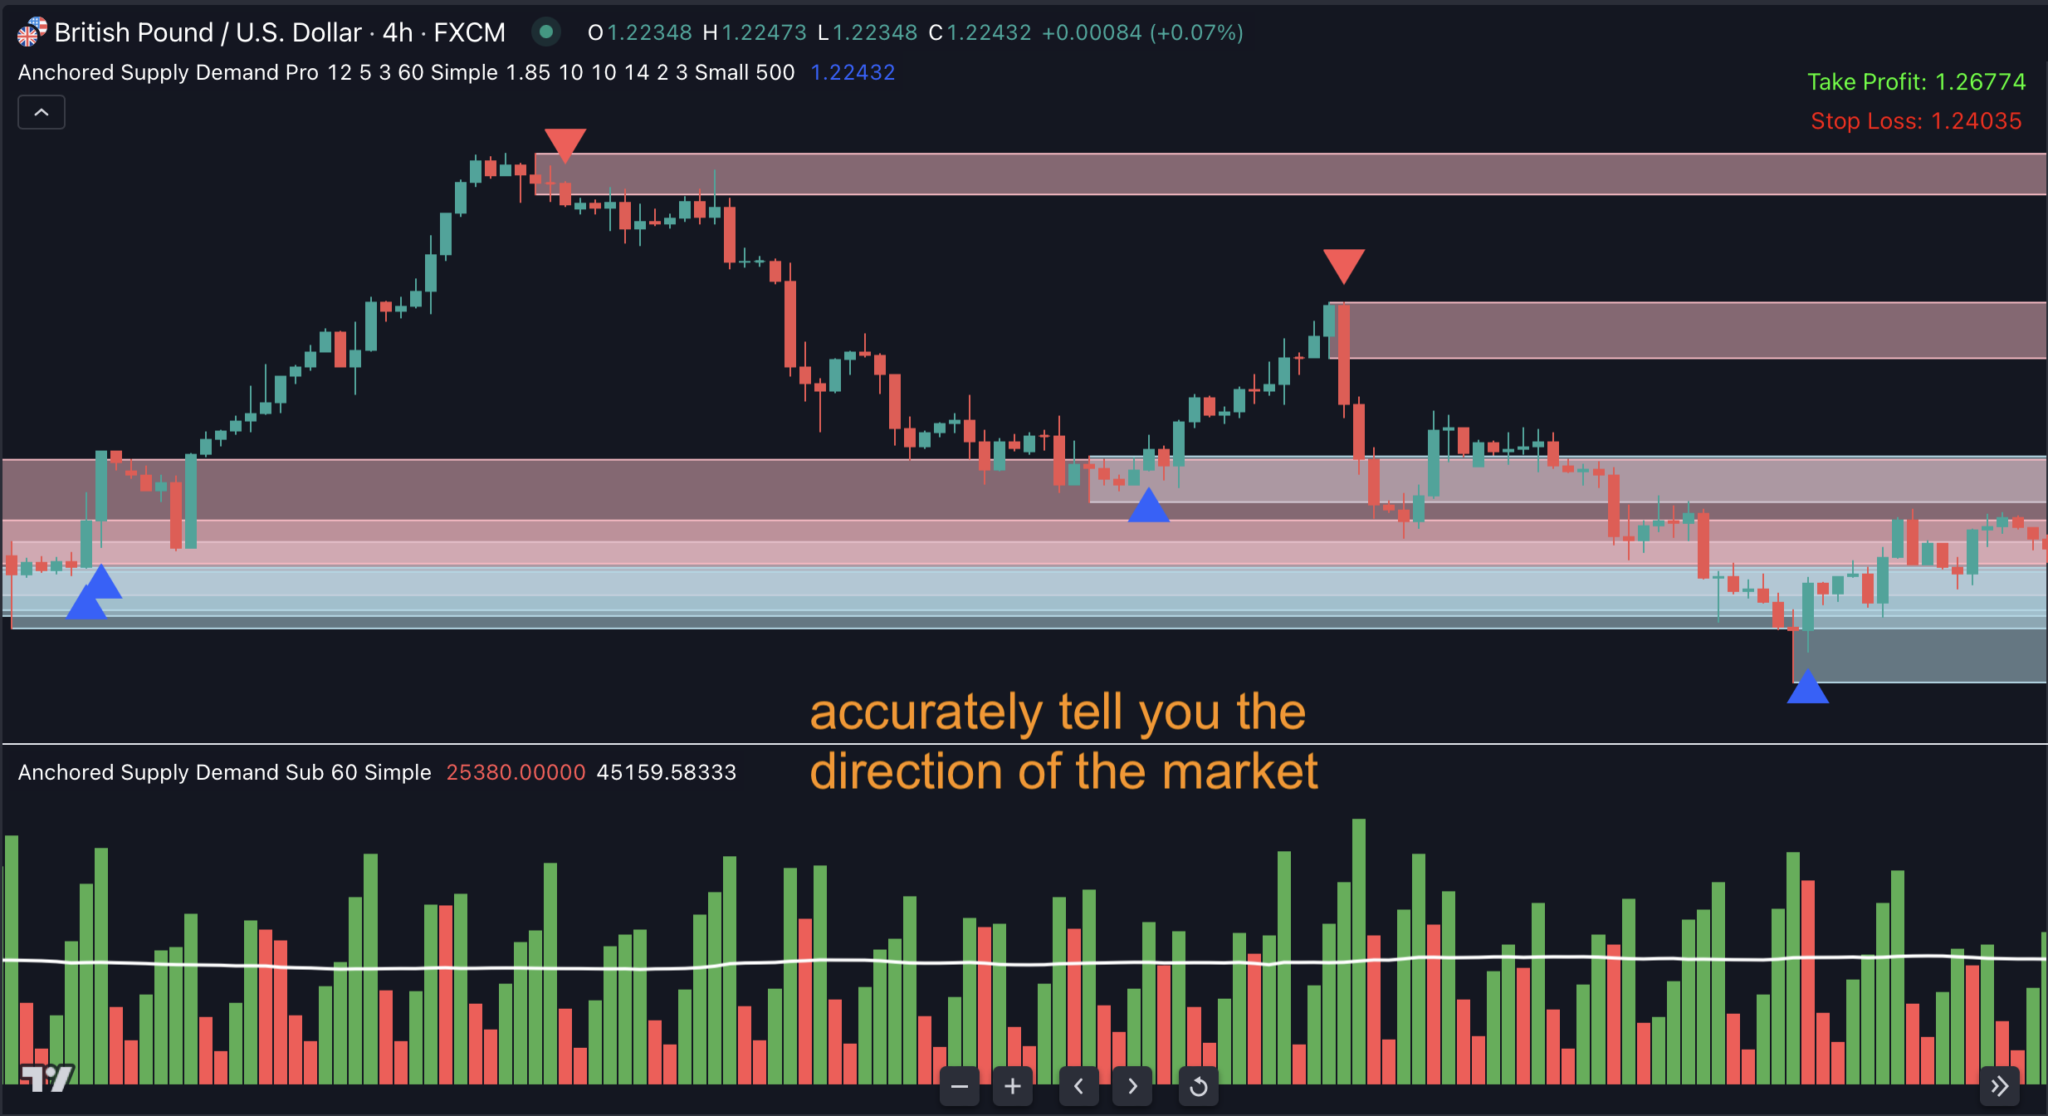
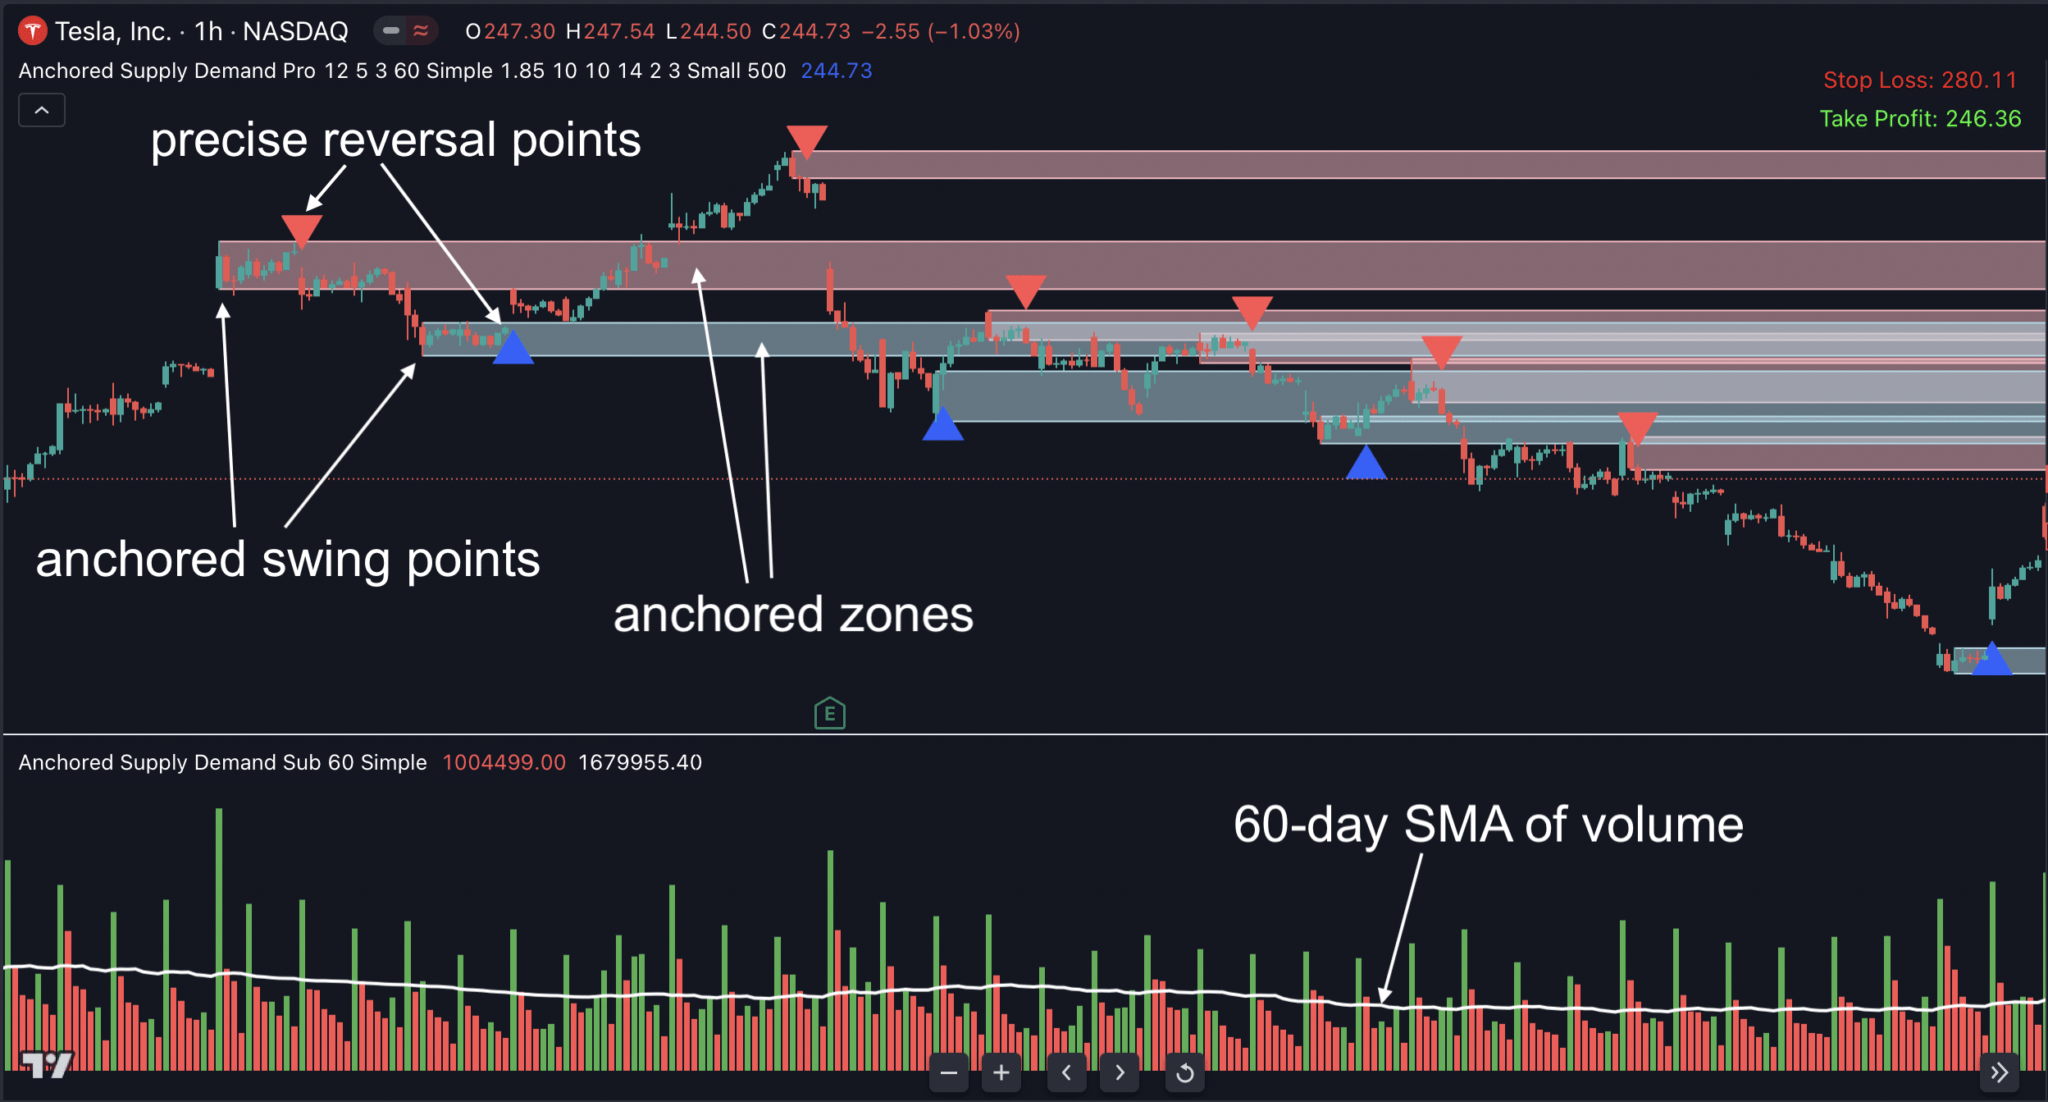
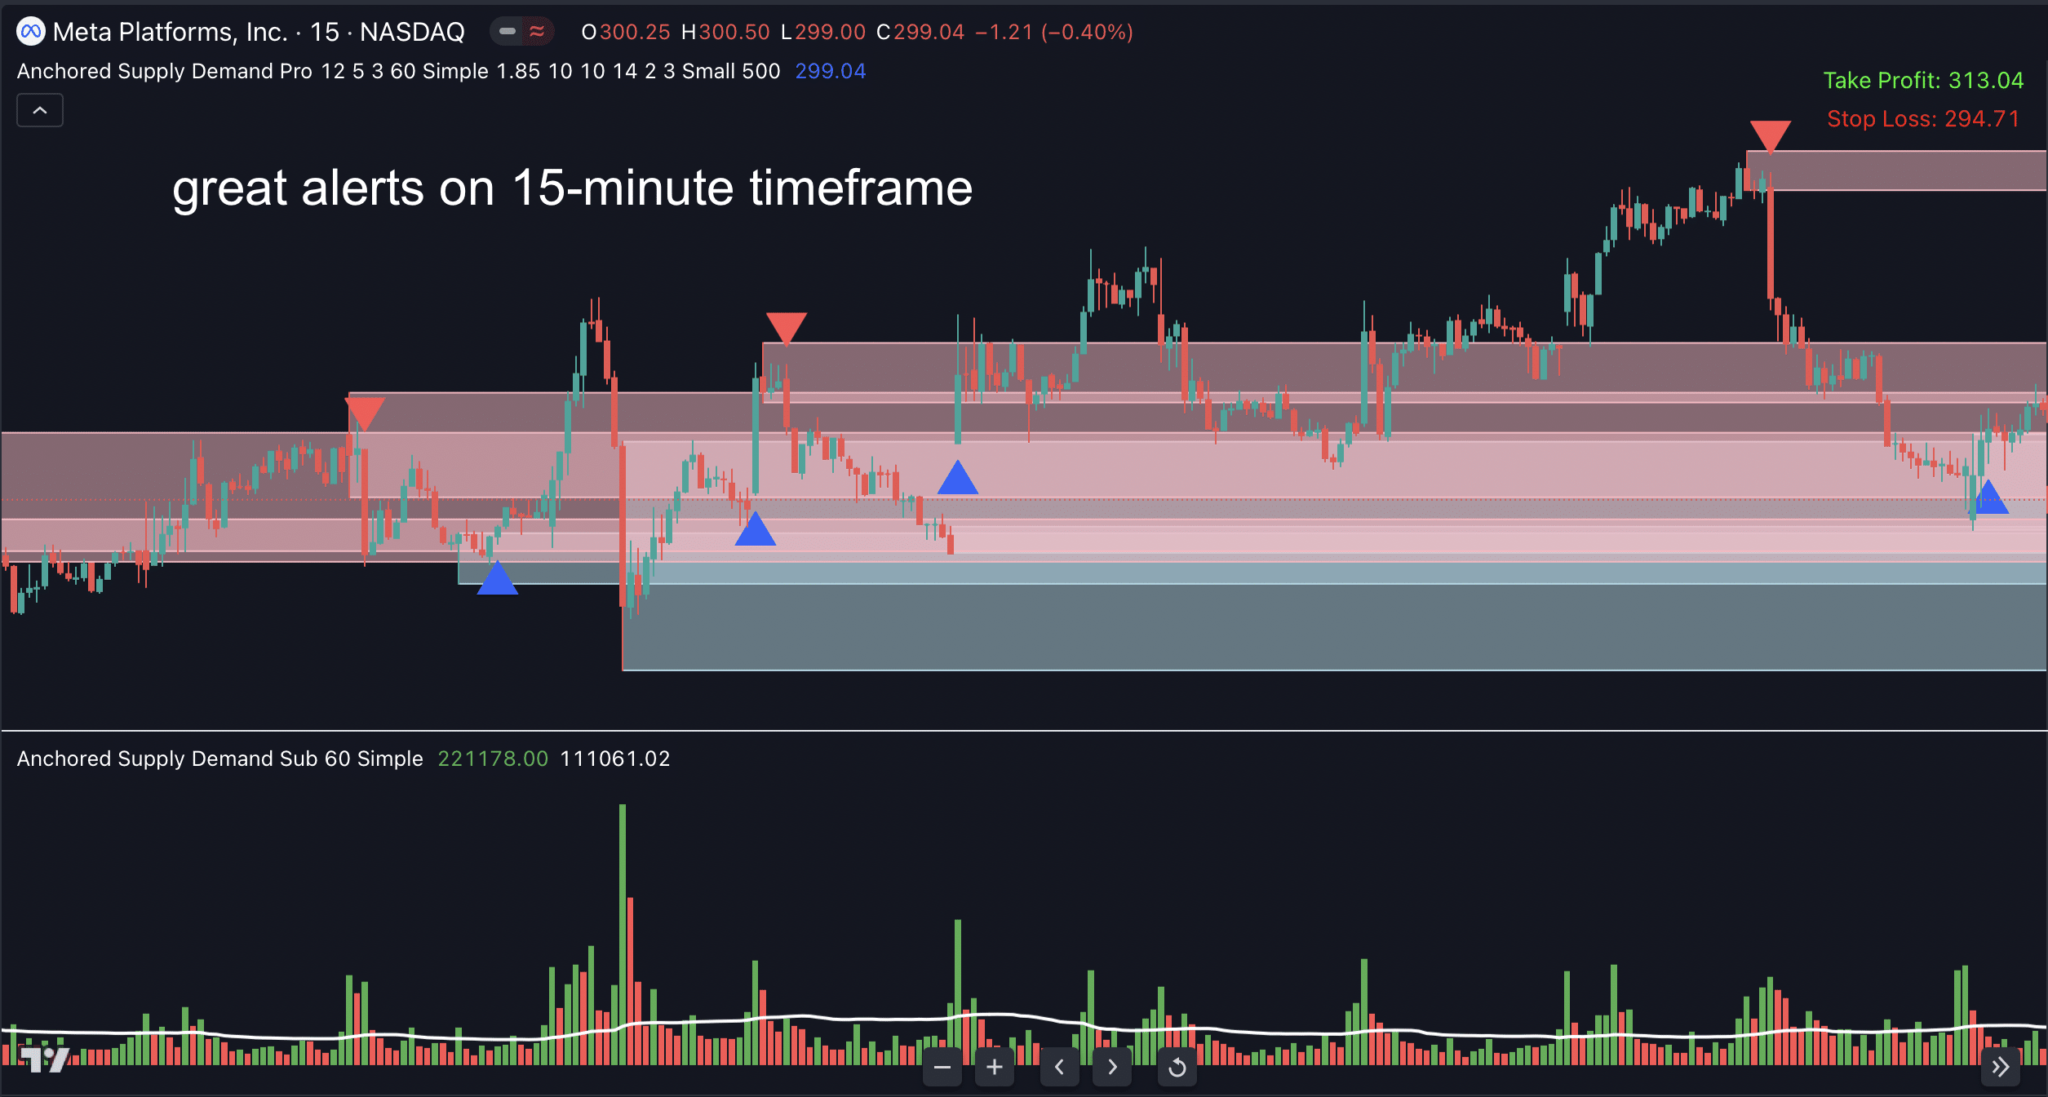
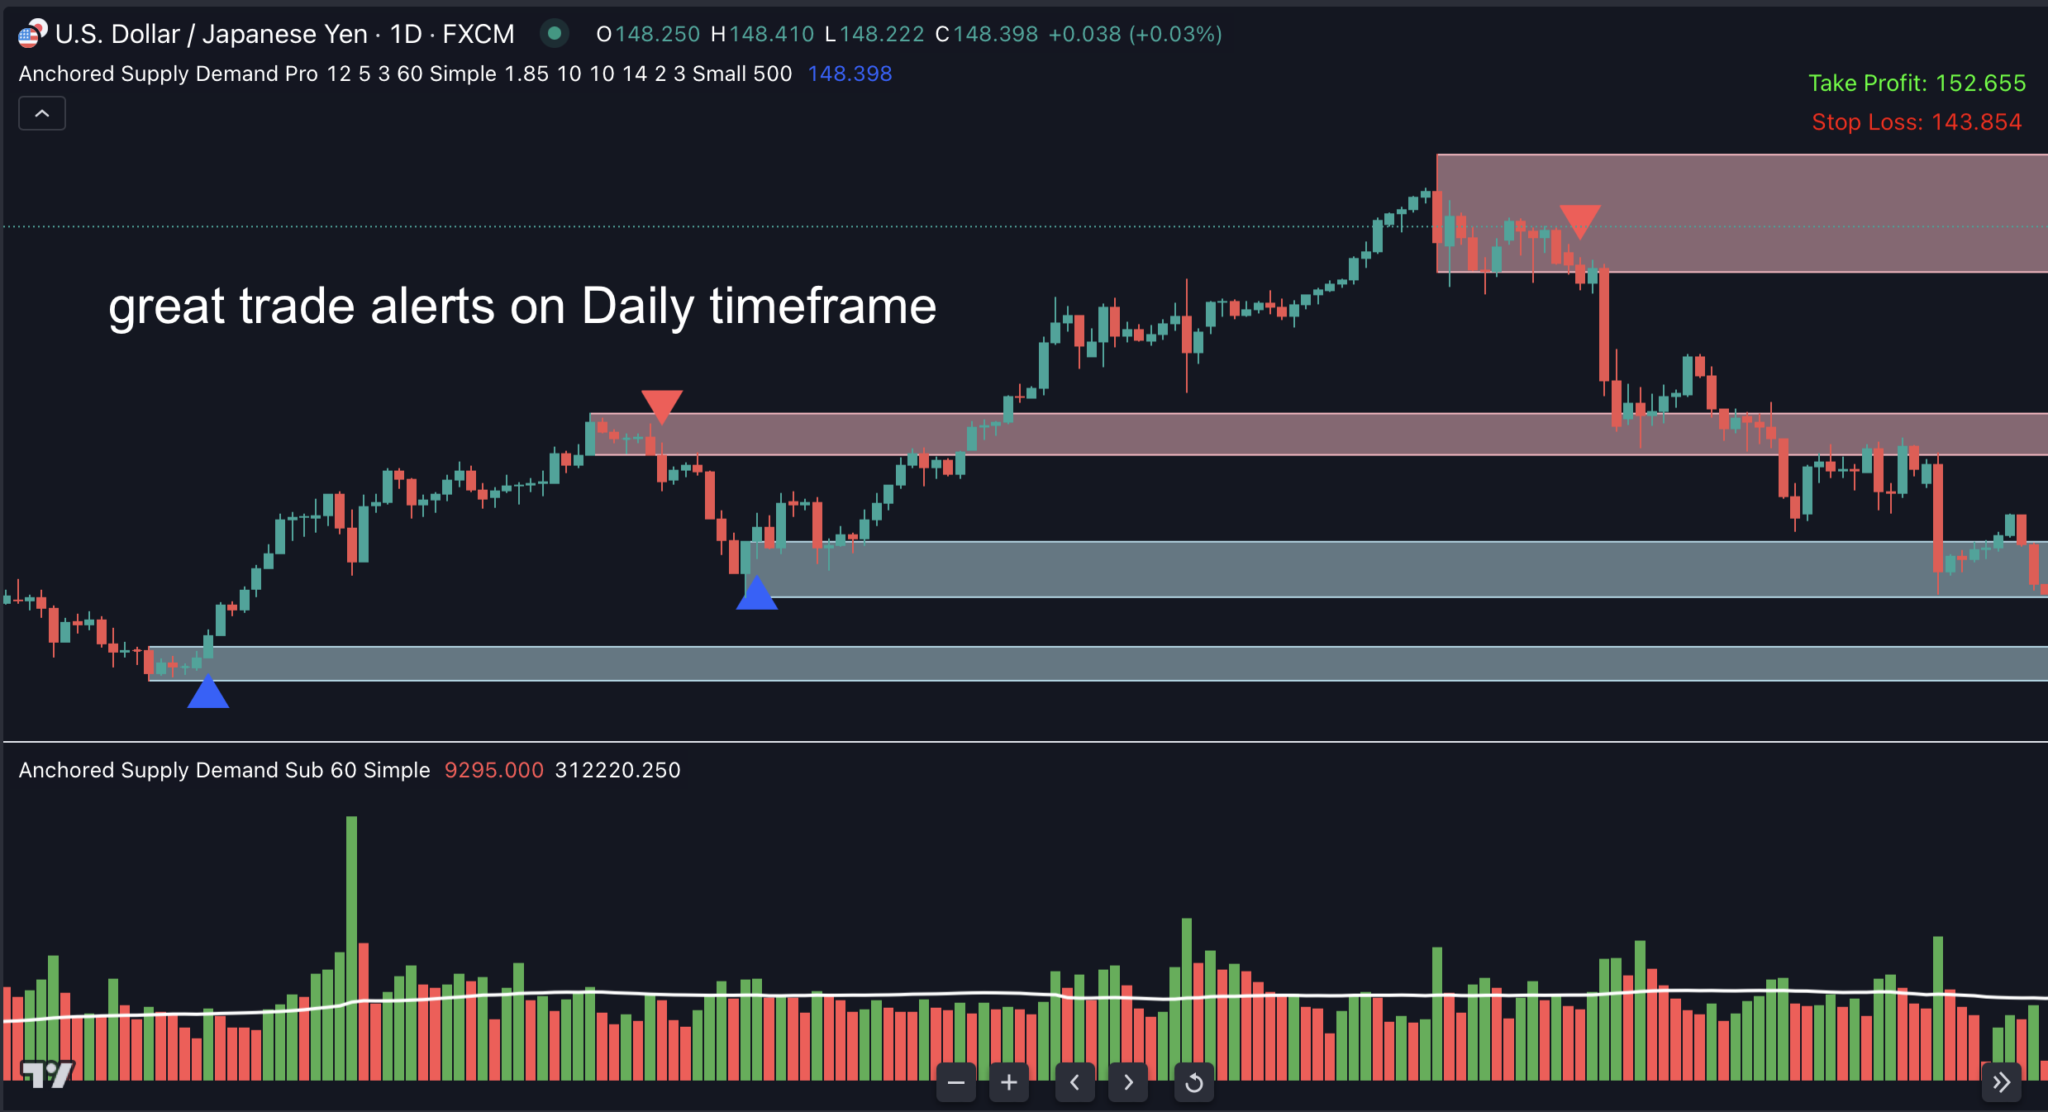
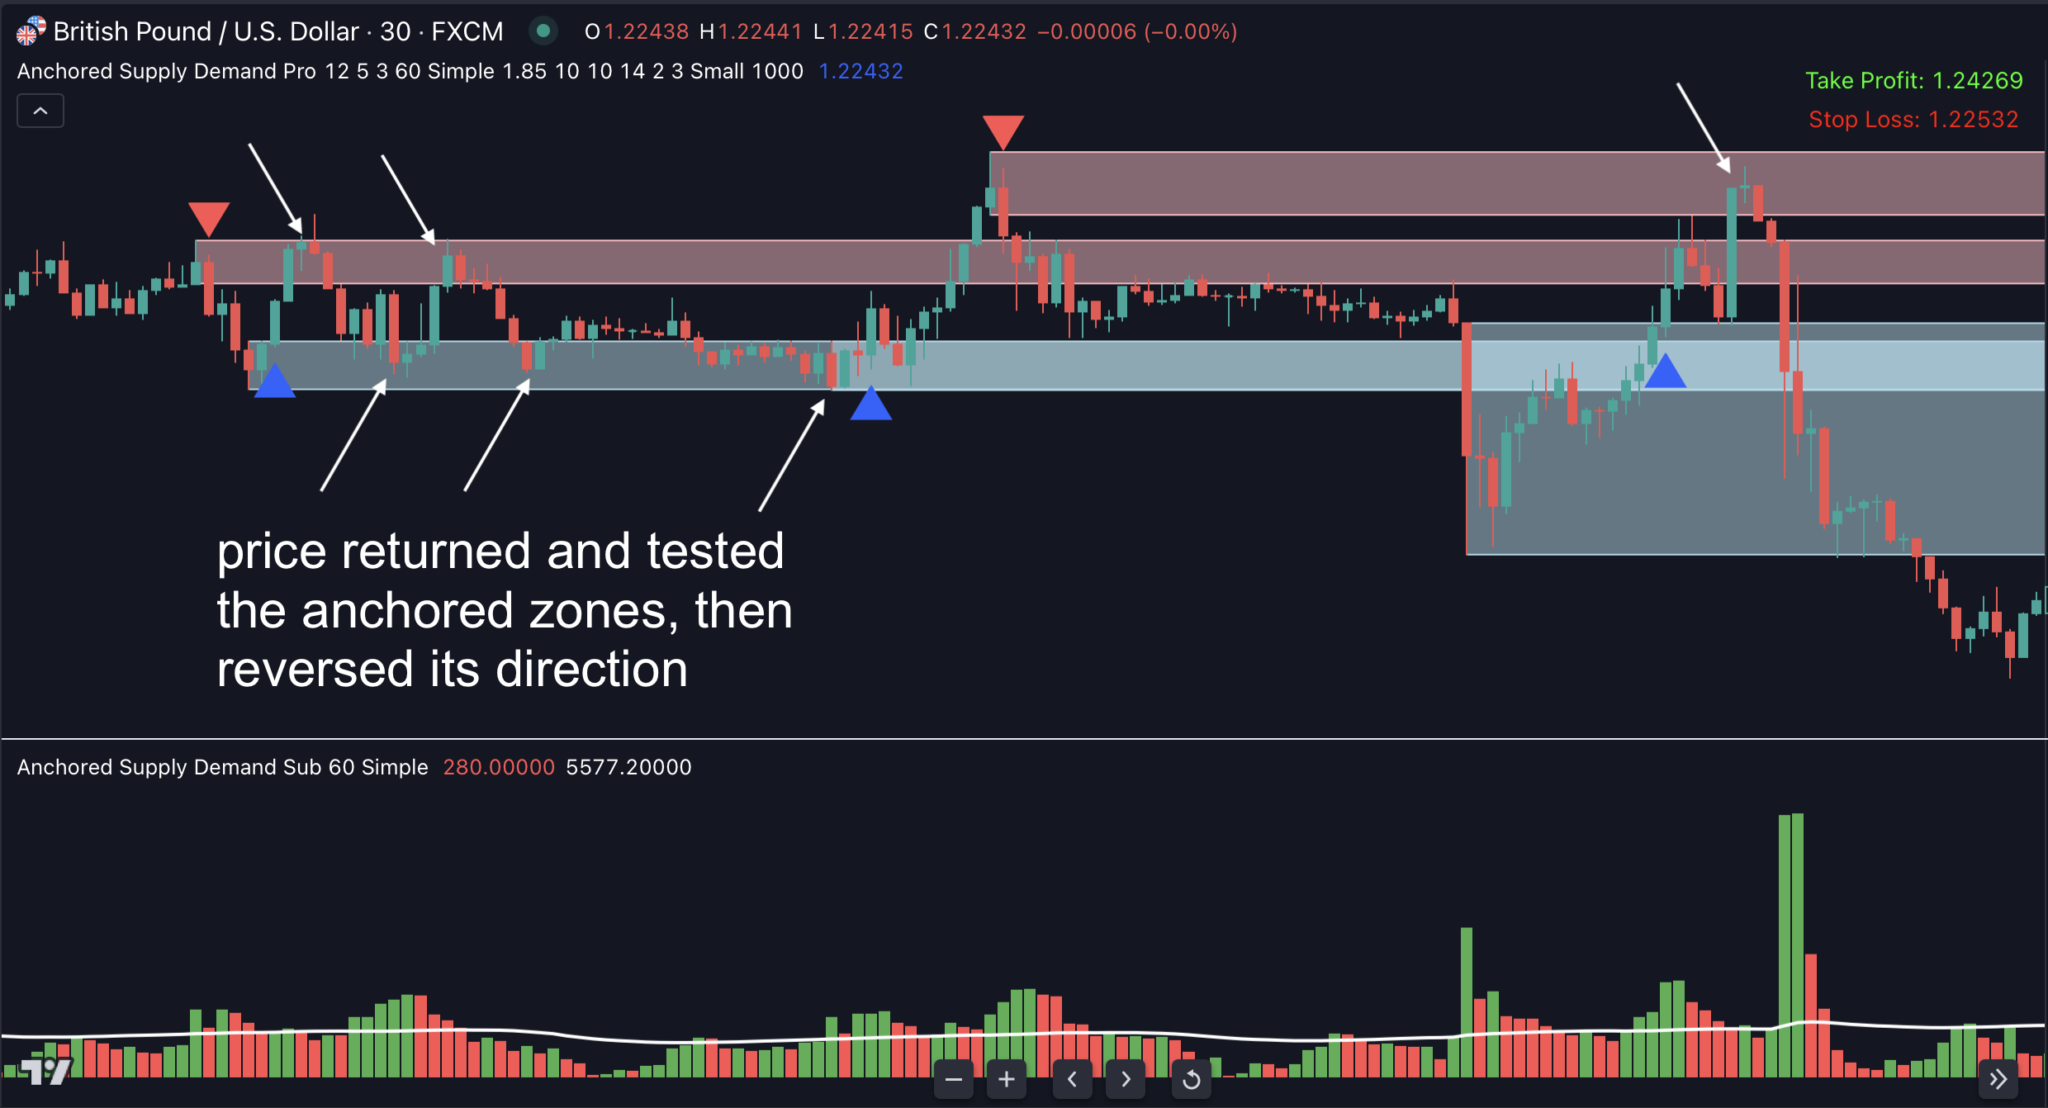
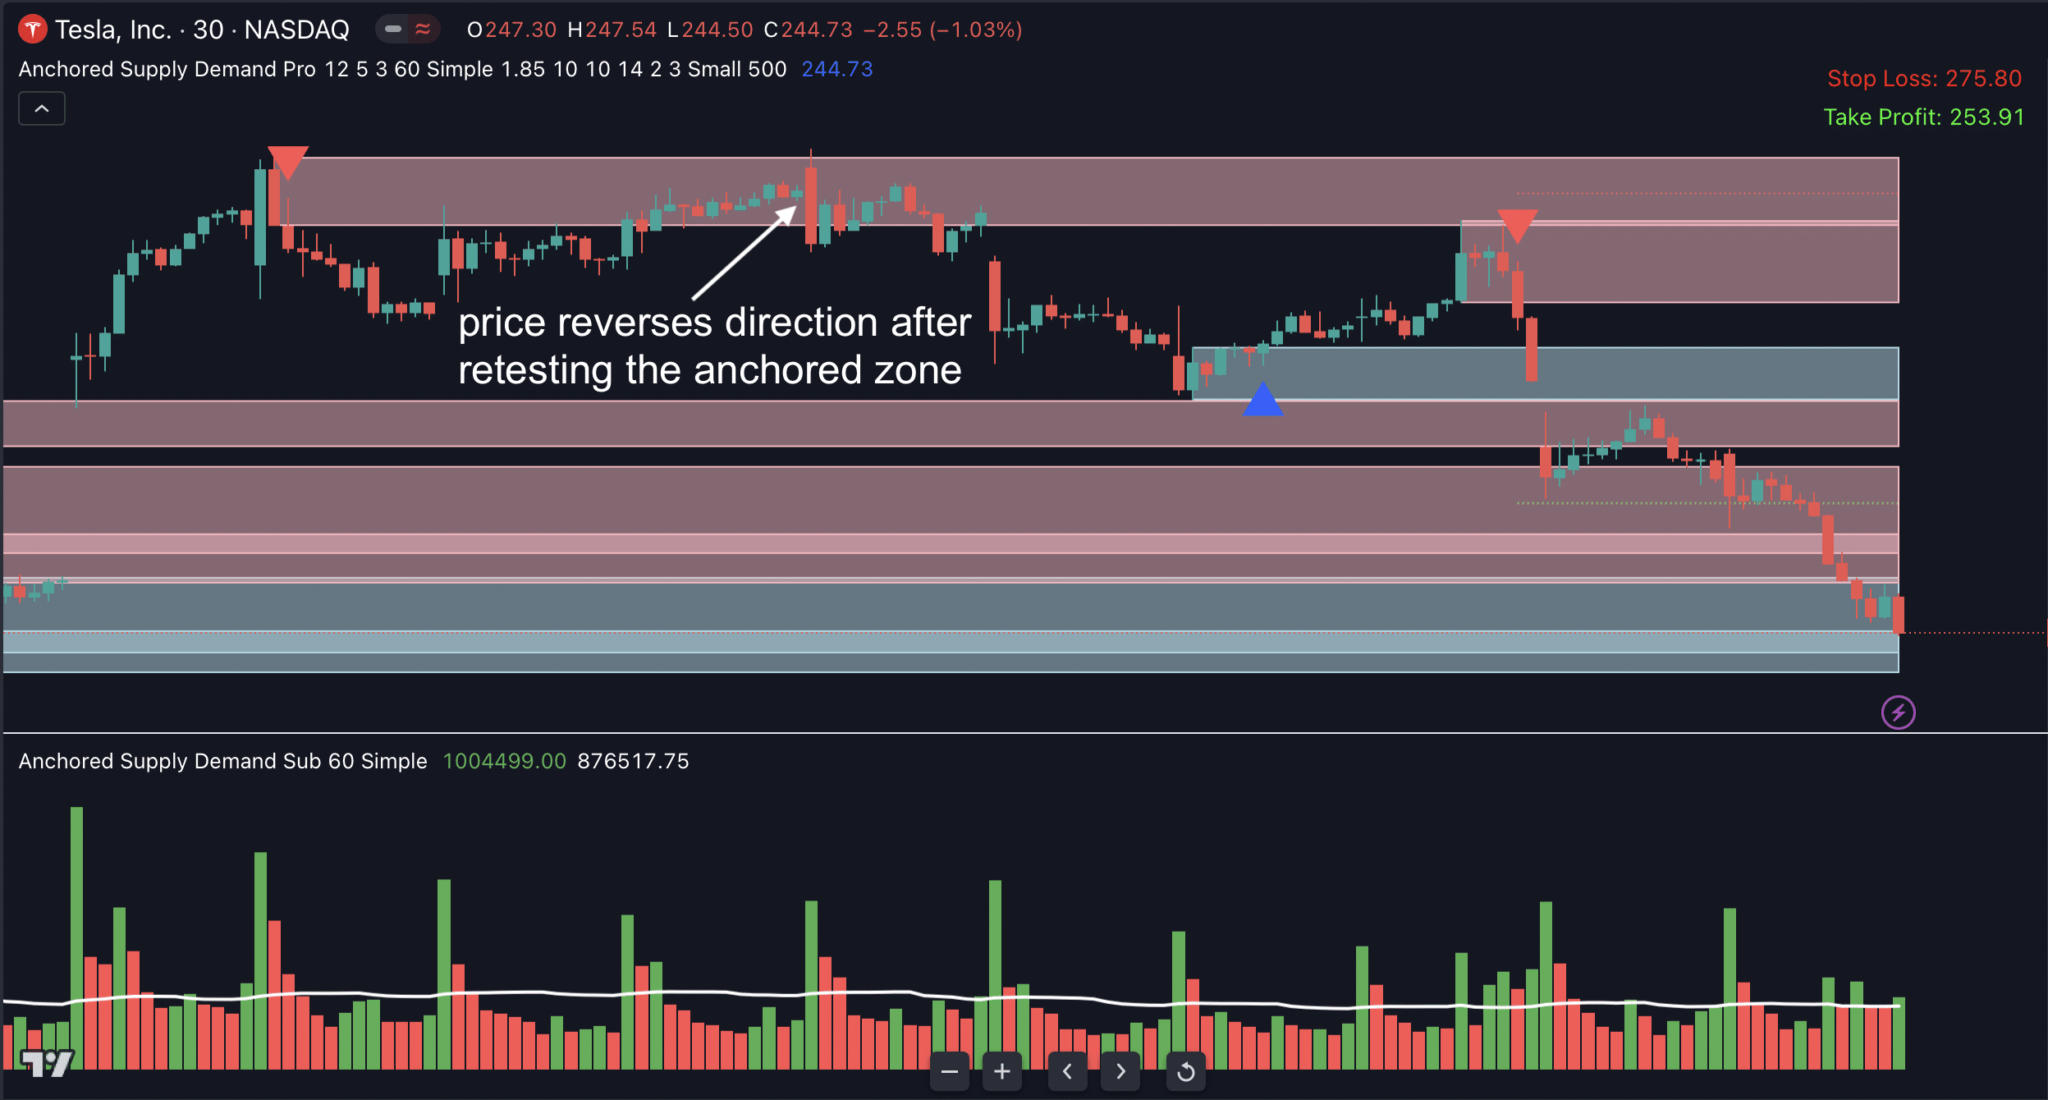
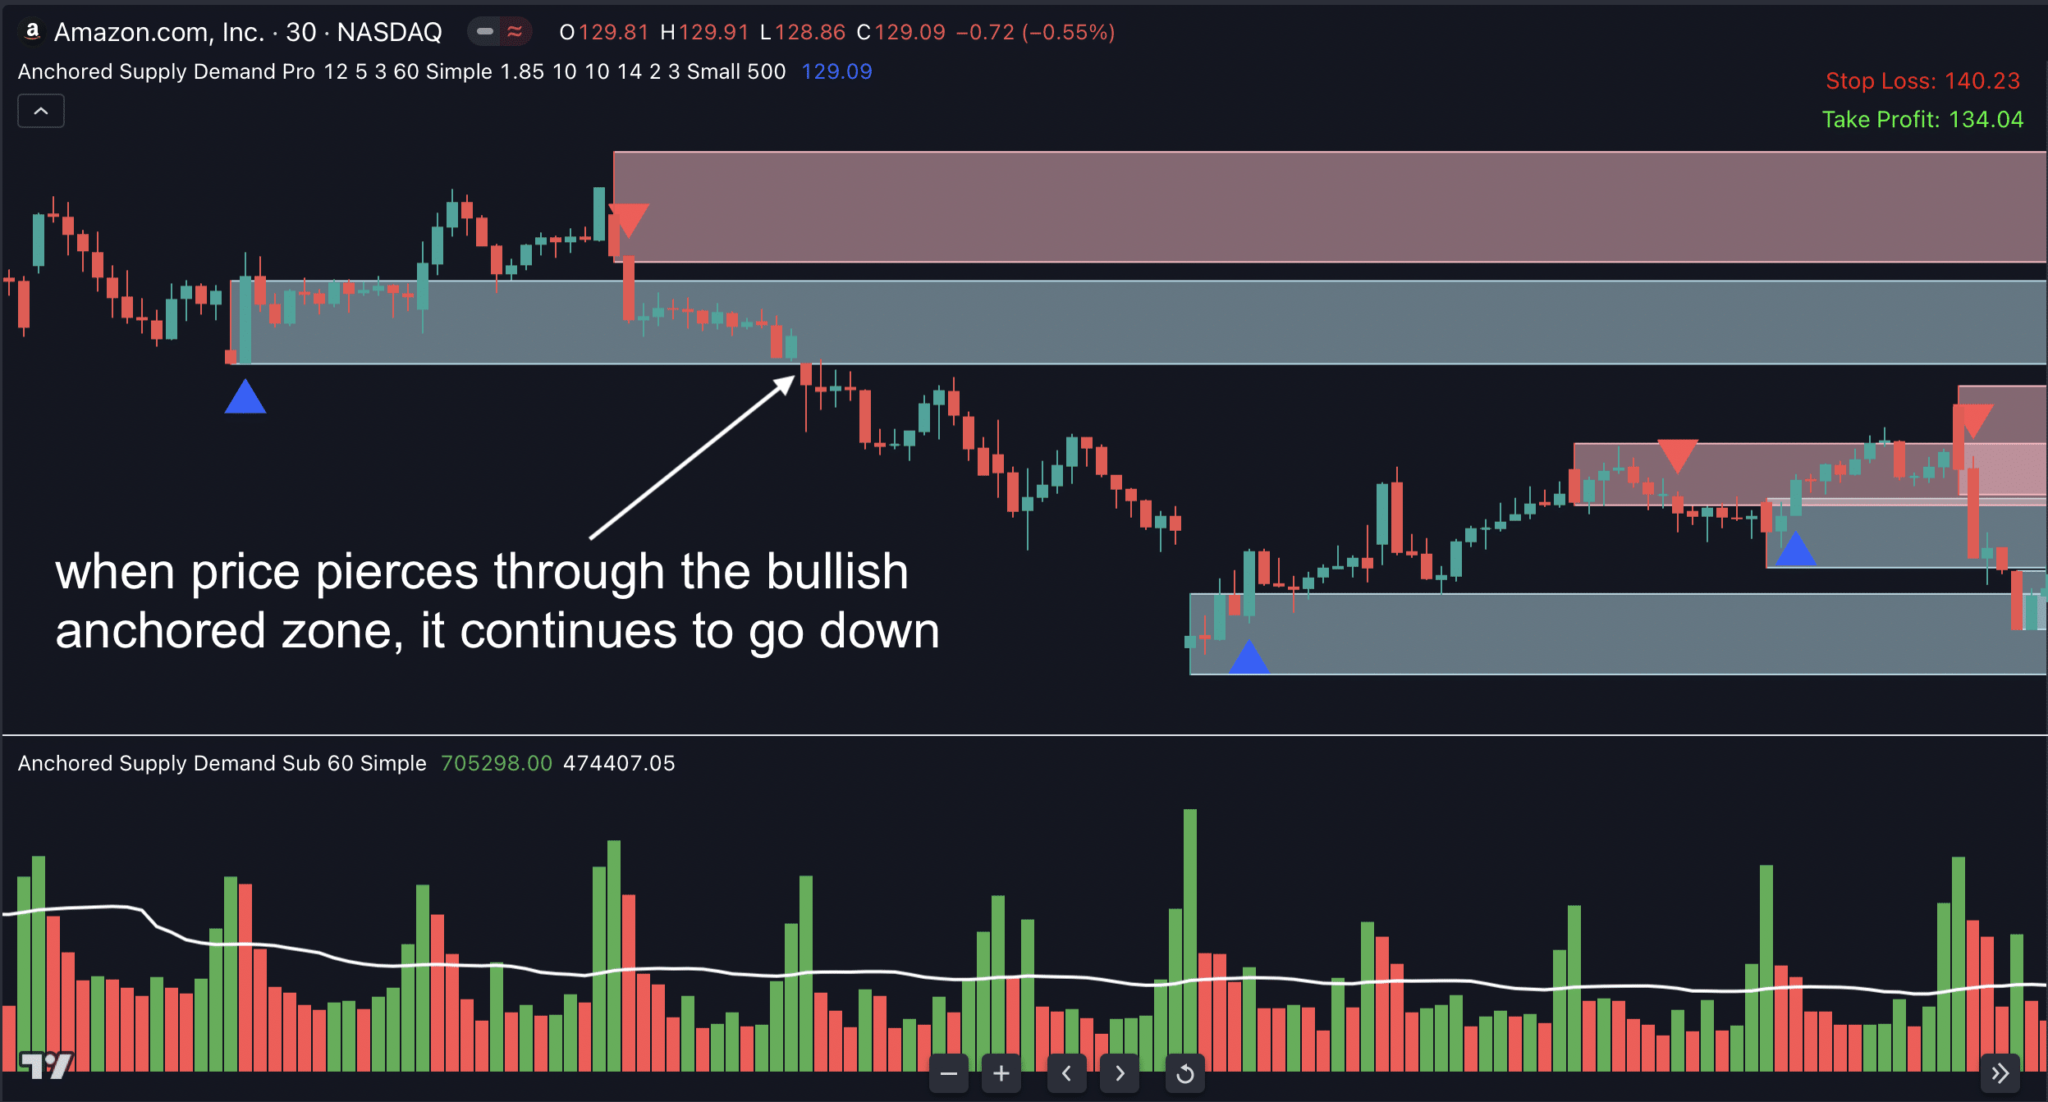
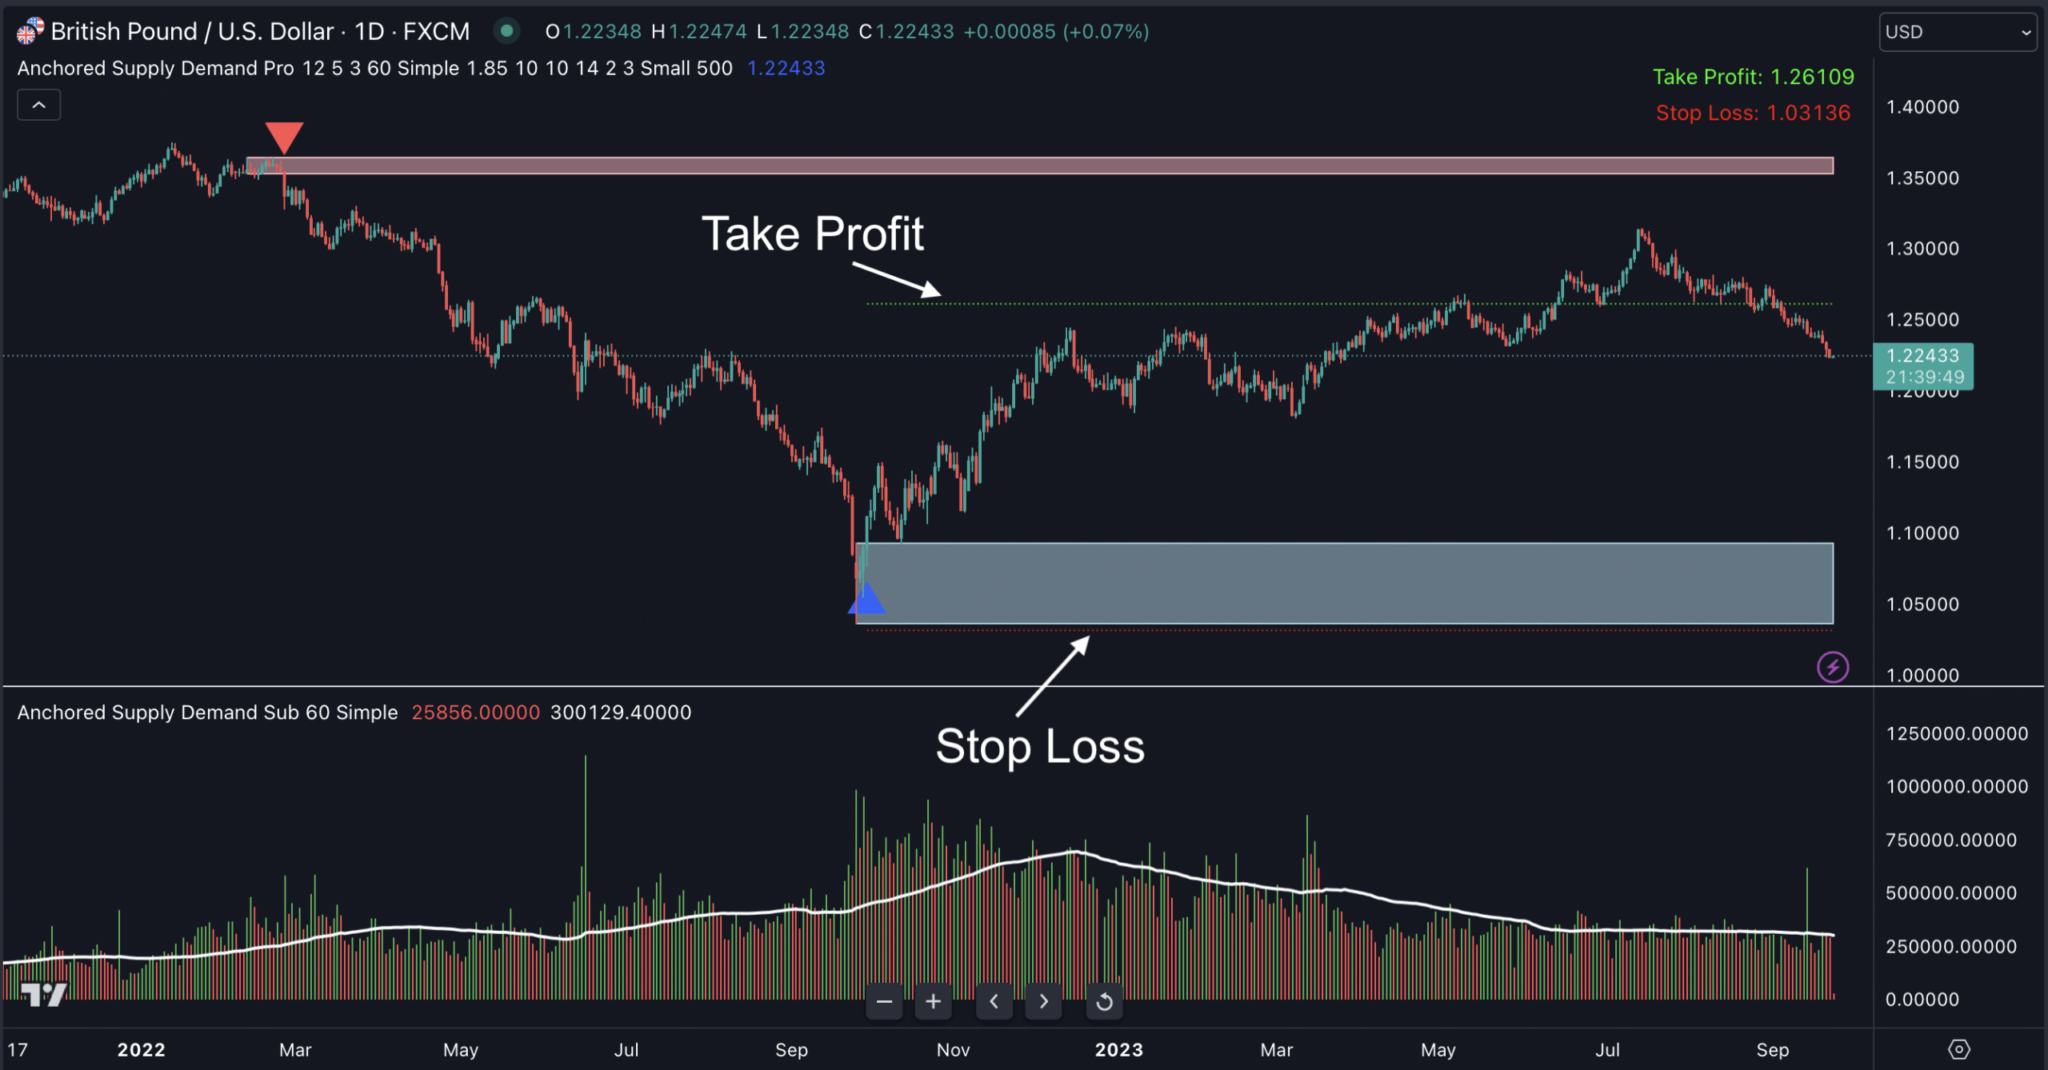
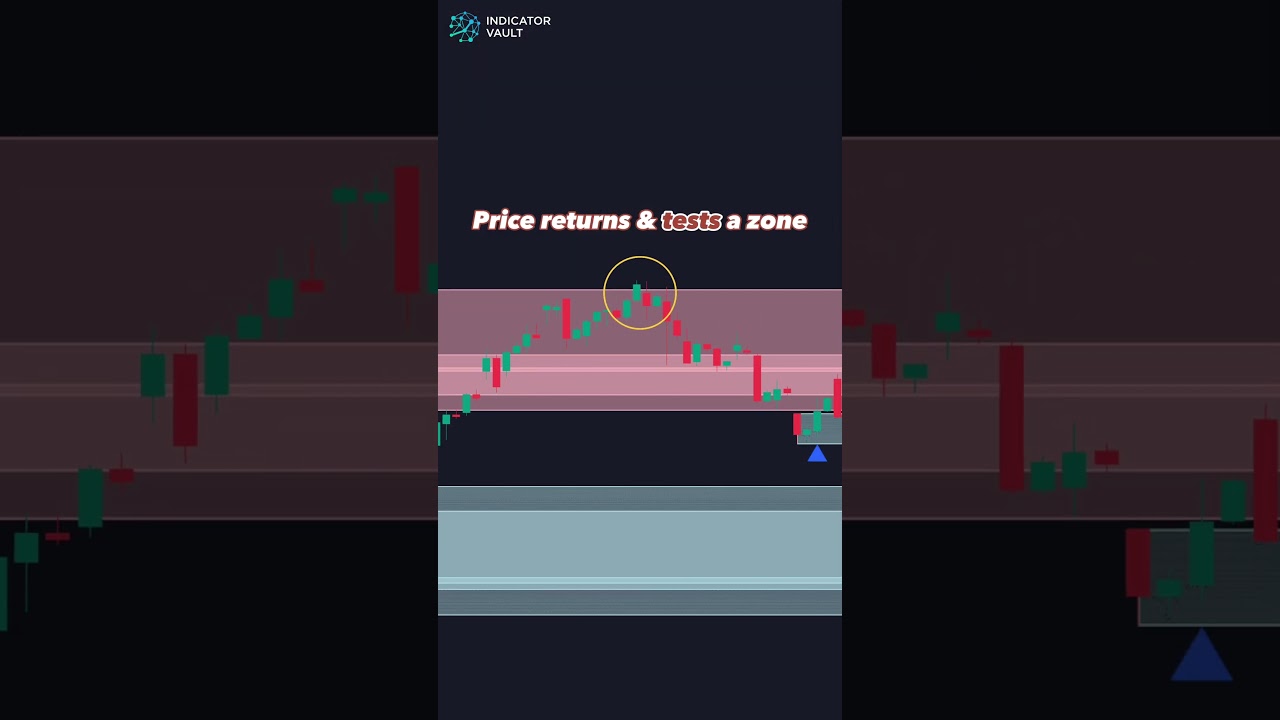
📌 These “anchored” supply demand zones lets you forecast price reversals with precision.
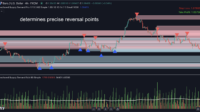
📌 Pinpoints exact reversal points for confident trading decisions.
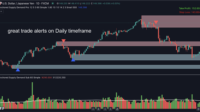
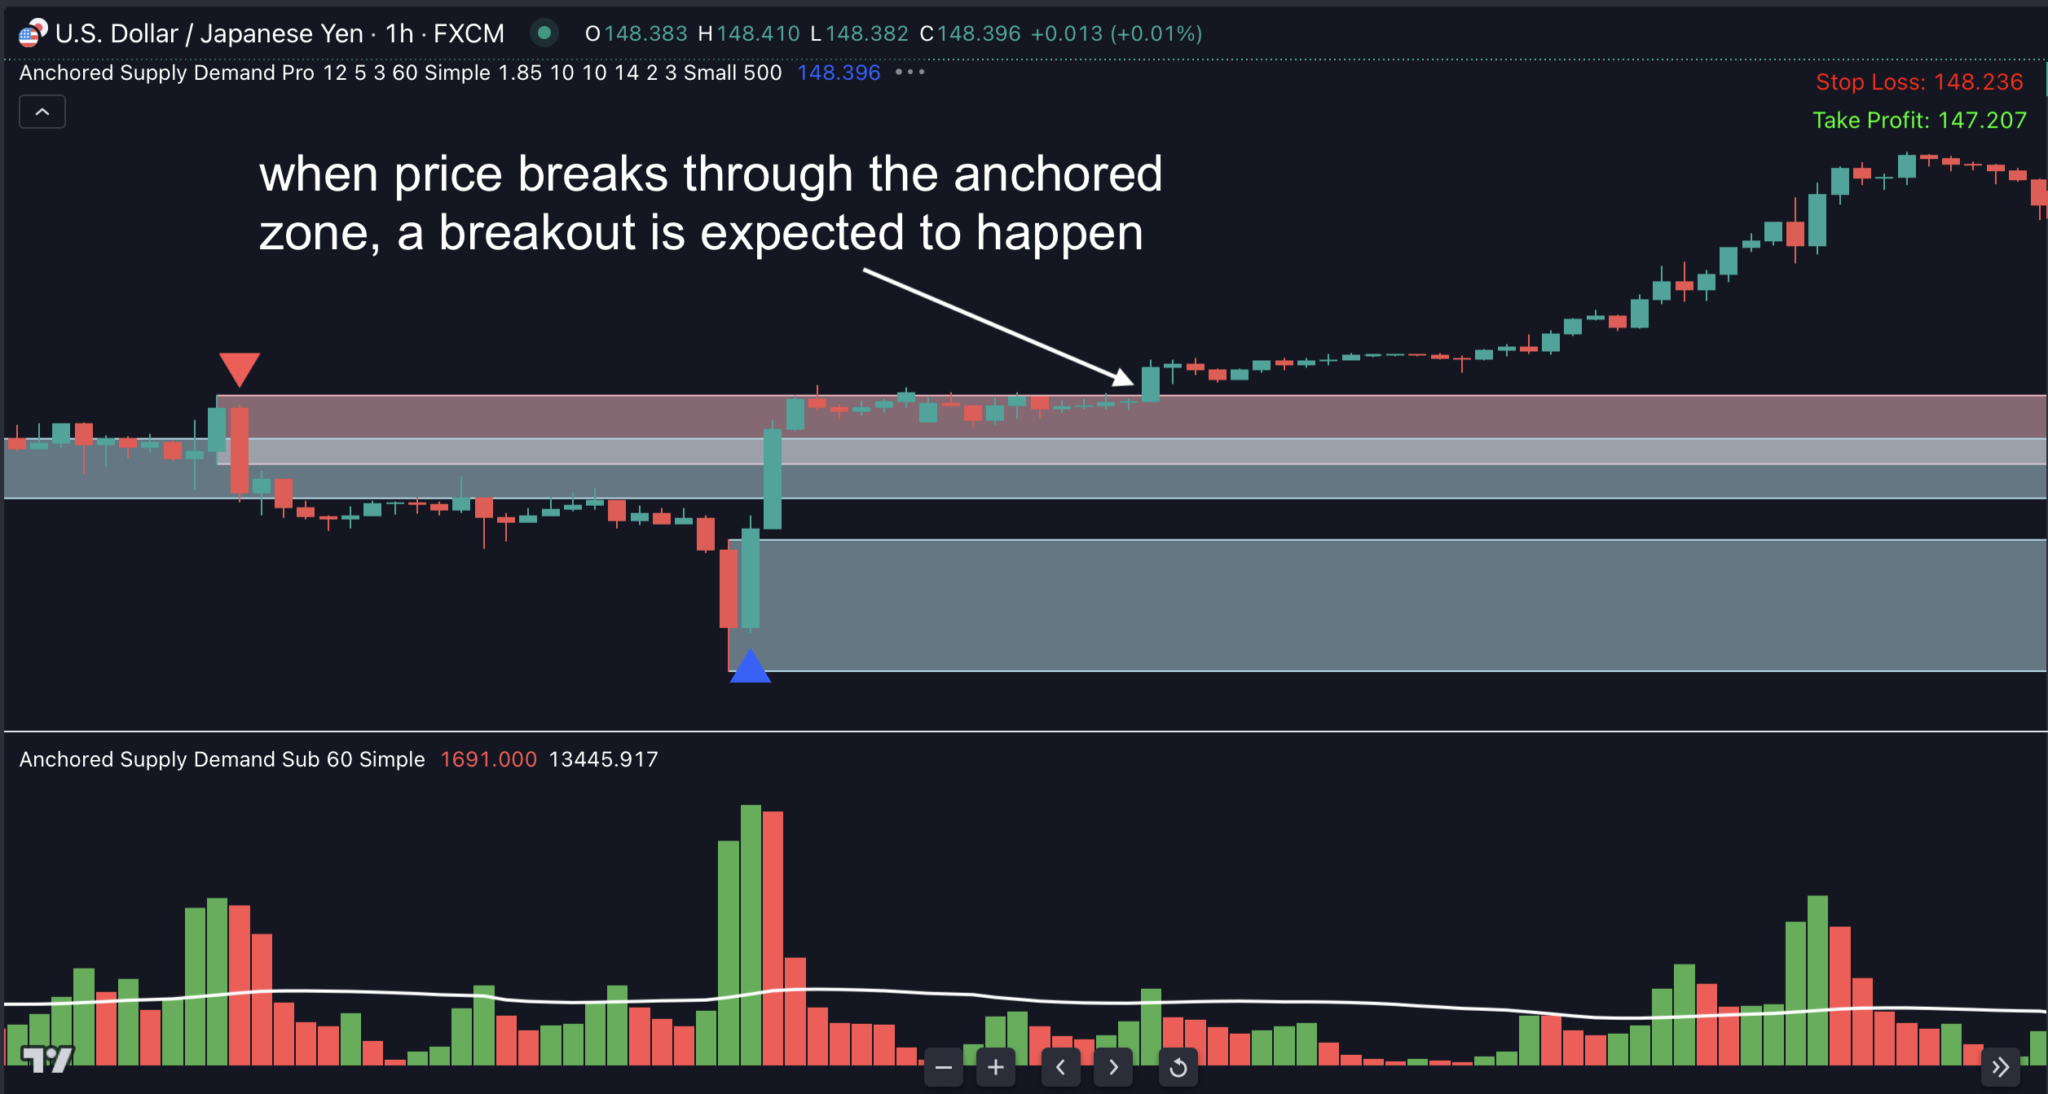
📌 Identifies breakout opportunities with monstrous profit potential.
$349.00

Anchored Supply Demand for TradingView
One-time payment. Lifetime access.