Scientific Scalper for TradingView
This Mix Of Smart Technology & Scientific Trading Approach Gives Birth To My Favorite SCALPING Trading Indicator for Tradingview (Works on Multiple Markets)
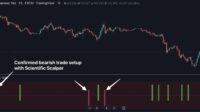
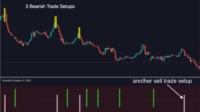
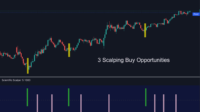
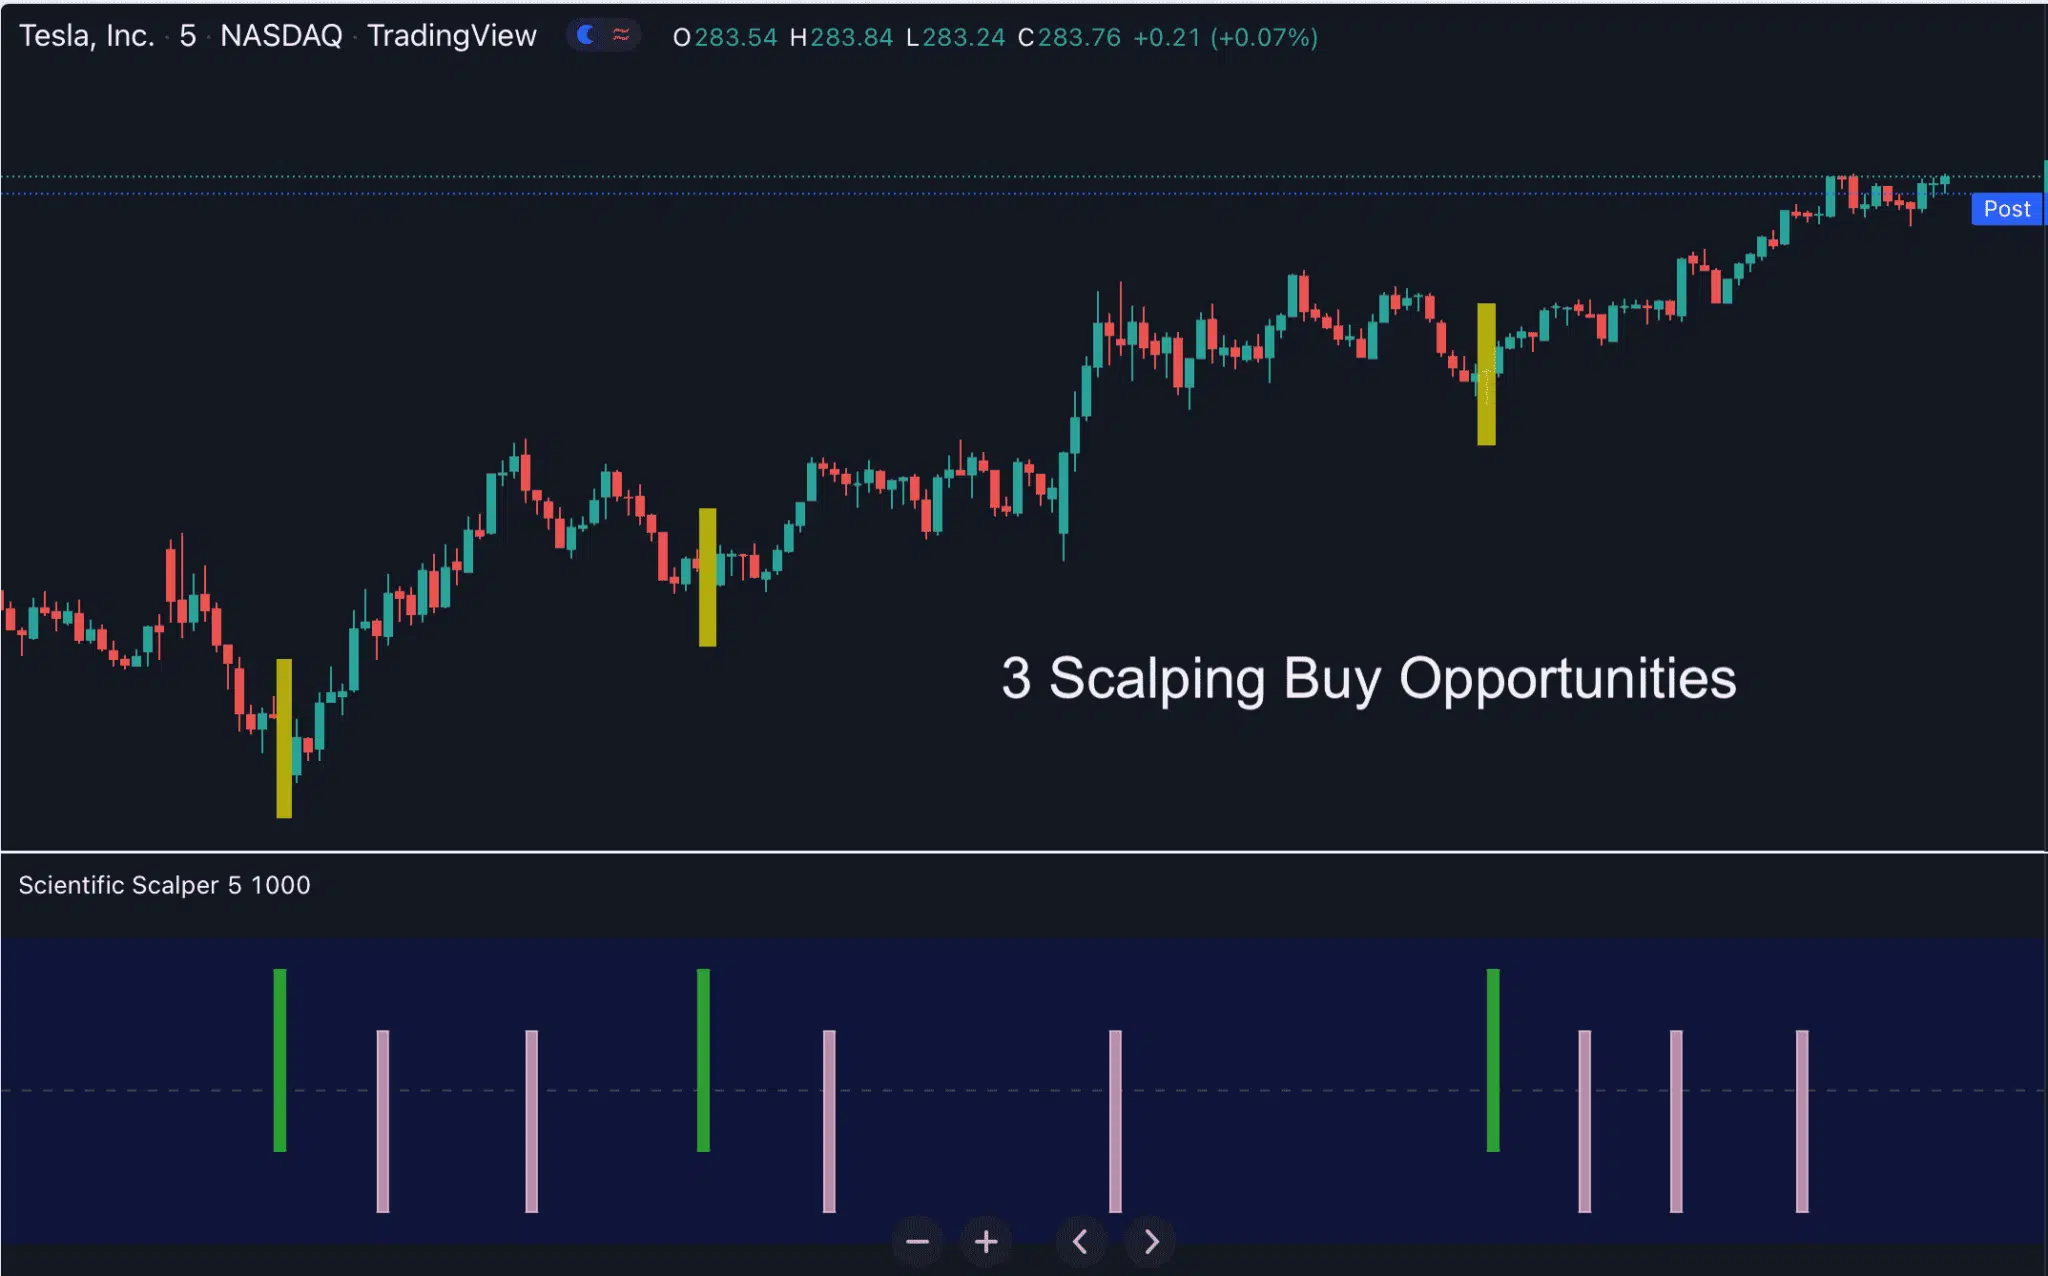
📌 Scanning the markets 24/5 for the best, highest-probability SCALPING TRADING and DAY TRADING opportunities while you sit back and relax.
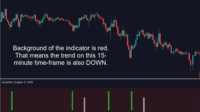
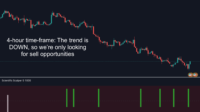
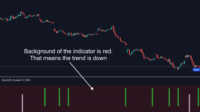
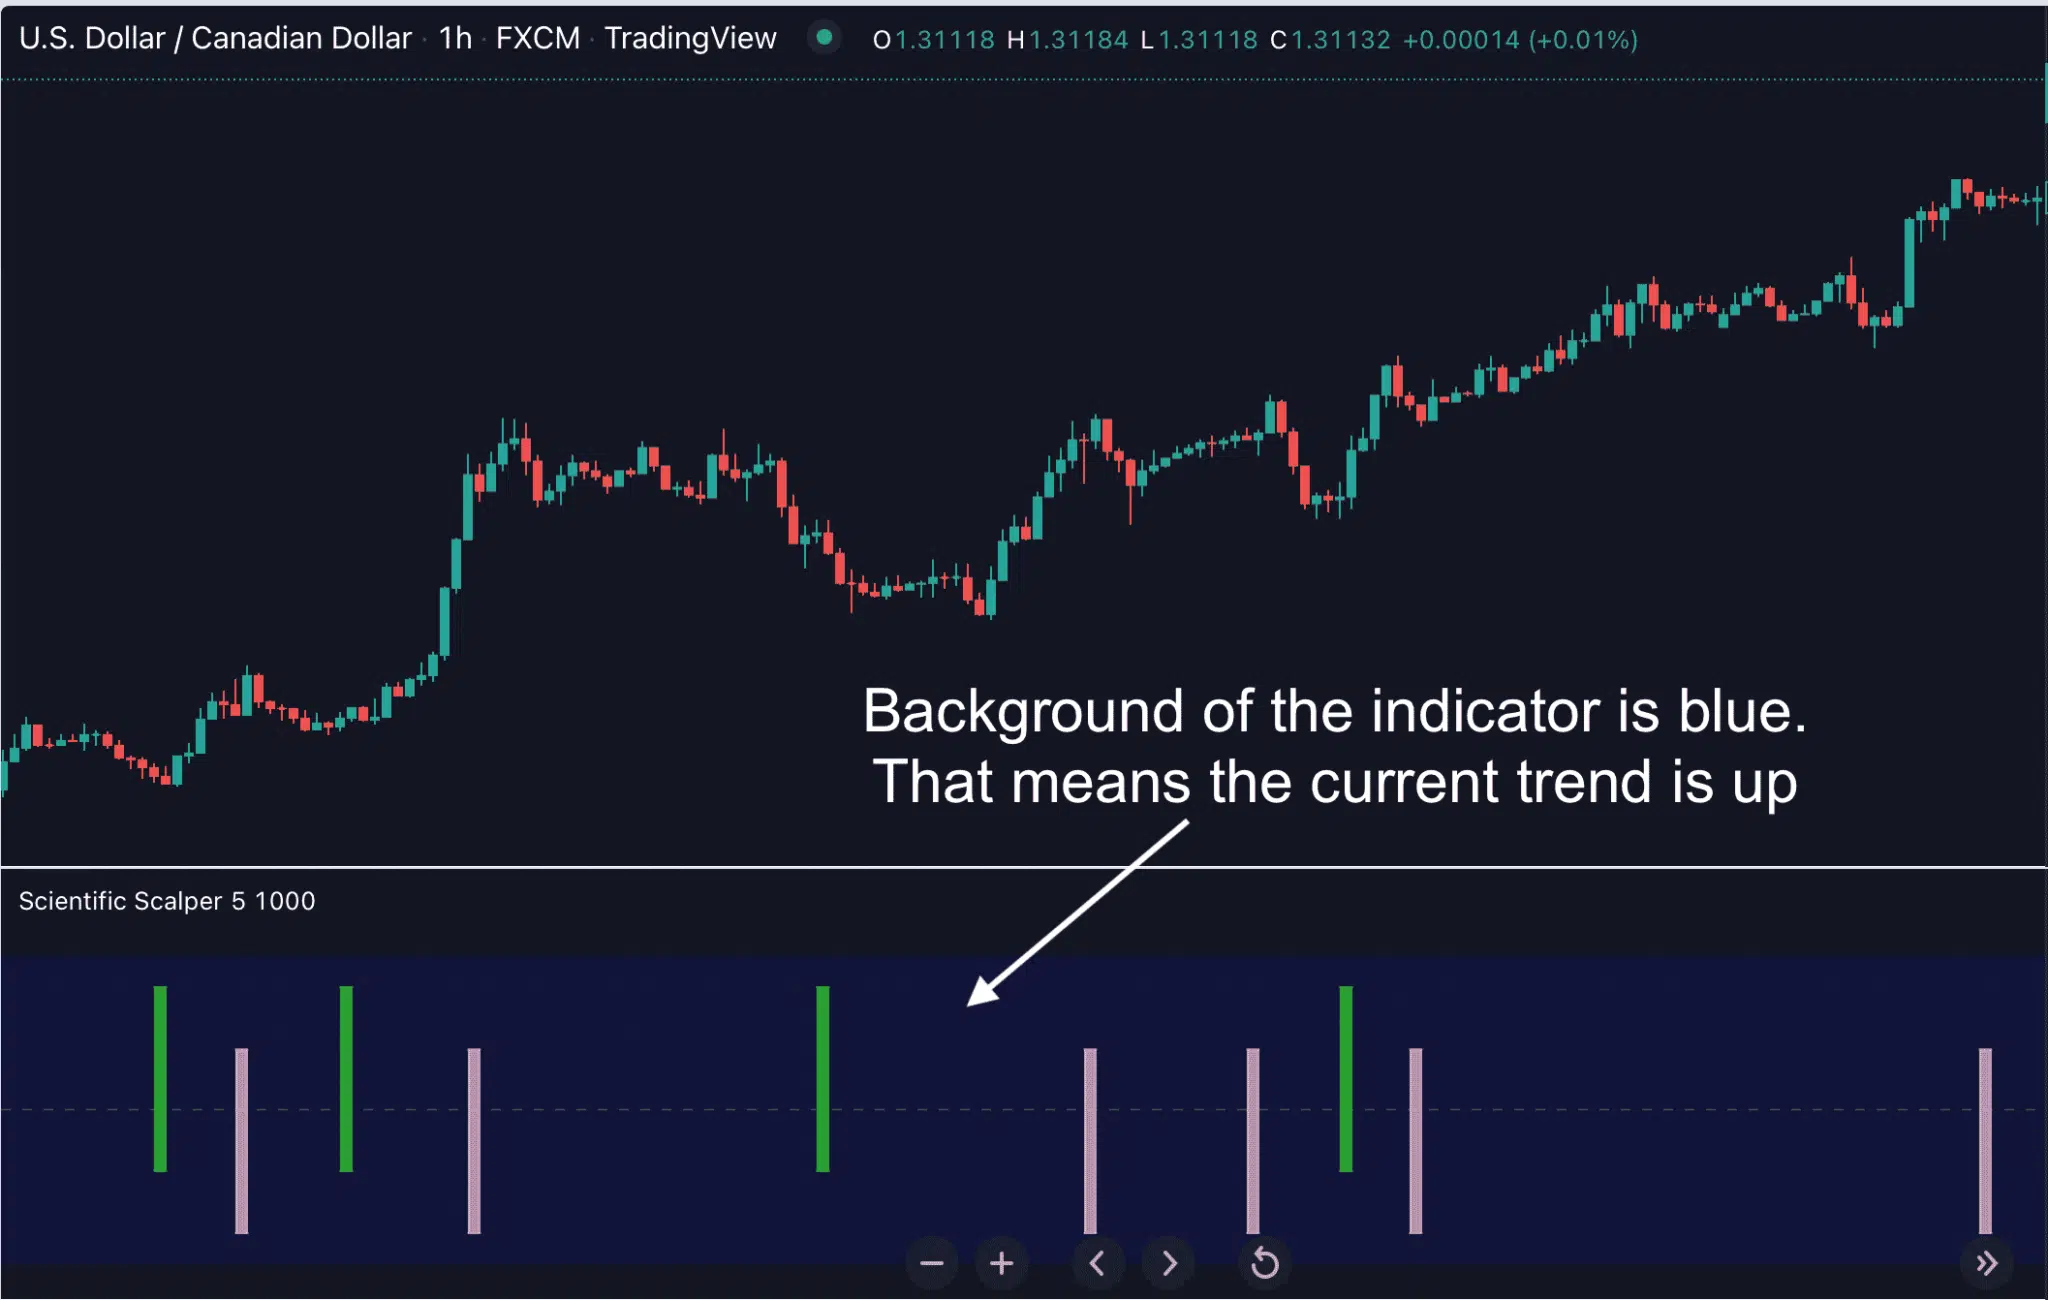
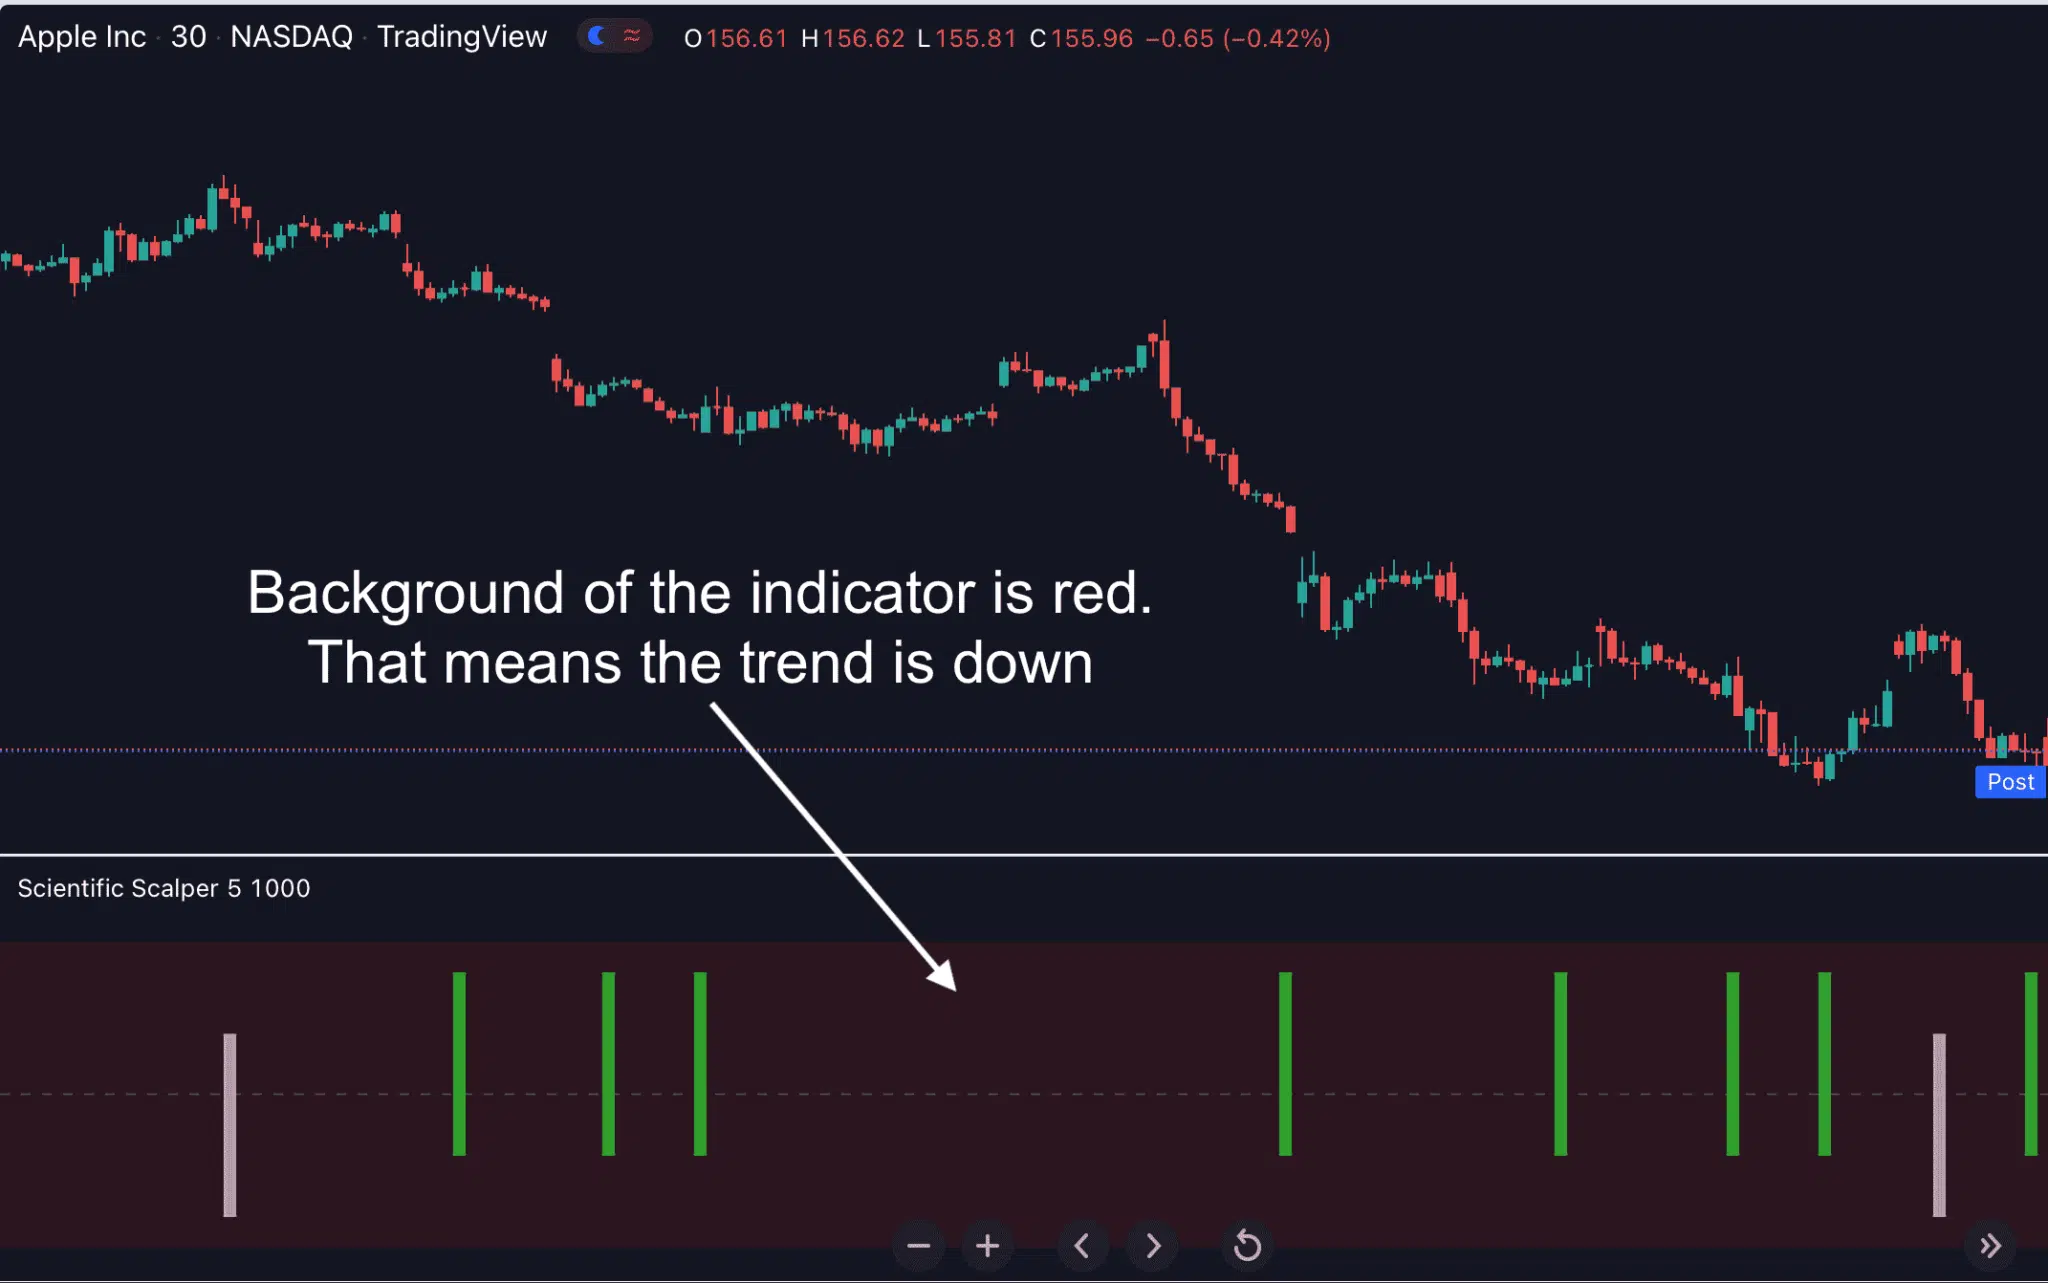
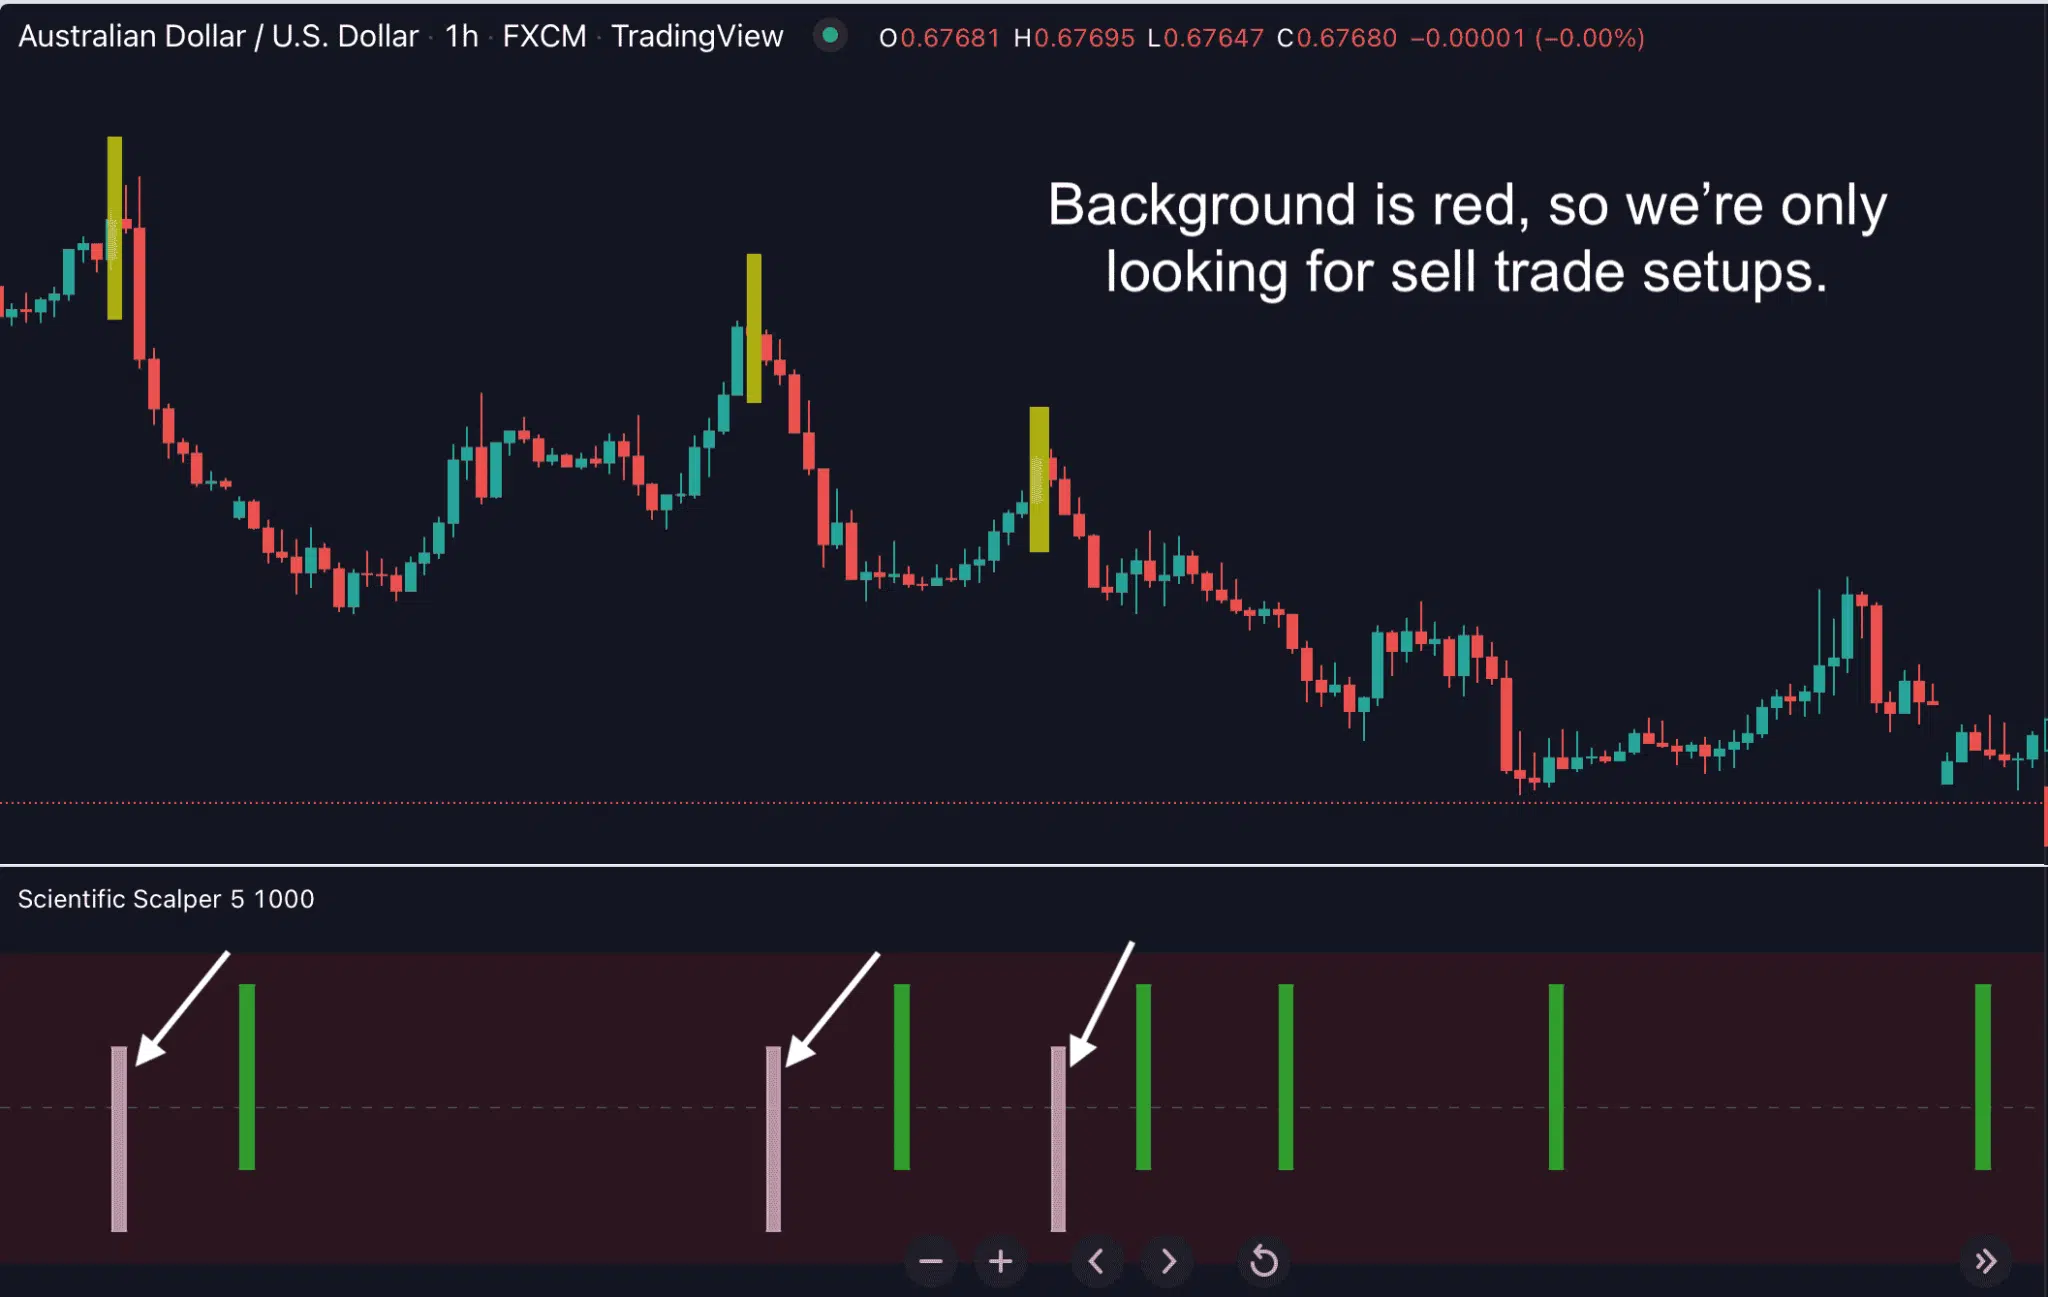
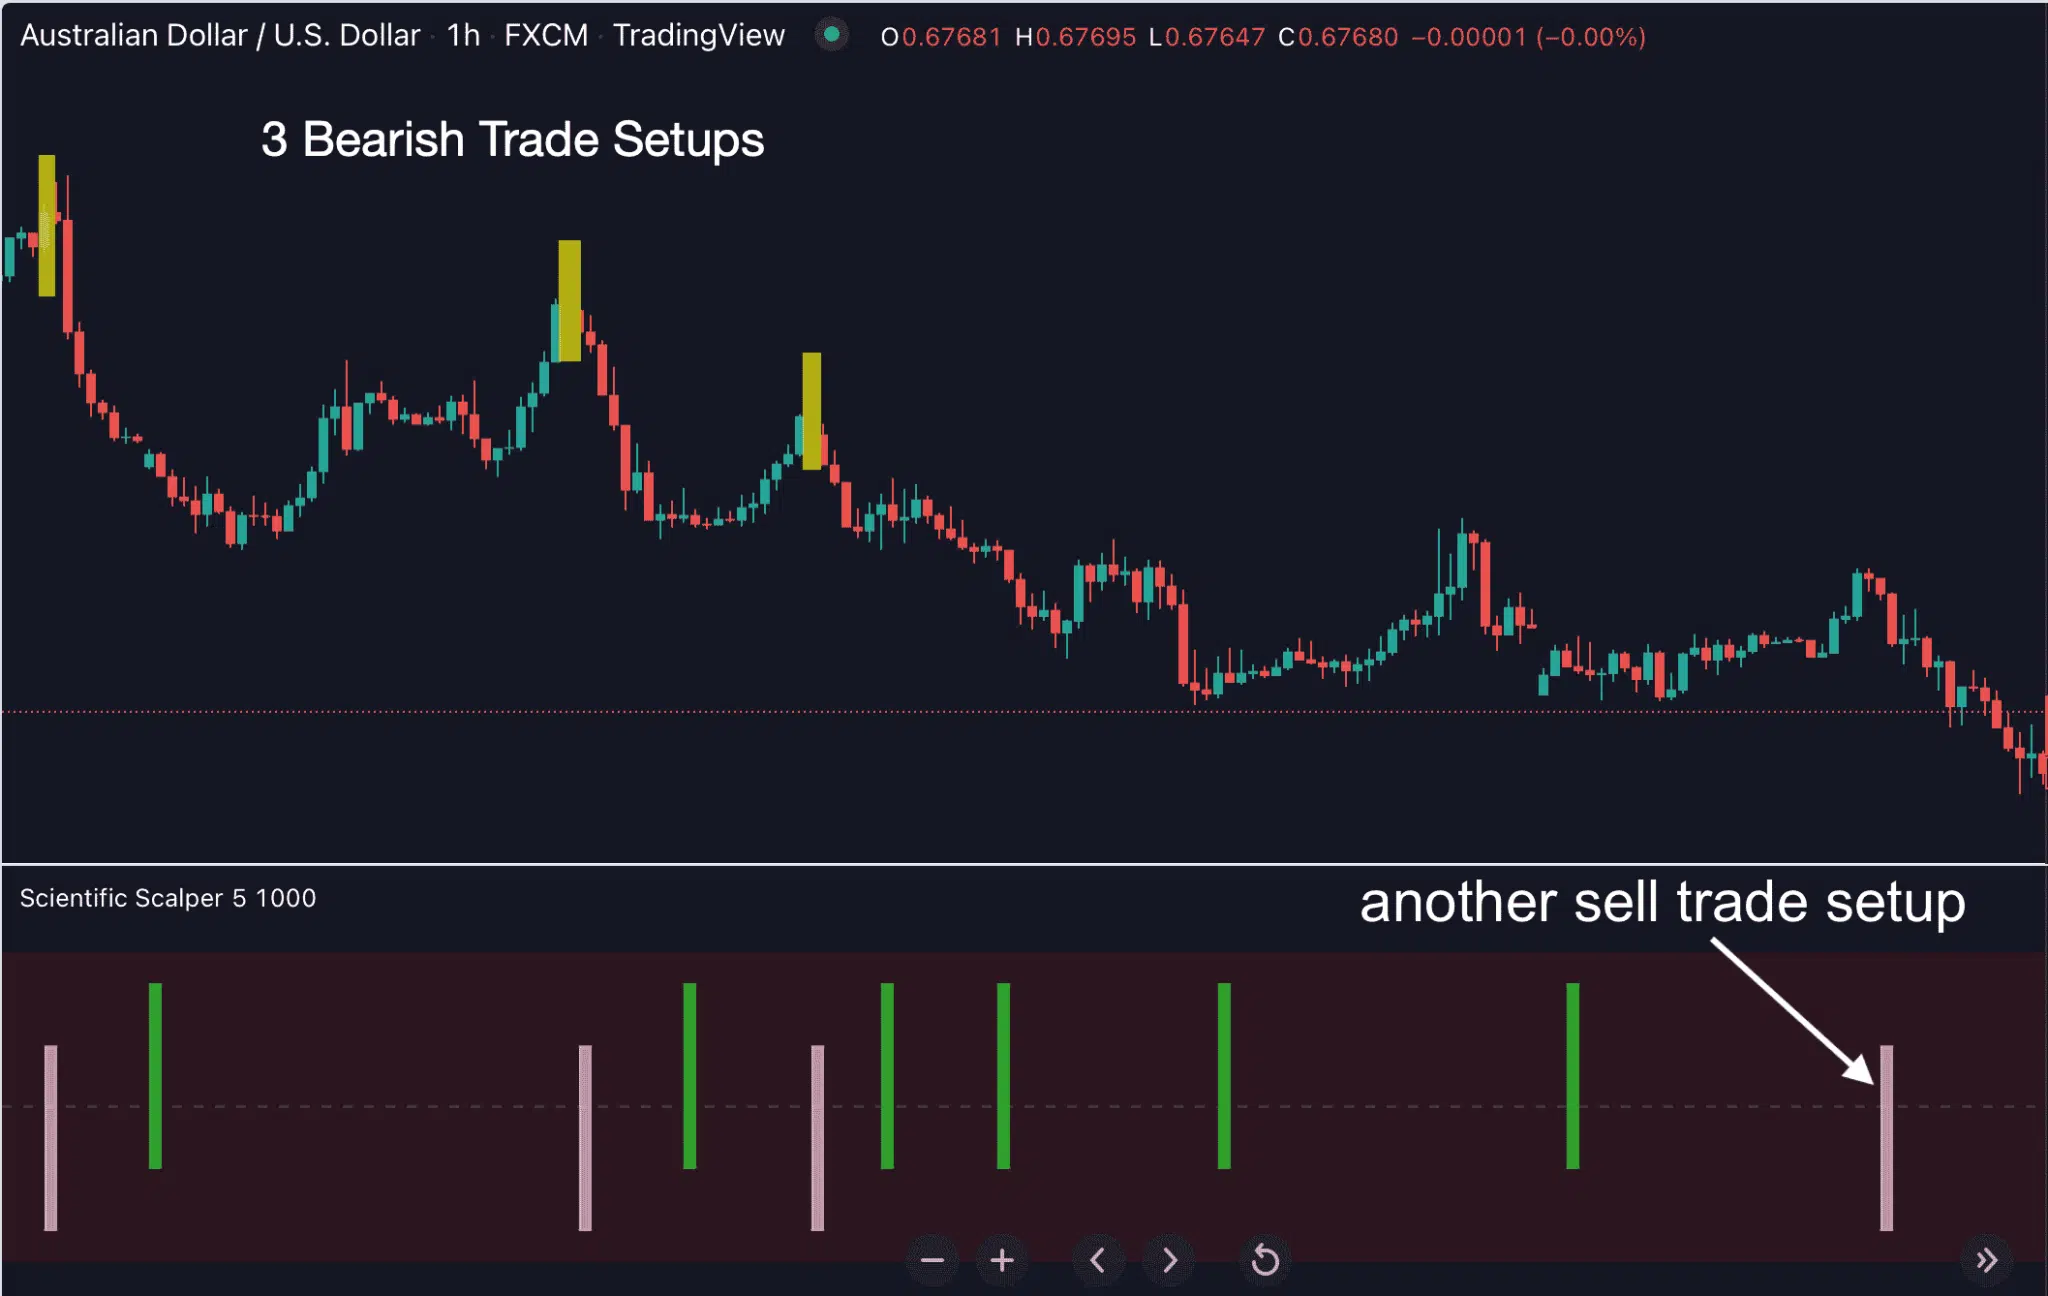
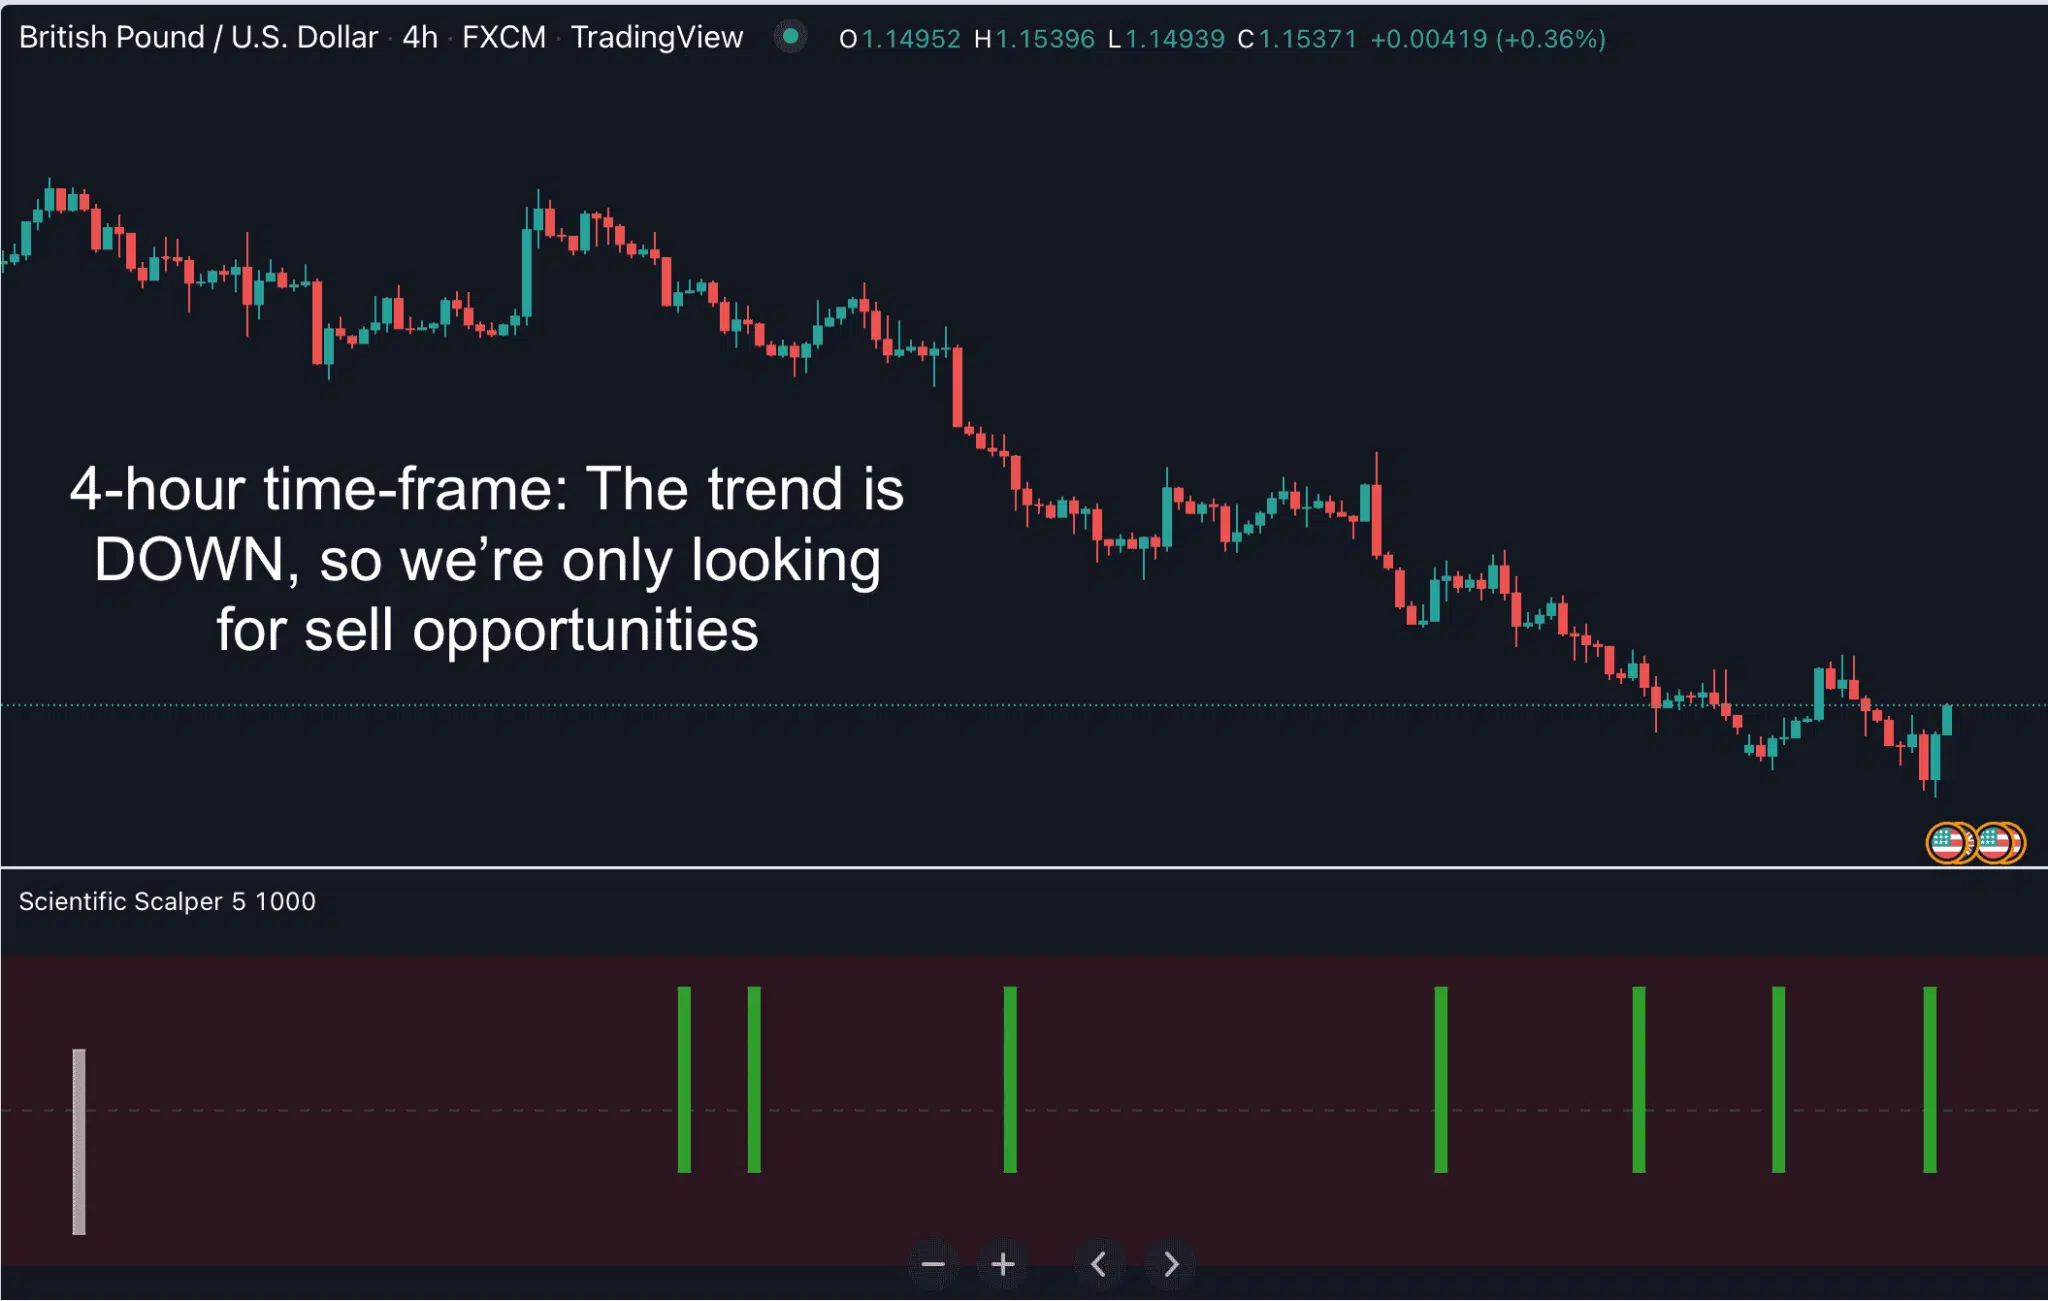
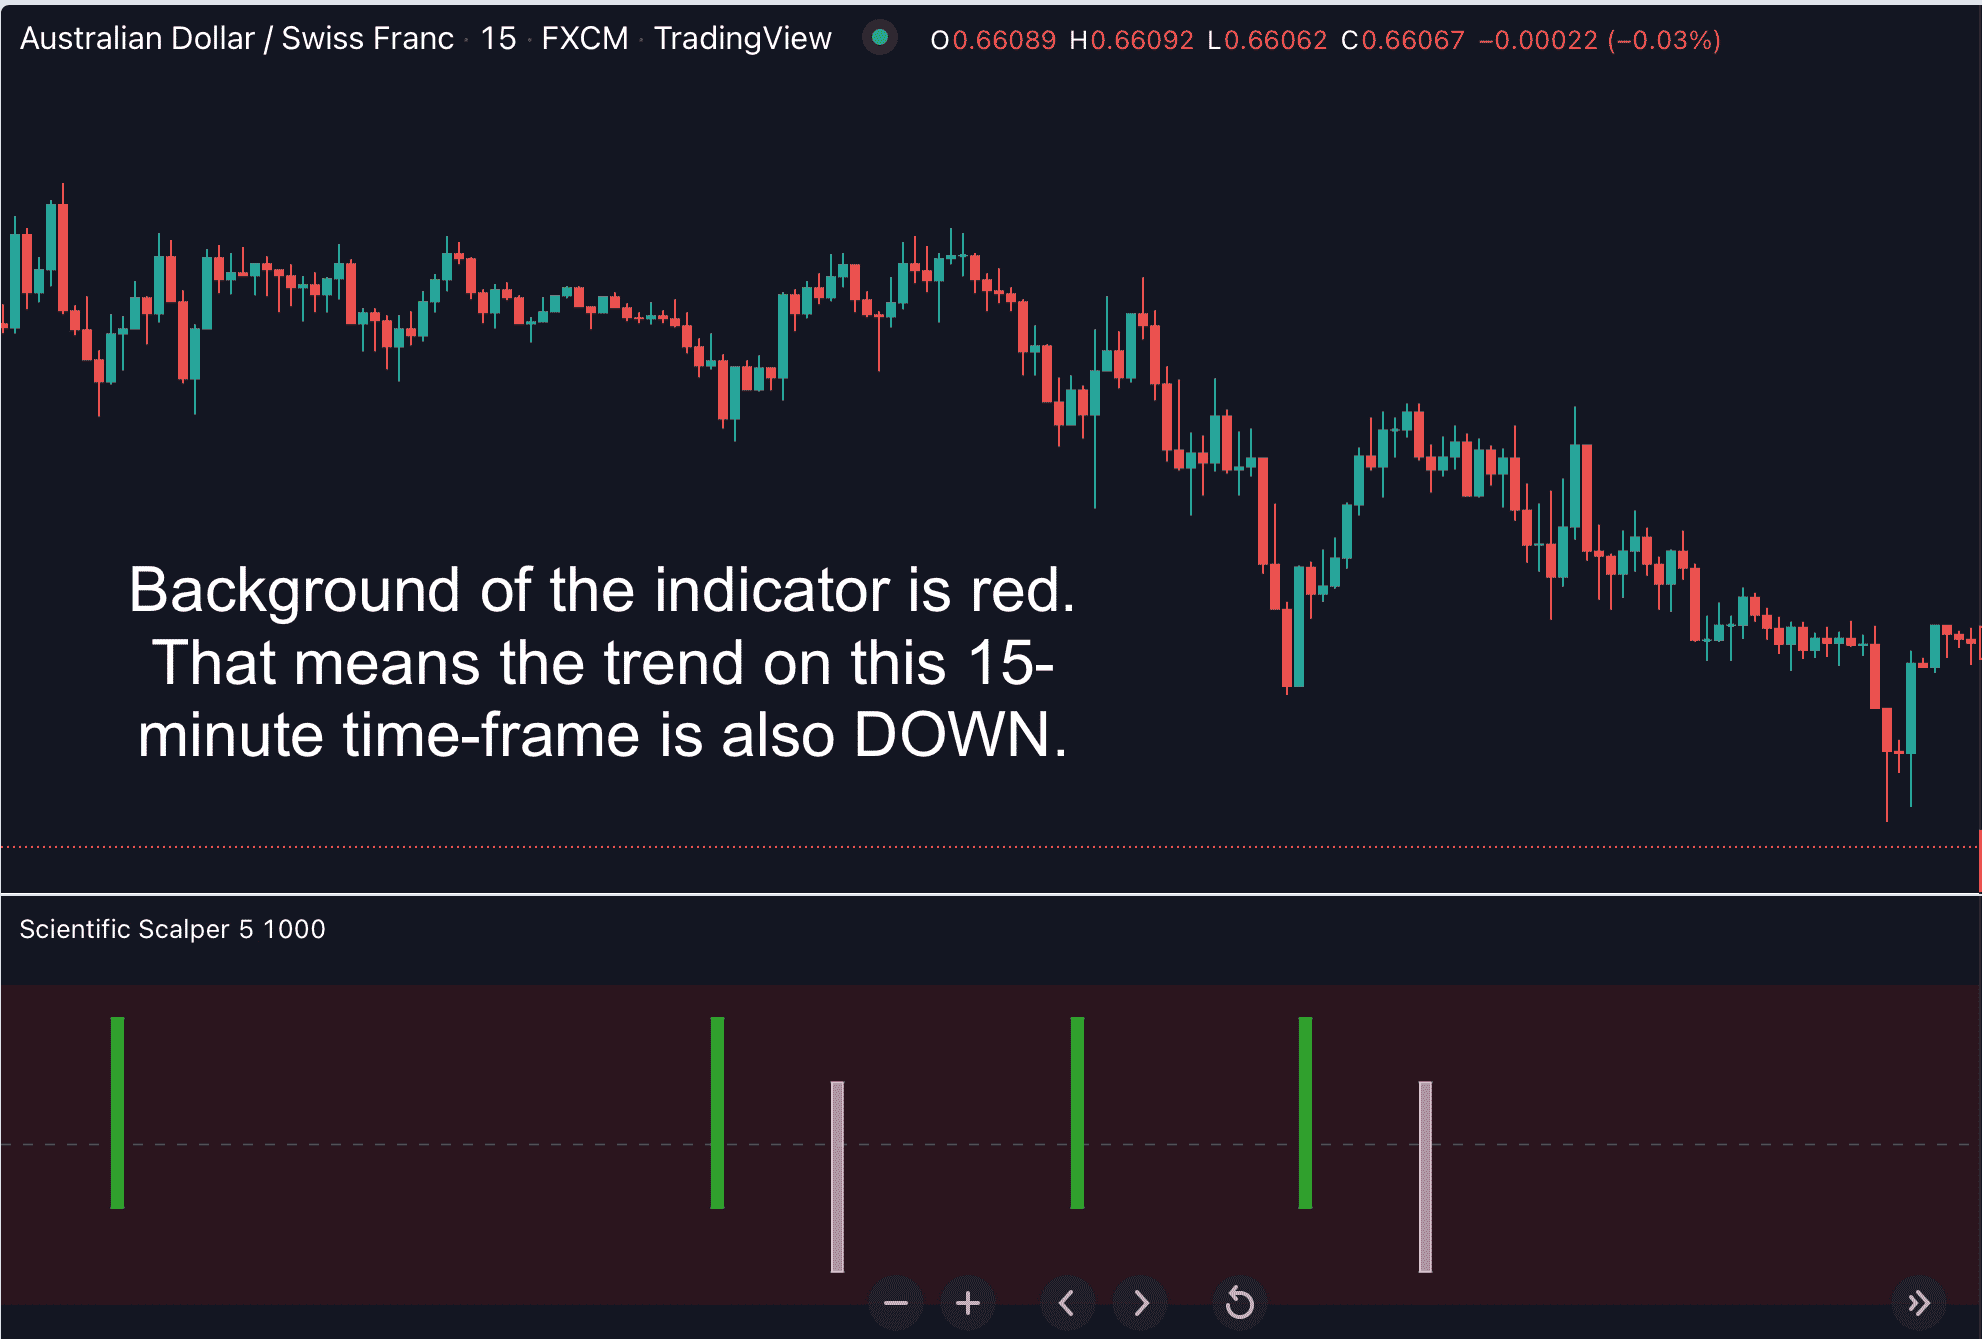
📌 It helps you determine the underlying trend direction on ALL time frames with ease.
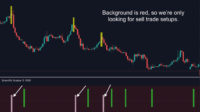
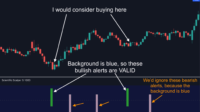
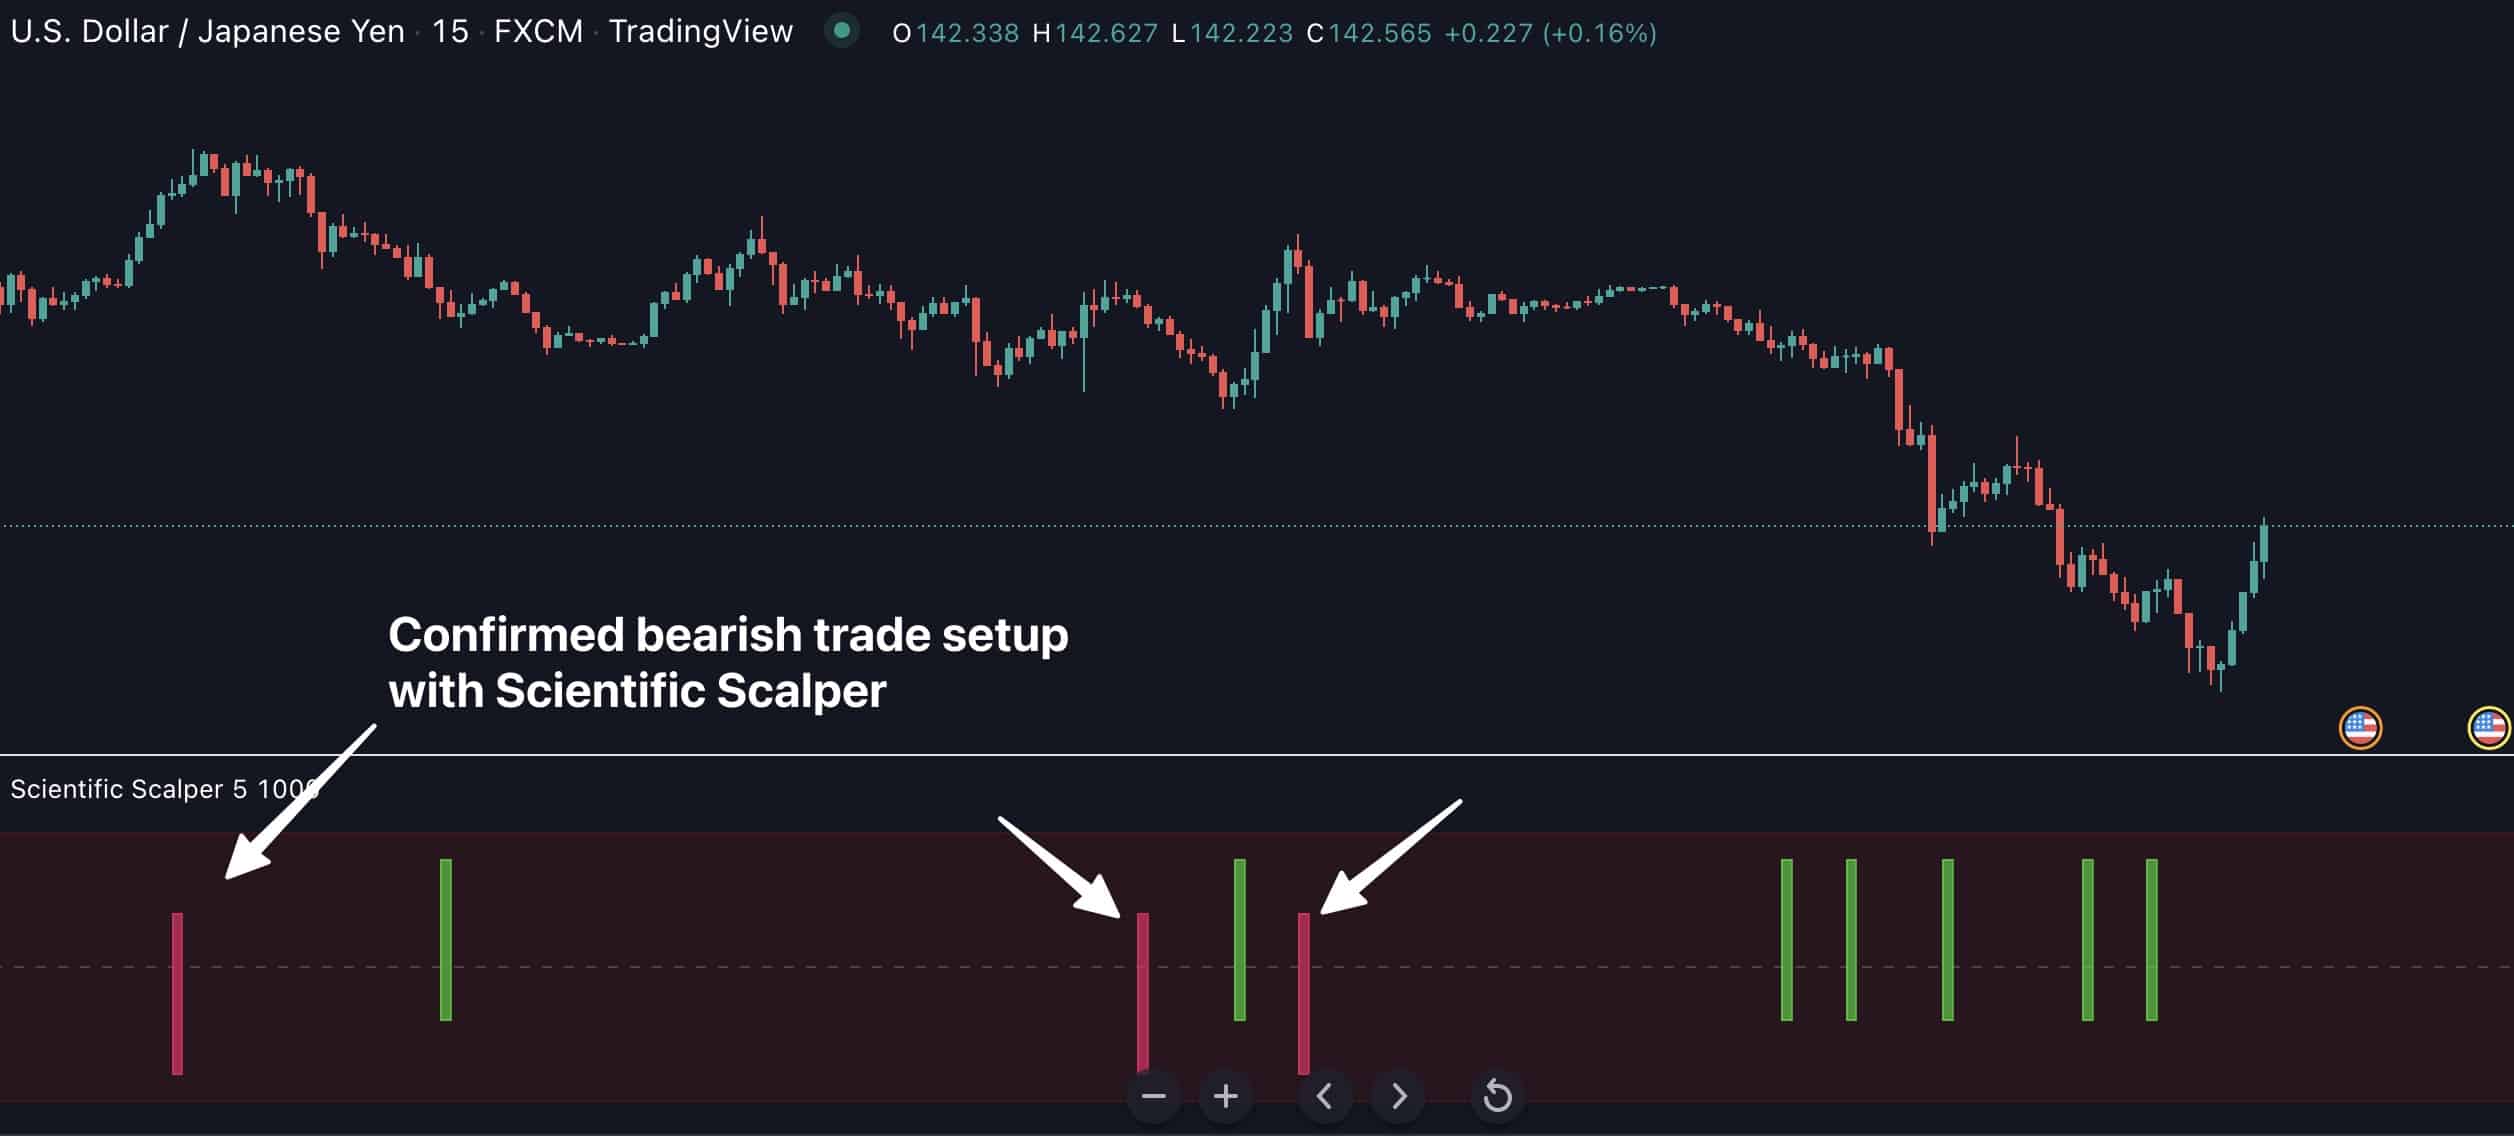
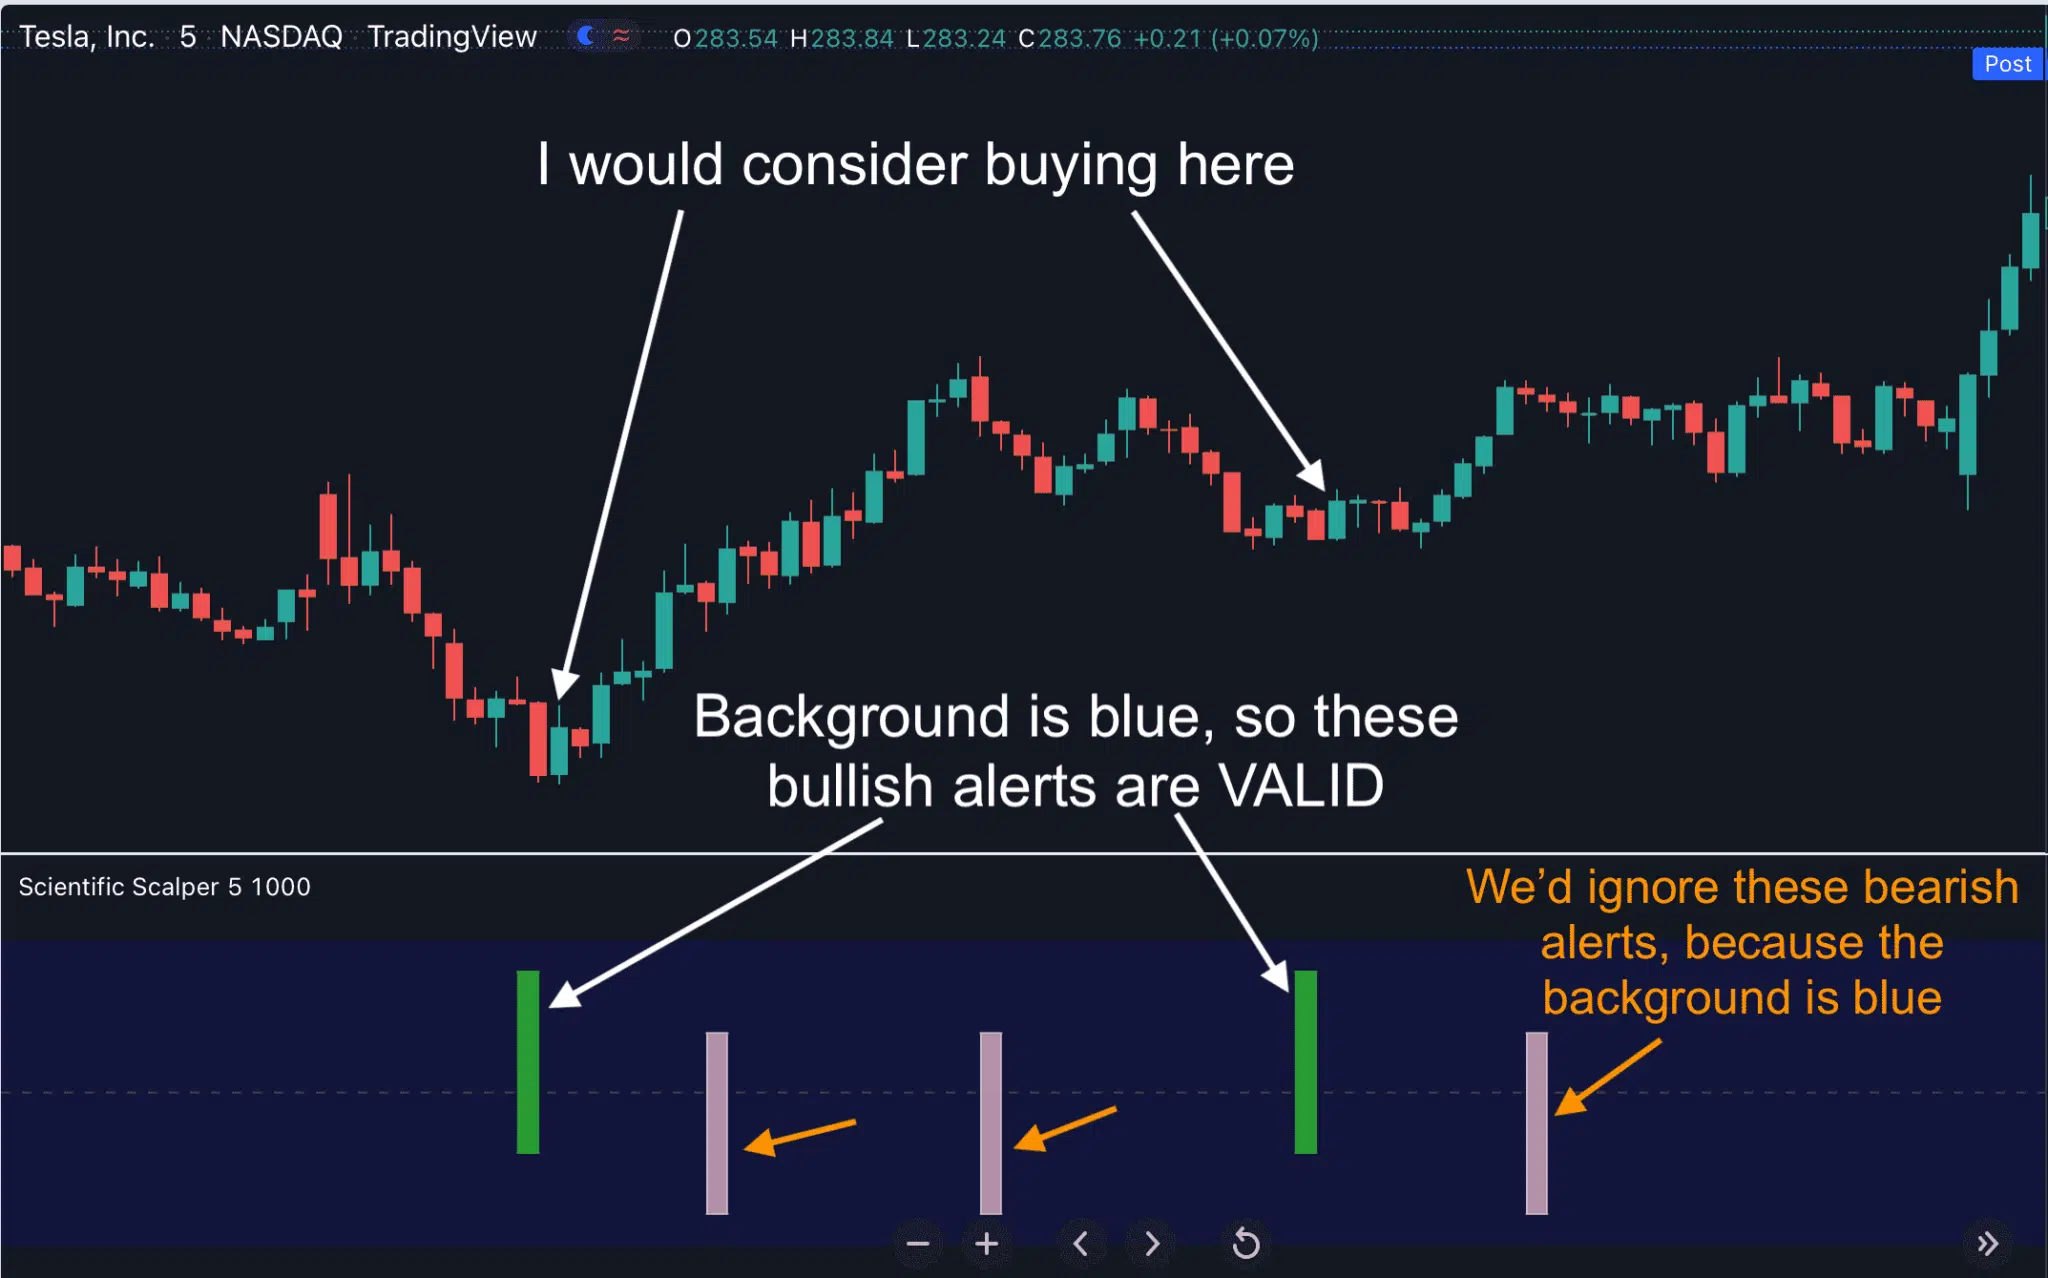
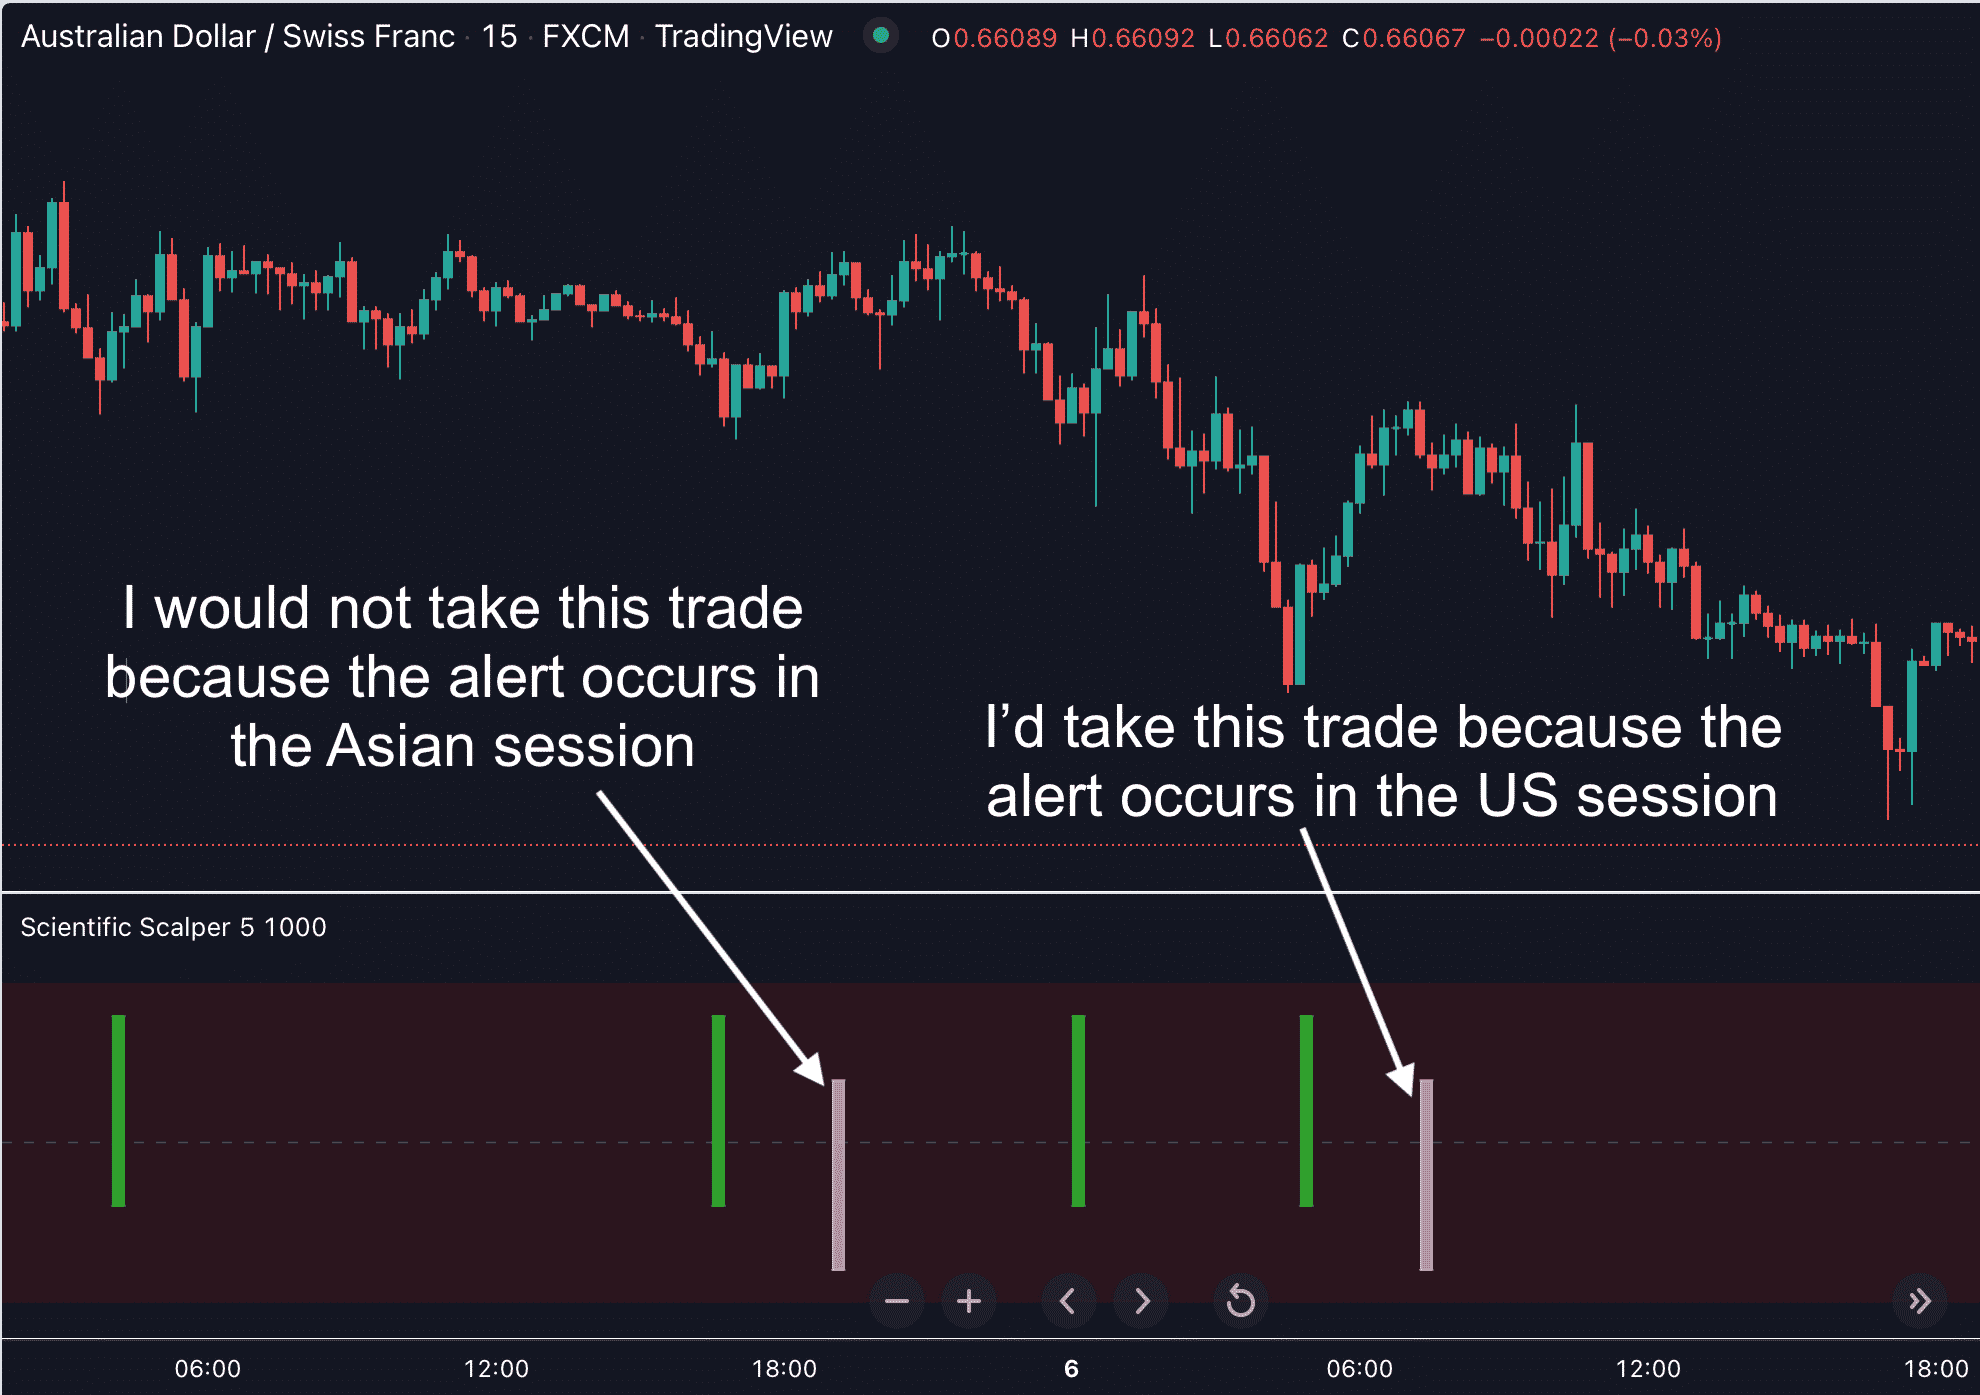
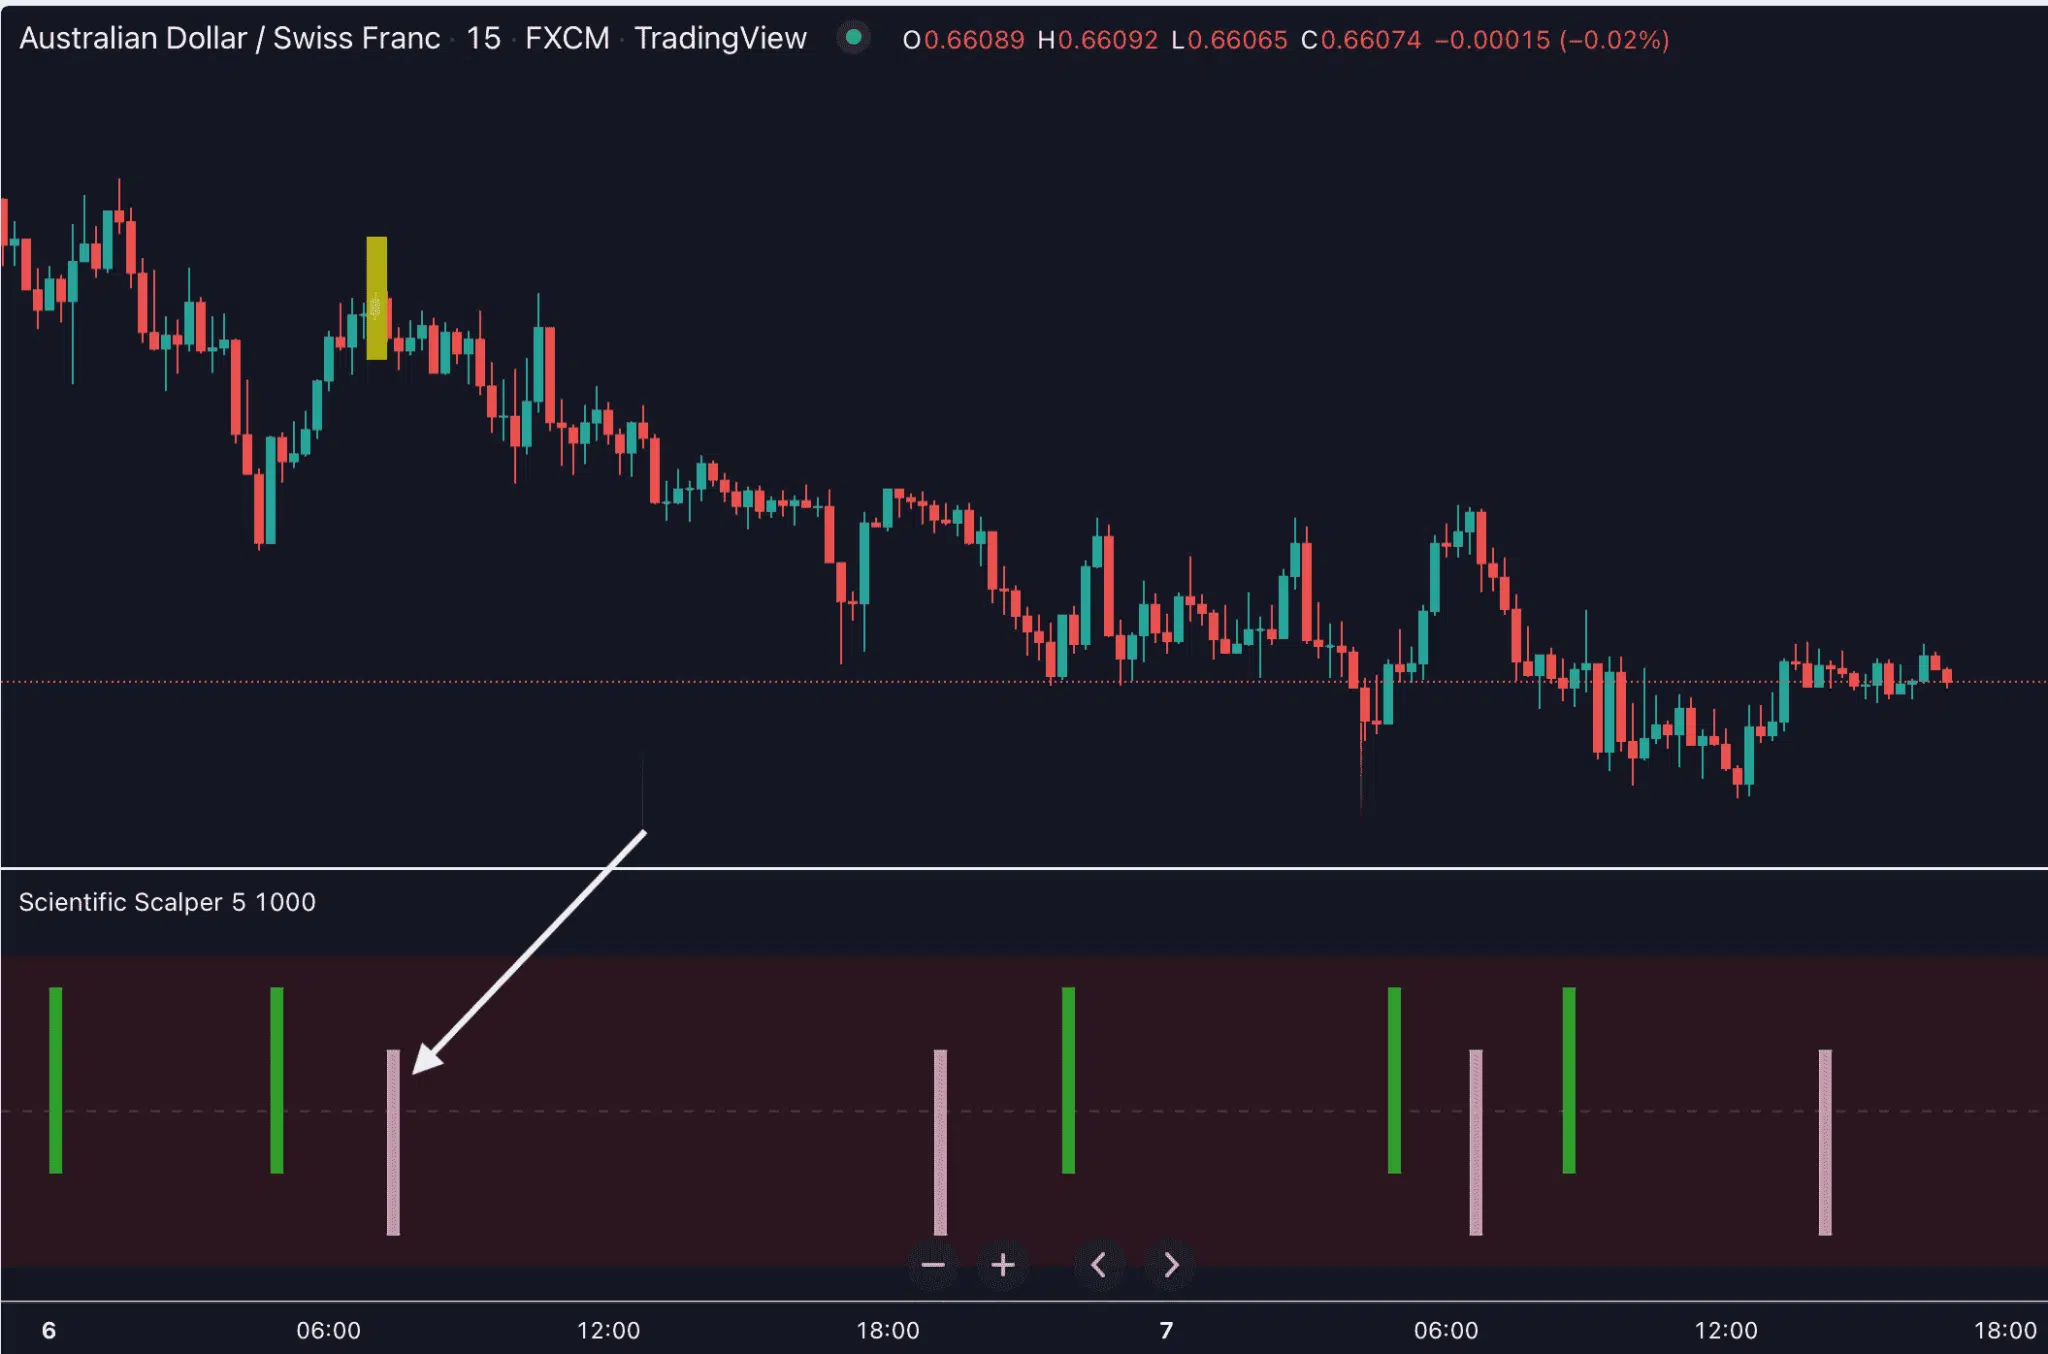
📌 It gives you alerts whenever a valid buy or sell setup is generated.
$349.00
Useful Videos
4 Videos


Scientific Scalper for TradingView
One-time payment. Lifetime access.
Frequently Asked Questions
Customer Reviews
-

-
Sale!
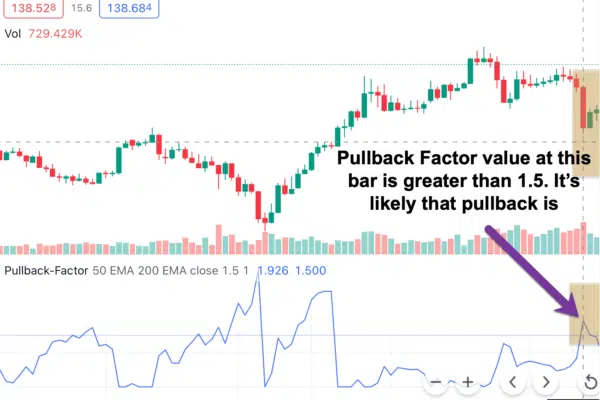
Pullback Factor for TradingView
Original price was: $299.00.$129.00Current price is: $129.00. -
-