Logic Trendline for TradingView
$299.00
📌 By utilizing our accurate trendline algorithm. Proven through statistical testing.
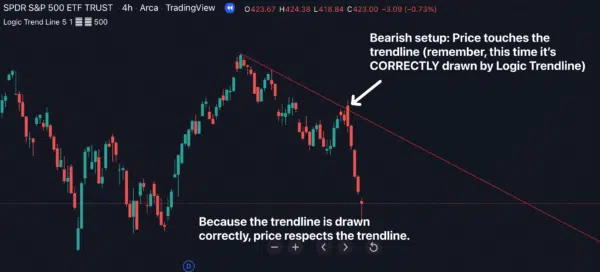
📌 So you can be confident price respects your trendlines more often… your stop loss is safer… and you could win more trades…
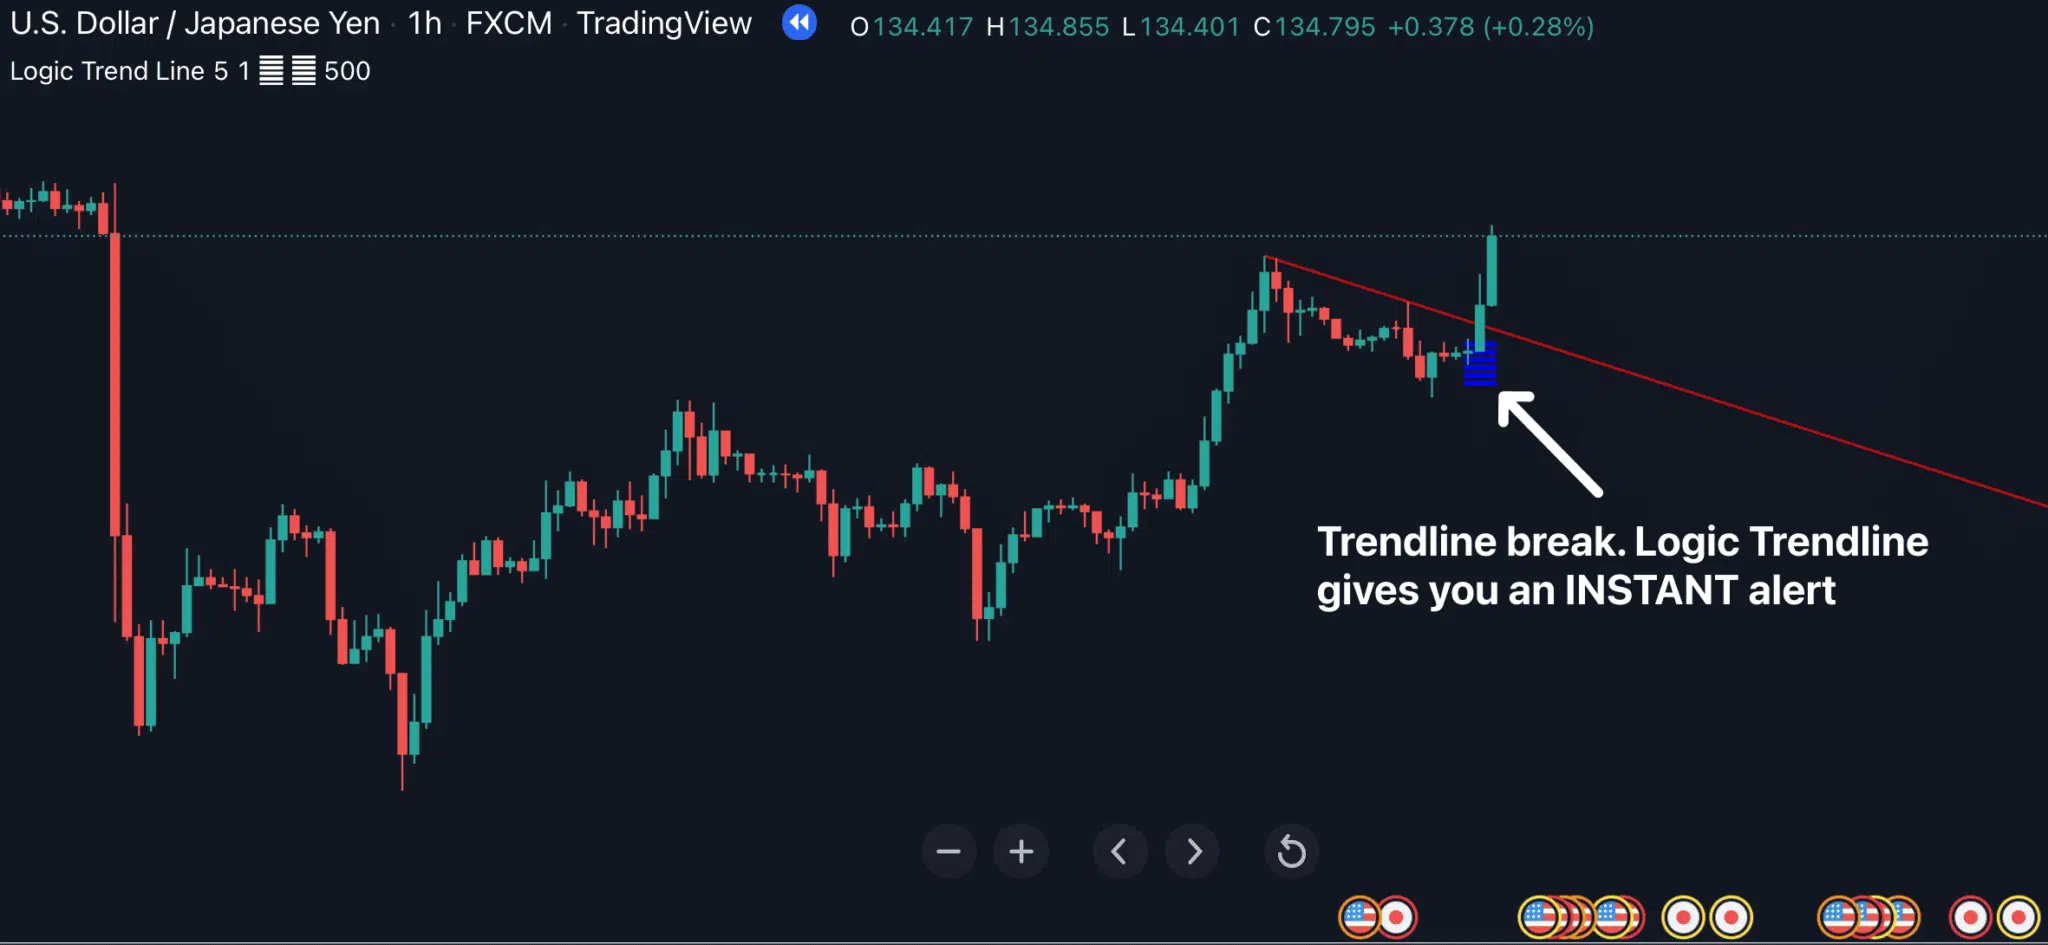
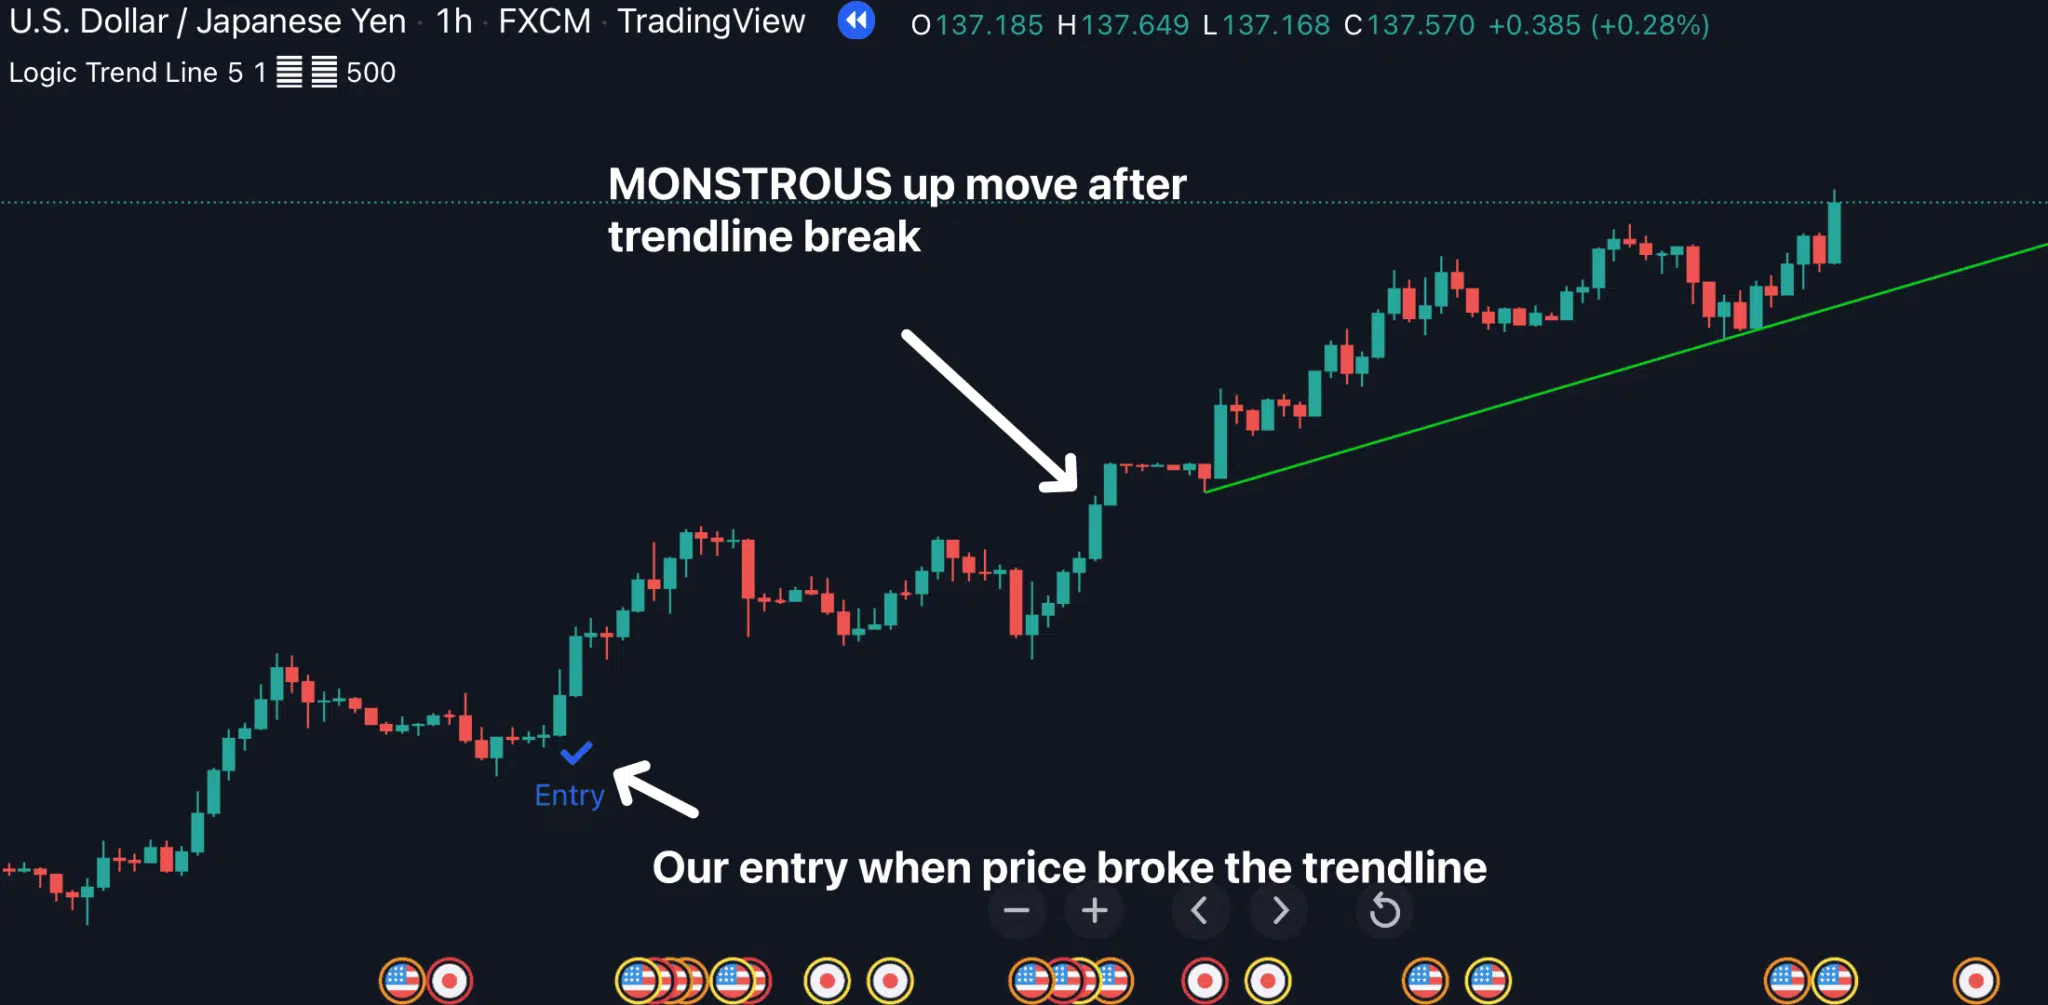
📌 Plus, once the price breaks this Logic Trendline, it often leads to significant market moves.
Is the market scheming against you? Does it sometimes feel like PRICE just pierces through your trendline, triggers your stop loss, then going back the direction you originally predicted? That’s because you may be drawing trendlines the WRONG way all along…
New “Logic Trendline Indicator for Tradingview” Automatically Draws The CORRECT Trendline For You…
Hey there,
Do you sometimes feel like the market is playing a joke on you?
I felt that way so many times.
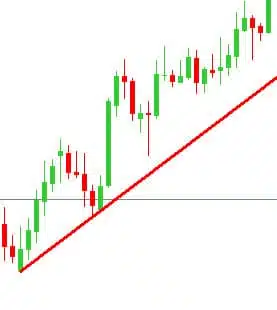
I mean… does this sounds familiar? The market is obviously in an uptrend. You draw a perfect trendline the way everybody draws. Something like this:
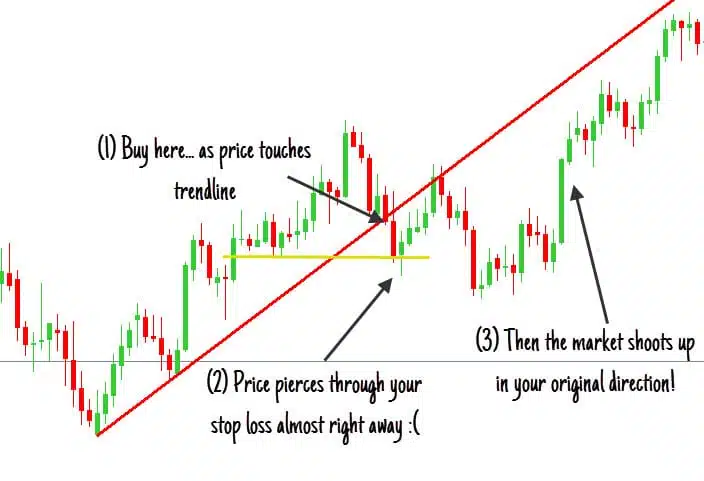
So far so good. Then price retraces, and touches your trendline. A perfect buy, right? So you buy.
Watch what happens:
Oh no, not again.
Sometimes I feel like the market’s playing a joke on me. Seriously.
How many times did I watch the same scenario happen already? As soon as I entered the trade, price pierced right through my trendline, triggered my stop loss. And then shot up in MY original direction.
Trendlines are supposed to work, you know? Price is supposed to respect trendline, isn’t it?
Here’s the problem with most trendlines:
It’s subjective. Almost like every trader has a different way of drawing trendlines.
Because there’s a lot of variables: Should I connect the body or should I connect the wicks? Which swing lows (or swing highs) should I pick? Etc…
No wonder everybody feels confused and overwhelmed.
But what if there’s a tool that eliminates all that confusion and subjectivity.
What if there’s an indicator that AUTOMATICALLY draws the CORRECT trendline for you?
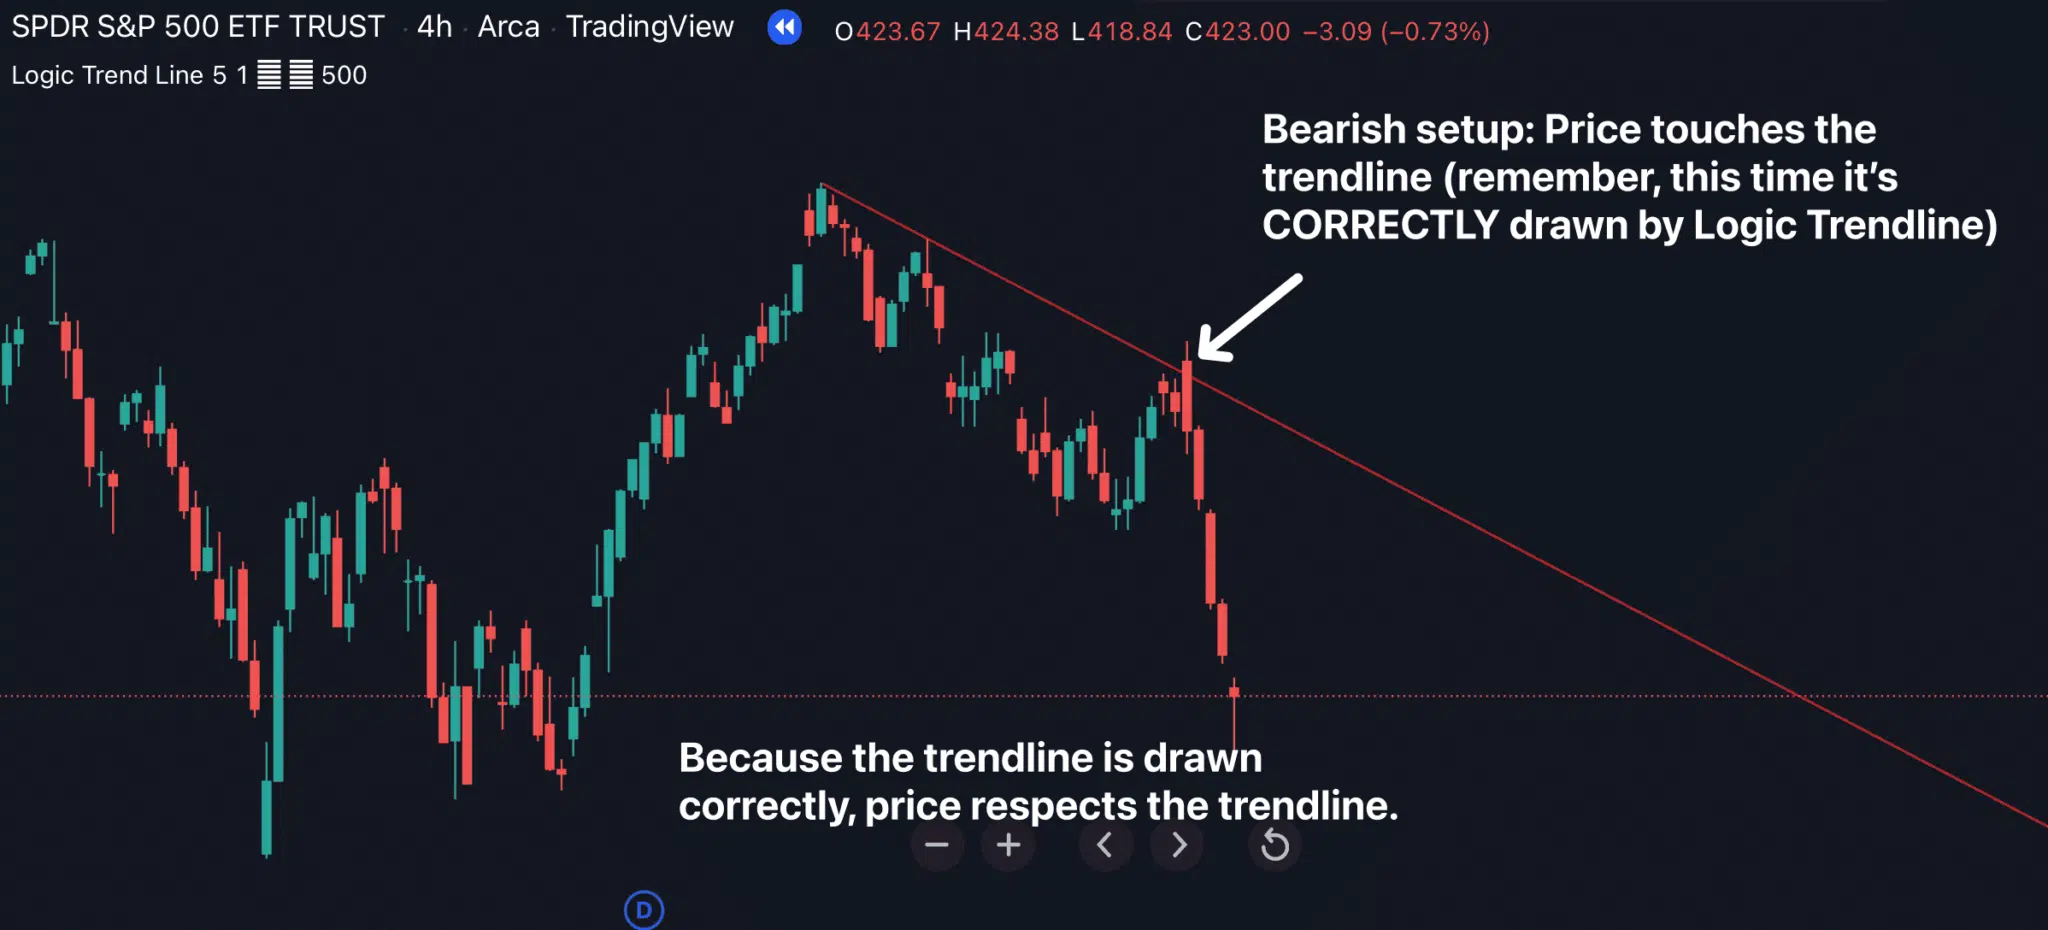
By “correct”, I mean the trendline that has a really good chance of working. In other words, the trendline that price respects.
And if the market does break through this trendline, there’s a high probability that a REVERSAL is coming…
Announcing:
Logic Trendline indicator for Tradingview
Here’s how it works:
Once you put the indicator on your chart, it automatically draws the trendline… that has a really good chance of working… on your chart for you.
So you can be confident trading with that trendline. You never feel lost and confused again.
For example, here’s one simple way to use Logic Trendline Indicator for Tradingview:
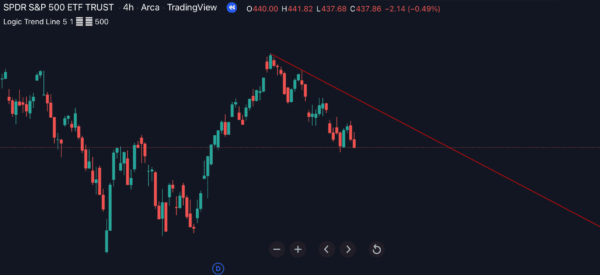
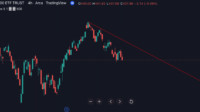
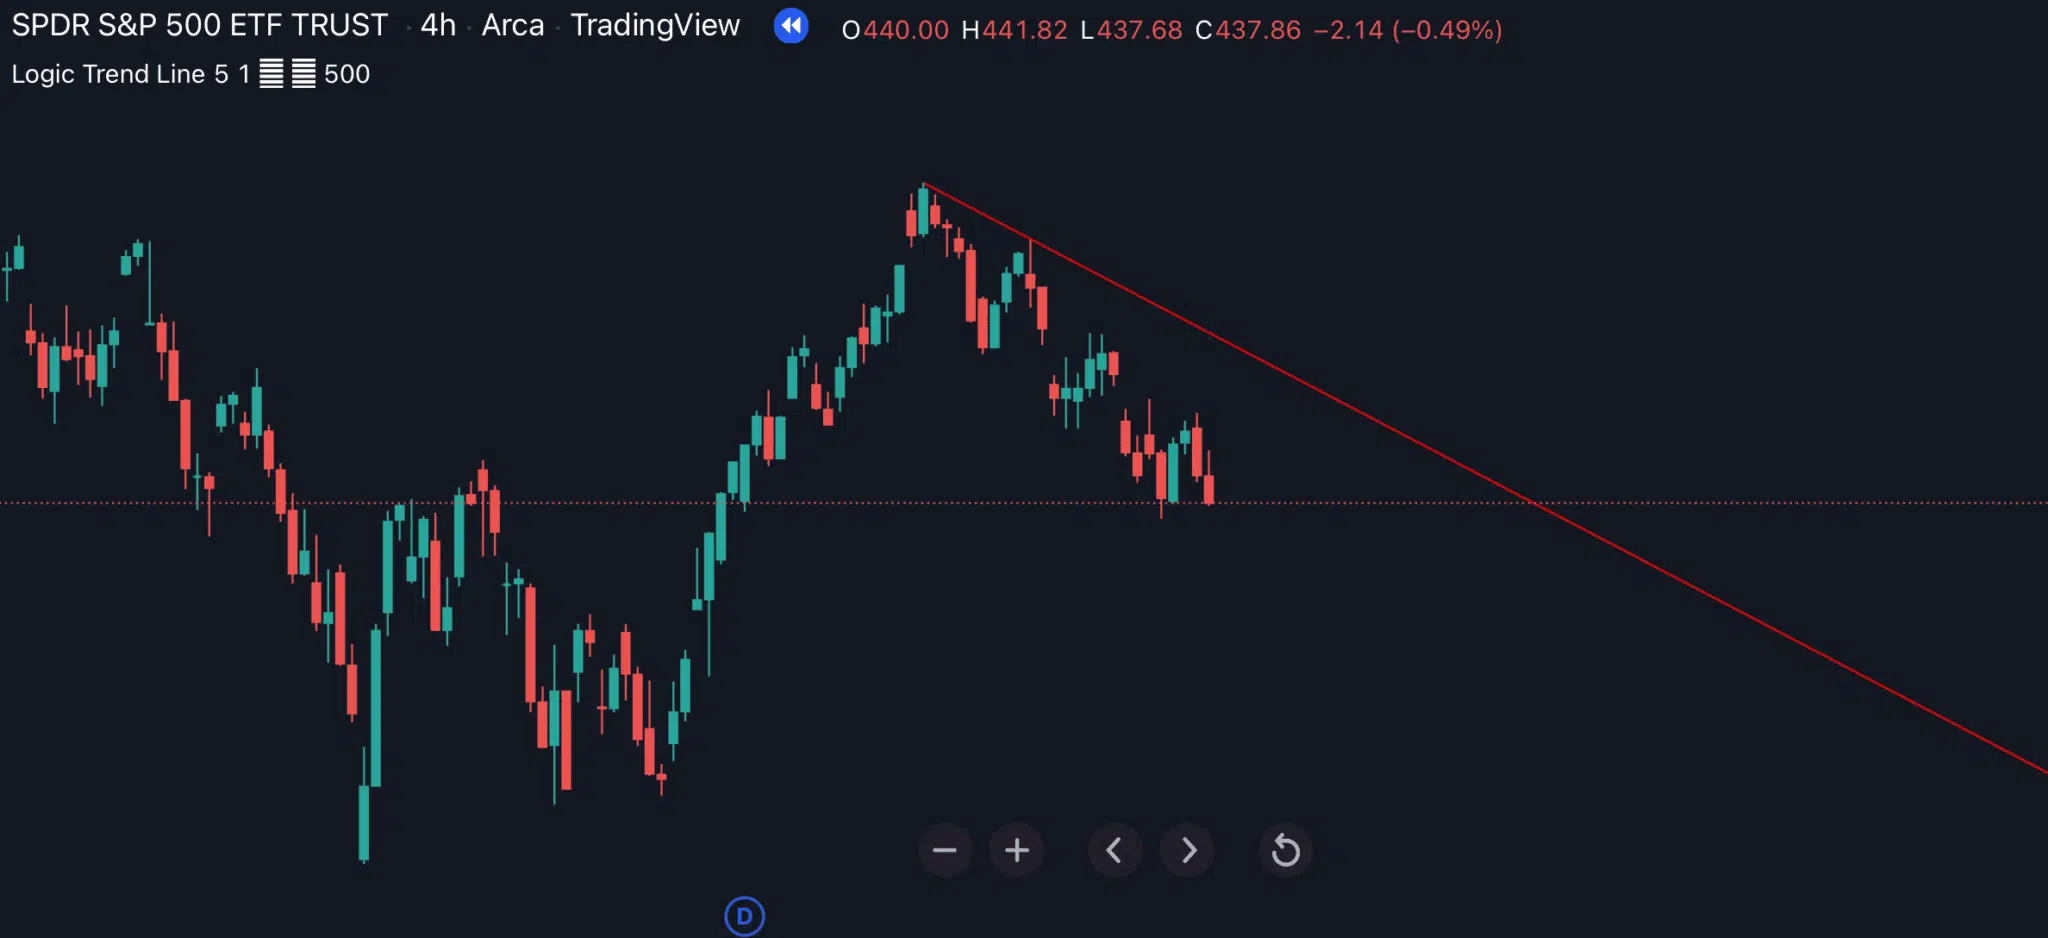
You put the indicator on your chart. And it draws a trendline like this for you:
I call it The Reversal Trade. It’s pretty simple.
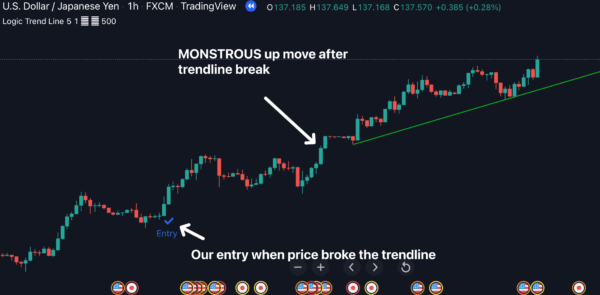
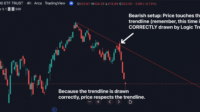
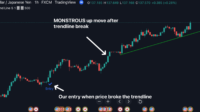
Here’s how it works: When price breaks through the Logic Trendline, there’s a high probability that a REVERSAL will happen In other words, price will continue in that reverse direction.
So you can just sell when price breaks through an uptrend line… and buy when price breaks through a downtrend line.
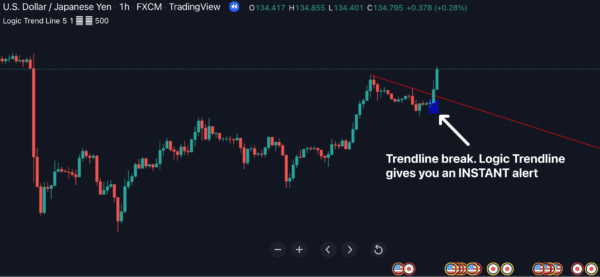
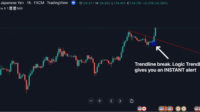
By the way, the Logic Trendline Indicator for Tradingview will generate an ALERT for you as soon as a trendline break happens.
So you will never miss out on an important trade…
Timely alerts, so you won’t miss out on important trades.
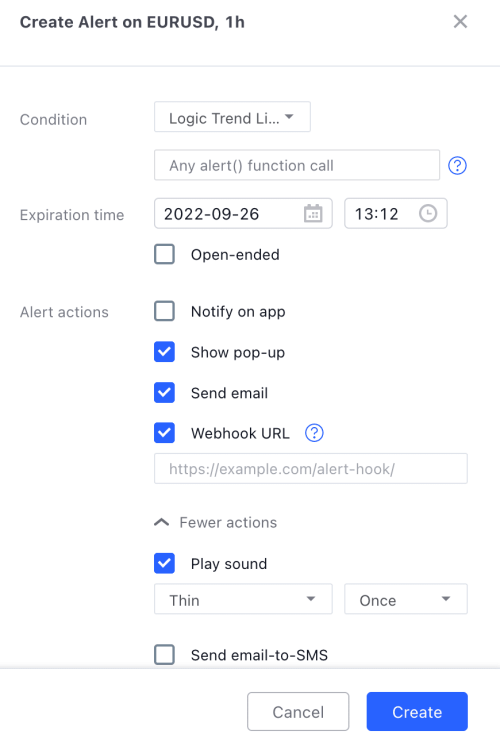
You’ll get all kinds of alerts: Pop-up, Sound, Email, and Push Notifications as soon as a new zone appears…
And you can customize these alerts in any way you want.
Frequently Asked Questions
After purchasing, you’ll fill out a short form that asks for your Tradingview username. And then, we’ll grant your username access to all our indicators within 24 hours.
It works on ALL markets internationally that are available on Tradingview: FX, stocks, indices, commodities, futures, etc…
Customer Reviews
-
-
-
Sale!
Scientific Scalper for TradingView
$299.00Original price was: $299.00.$269.00Current price is: $269.00. -

