")
")
")
")
")
")
")
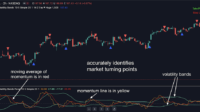
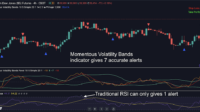
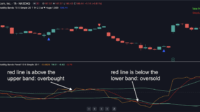
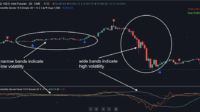
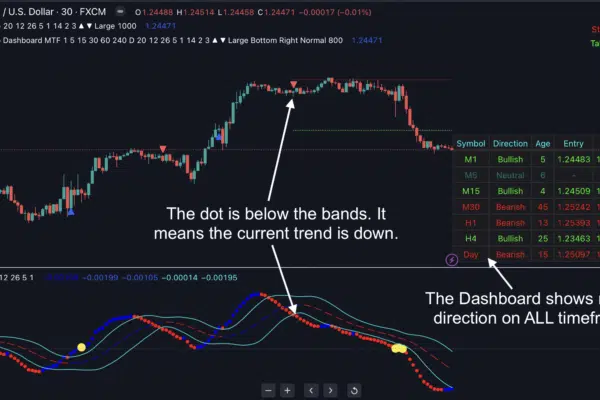
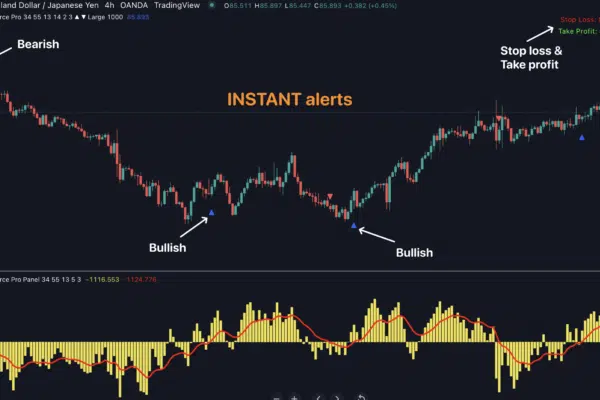
Momentous Volatility Bands for Tradingview
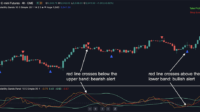
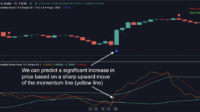
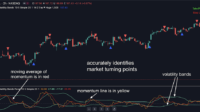
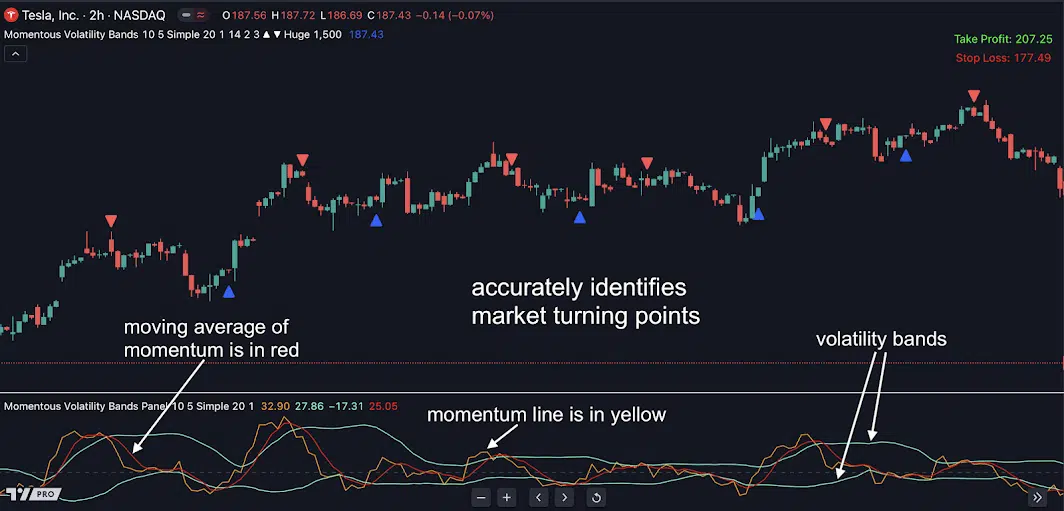
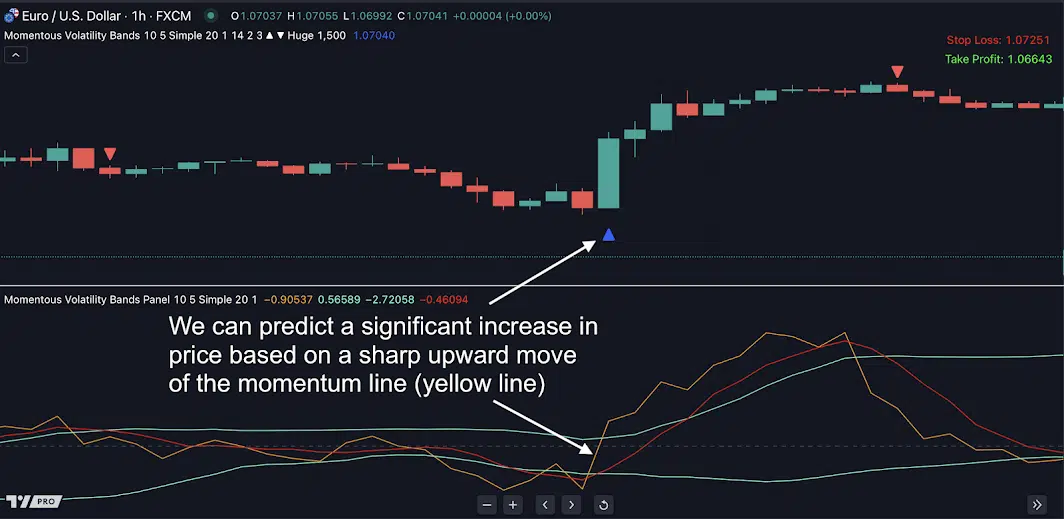
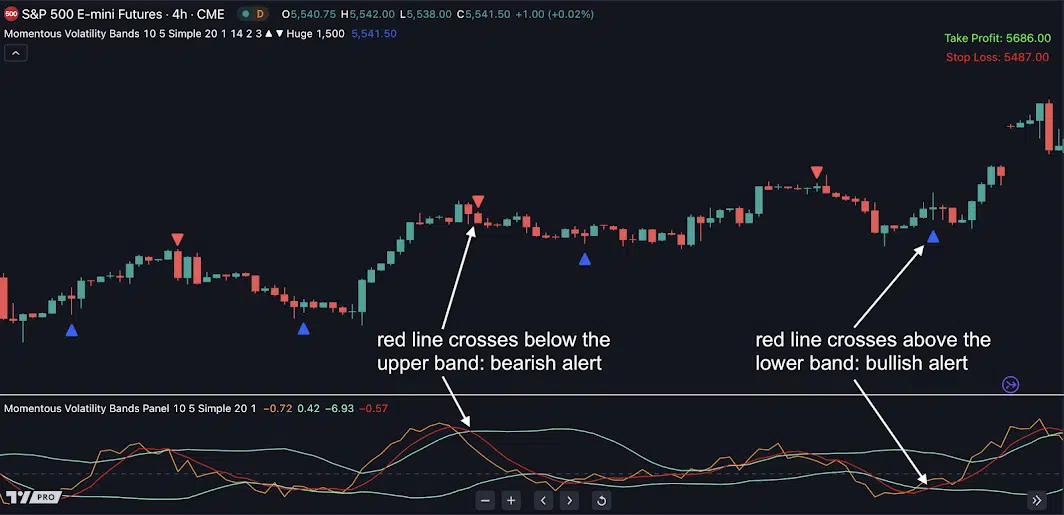
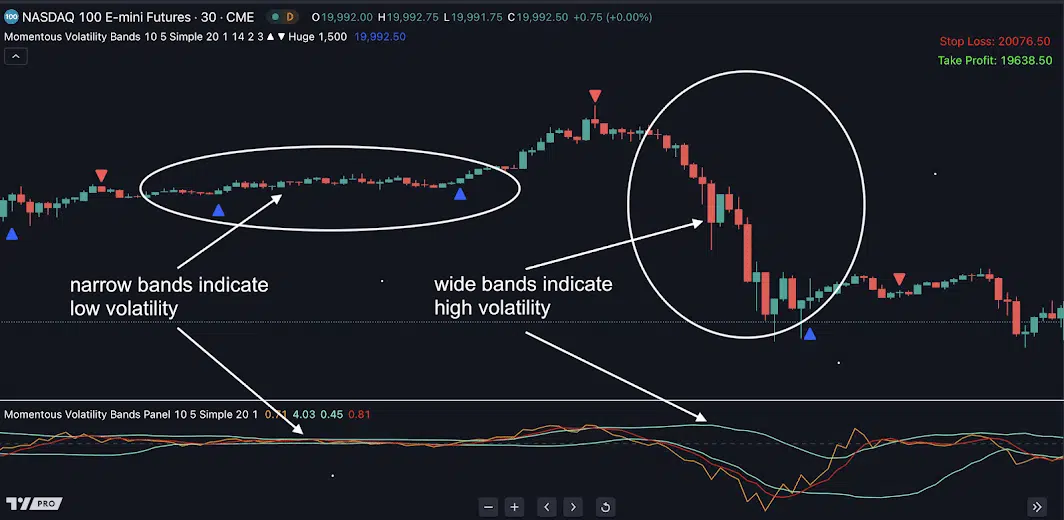
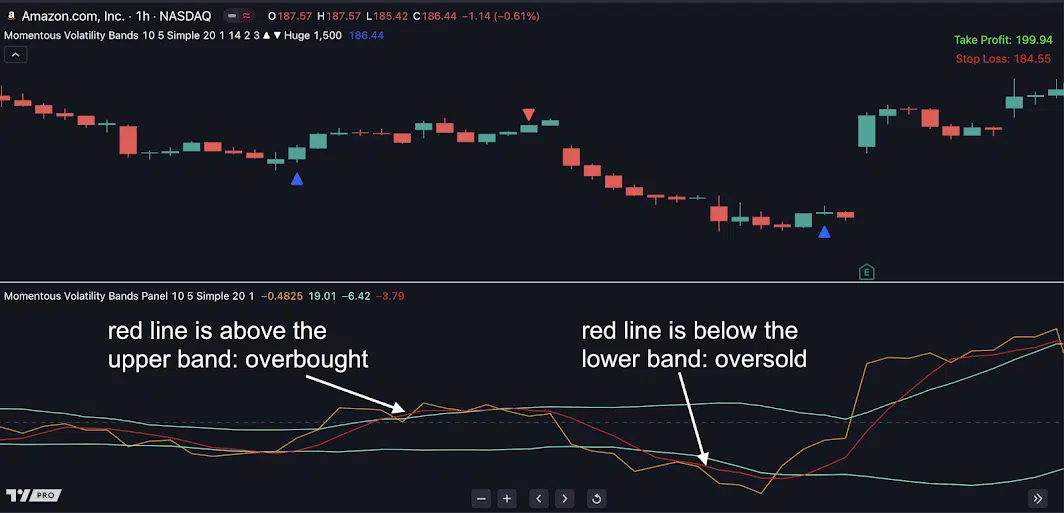
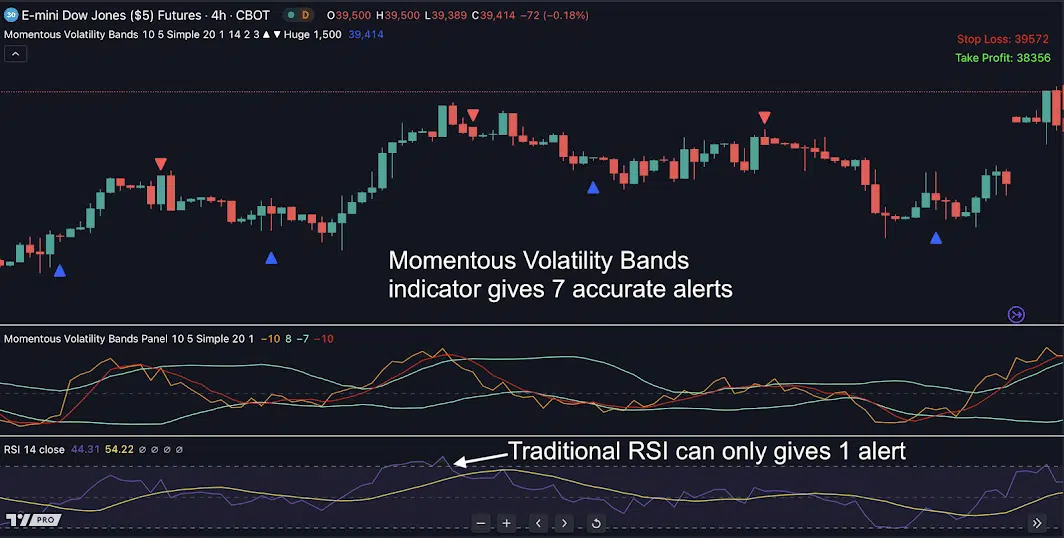
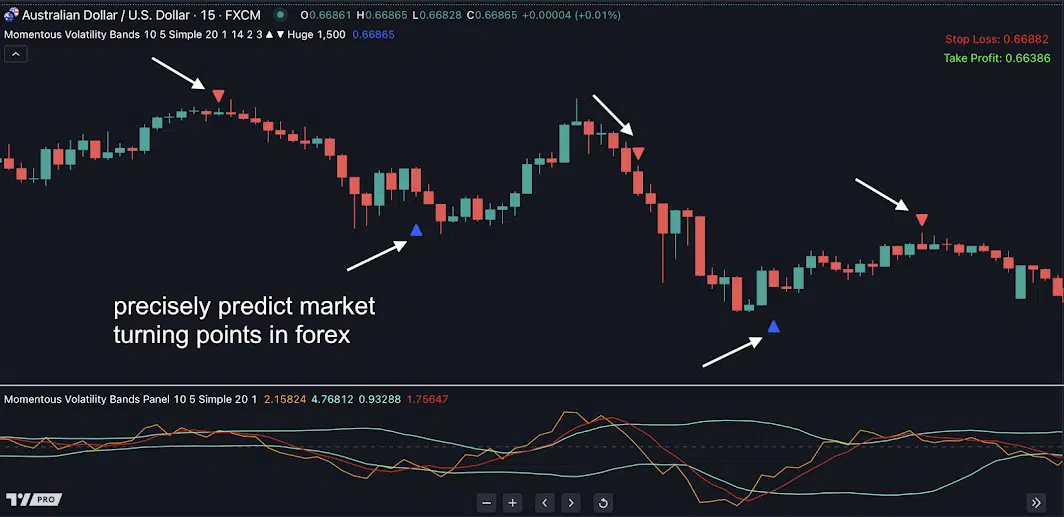
See both momentum AND volatility in ONE clear view to pinpoint ALMOST-PERFECT reversals
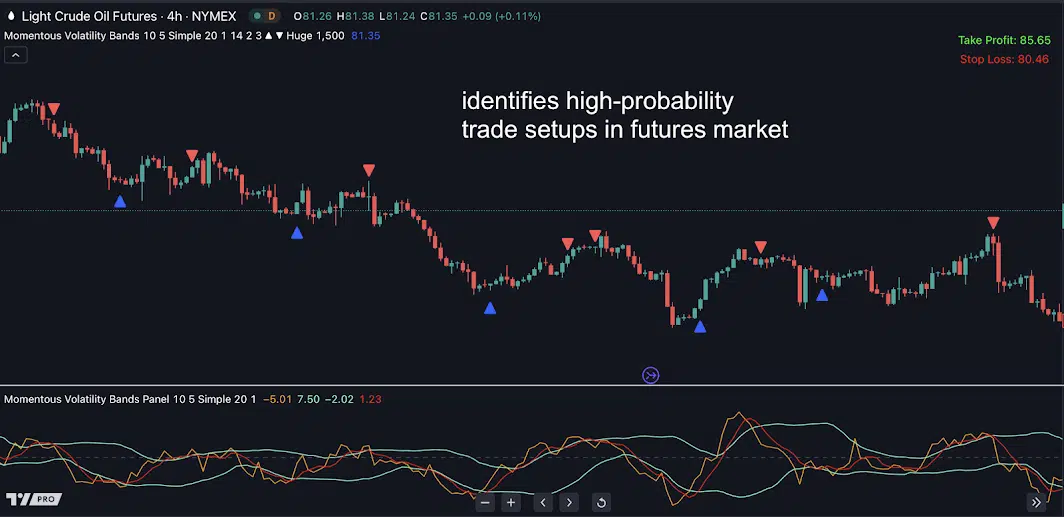
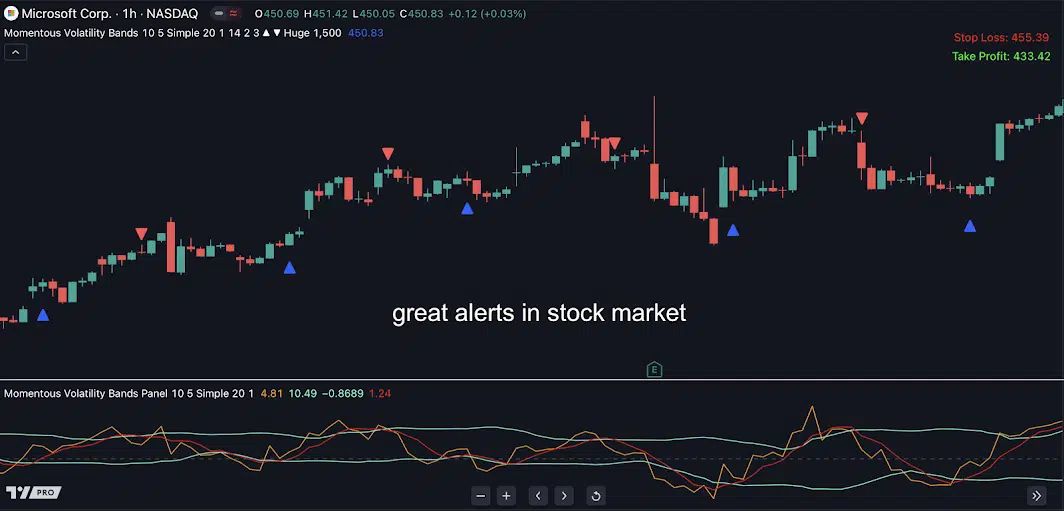
Our #1 indicator for showing you both momentum AND volatility in one clear view. Instead of piecing together conflicting signals from multiple indicators, you see everything you need in one perfect view.
Original price was: $299.00.$104.65Current price is: $104.65.


Momentous Volatility Bands for Tradingview
One-time payment. Lifetime access.
Frequently Asked Questions
Customer Reviews
-

65% OFF
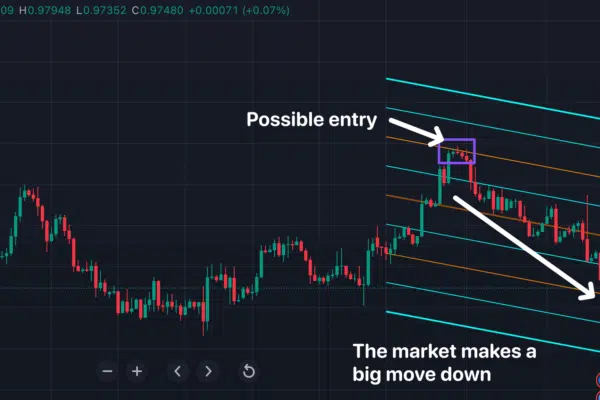
Linear Regression Channel for TradingView
Original price was: $249.00.$87.15Current price is: $87.15. -
65% OFF
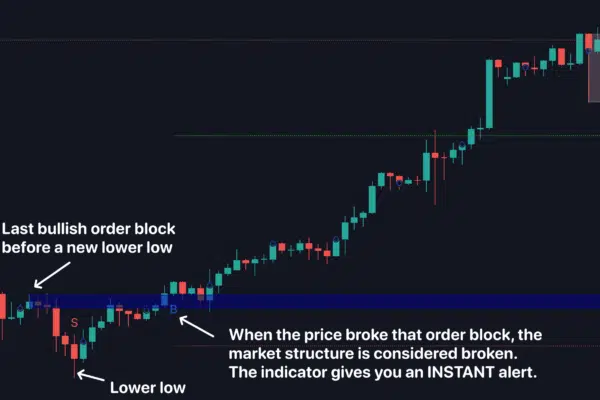
Market Structure Pro for TradingView
Original price was: $249.00.$87.15Current price is: $87.15. -
65% OFF
Volume Force Pro for TradingView
Original price was: $349.00.$122.15Current price is: $122.15. -
65% OFF
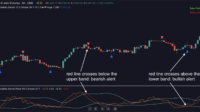
MACD Bollinger Pro for TradingView
Original price was: $299.00.$104.65Current price is: $104.65.