Donchian channel strategies are among the most underrated tools in technical analysis. Luckily, this article reveals how traders can improve their results using the donchian channel today.
In the diverse world of technical analysis, inventive indicators have become a solace to many. Among such is the Donchian Channel, which is more than deserving of today’s spotlight for its proven efficiency.
Continue reading this post to learn all about this tool, including its calculation, application, and recommended combination with technical patterns. As a perk, you’ll receive an exclusive trading system based on its fundamentals for mind-blowing results.
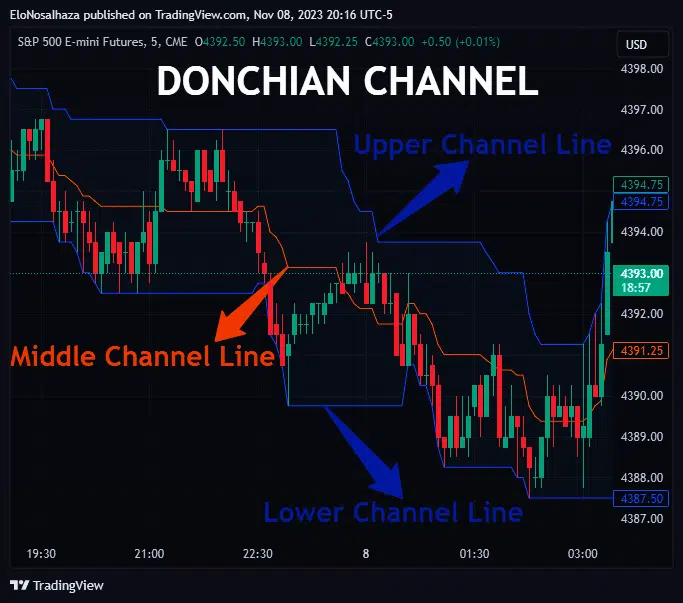
Donchian Channels, named after 20th-century Richard Donchian, is a technical indicator comprising three bands (lines).
The Upper Band (Upper Channel Line) indicates the highest price over a particular look-back period, while the Lower Band (Lower Channel Line) is the lowest over such a timeframe.
A middle channel line (sometimes omitted) is also present. It is the average of the upper and lower bands.
The indicator appears best on candlesticks charts.
Simply,
Upper Band (LB) = Highest swing high over a specific look-back period
Lower Band (UB) = Lowest swing low over a specific look-back period
Middle Line = (UB + LB) / 2
The period (usually 20) may be seconds, minutes, hours, days, or even longer, depending on one’s preferred trading style.
Luckily, most trading platforms today will do all the work behind the scenes, allowing you to focus on your analysis.
The Donchian Channel may look like Bollinger Bands at first glance, but experts can quickly tell the significant differences.
The Channel has several applications, including trend confirmation and volatility assessments. Traders achieve the latter by observing the channel’s width. The wider it is, the more volatile a security’s price is.
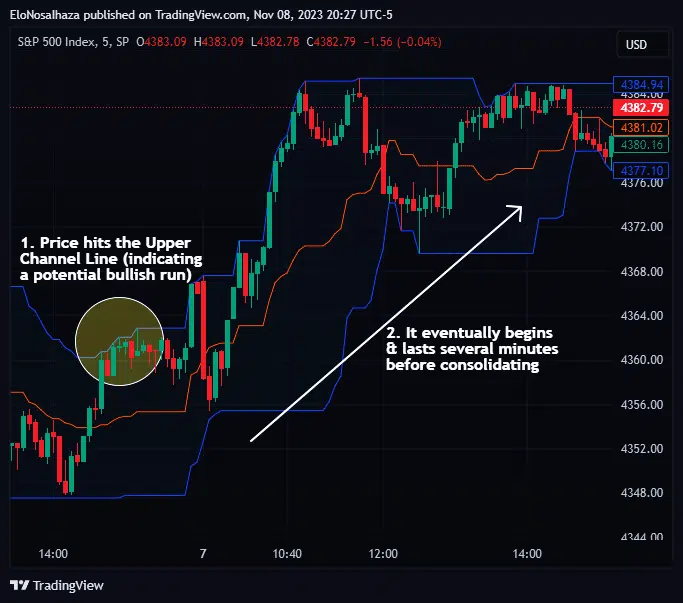
To some, the upper and lower bands can also act as support and resistance levels. However, any break of the lines typically indicates a potentially strong continuation trend.
Such breakout trading strategies are the most common operations with this indicator.
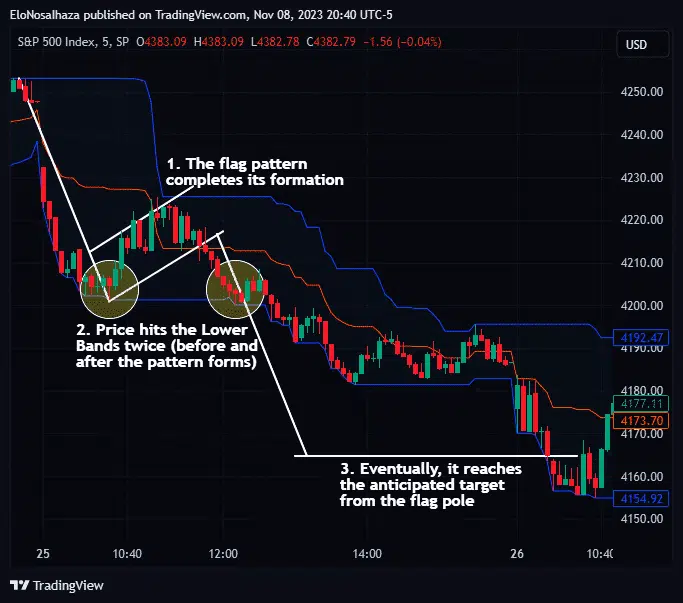
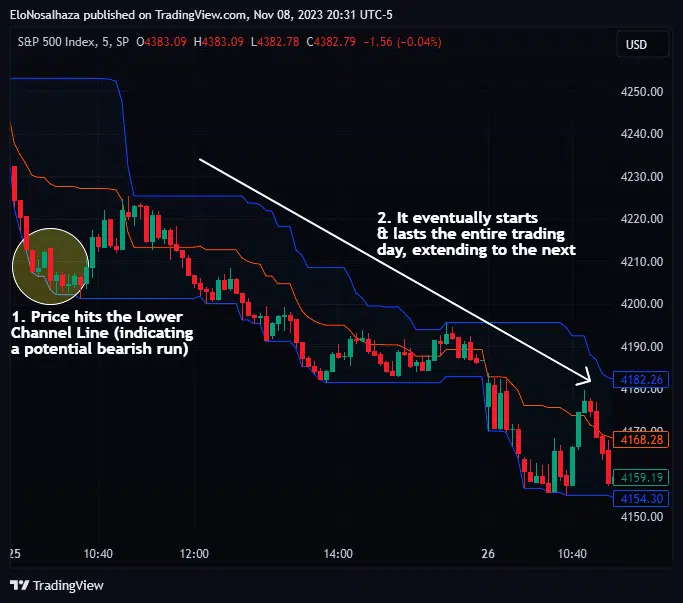
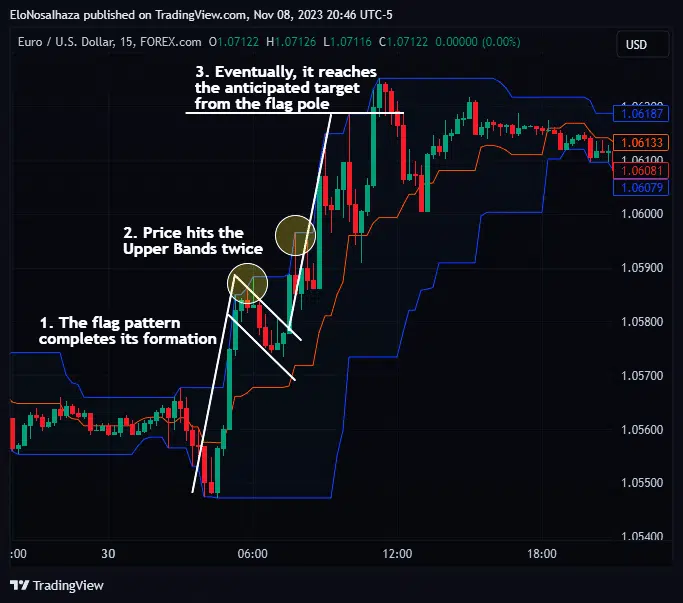
When the price tests the Upper Channel Line, it signals a potential bullish trend. Conversely, the expectation is bearish when it hits the Lower Channel Line.
The resulting trend may be long-term or short-term, depending on several factors.
That said, these forecasts don’t always pan out, primarily when using the indicator alone. Hence, traders must constantly execute necessary risk management strategies when trading.
As discussed, the this channel, like most technical tools, is more effective when implemented with other analysis techniques. Traders have combined it with unique indicators like the Relative Strength Index (RSI) and Stochastics.
Likewise, classical chartists can blend it with their enthusiasm for pattern trading. Below are live case scenarios:
Flag patterns form after a significant price movement and consolidation. Hence, traders can be assured of the trend continuation when the price also breaks above or below the channel during its formation.
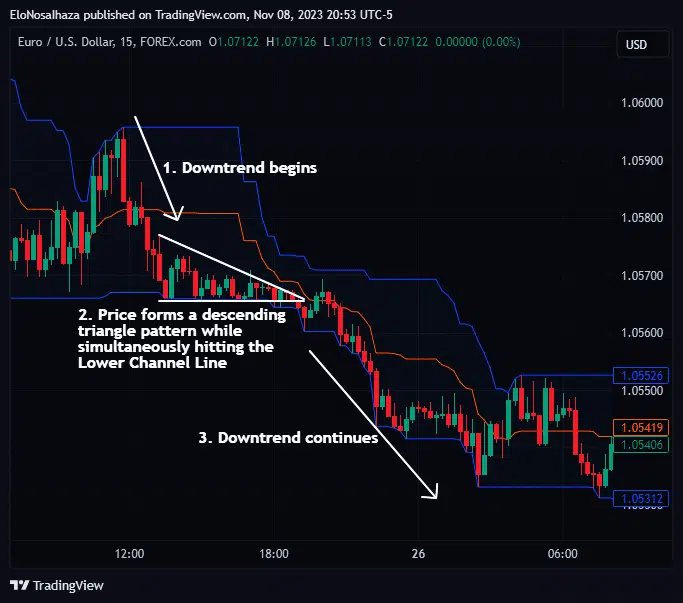
Another unmatched combo with these channels involves the triangle pattern.
Like the flag during continuation trends, technical analysts constantly monitor the price for both conditions.
The triangles formed could be ascending or descending in bullish or bearish breakouts in any market.
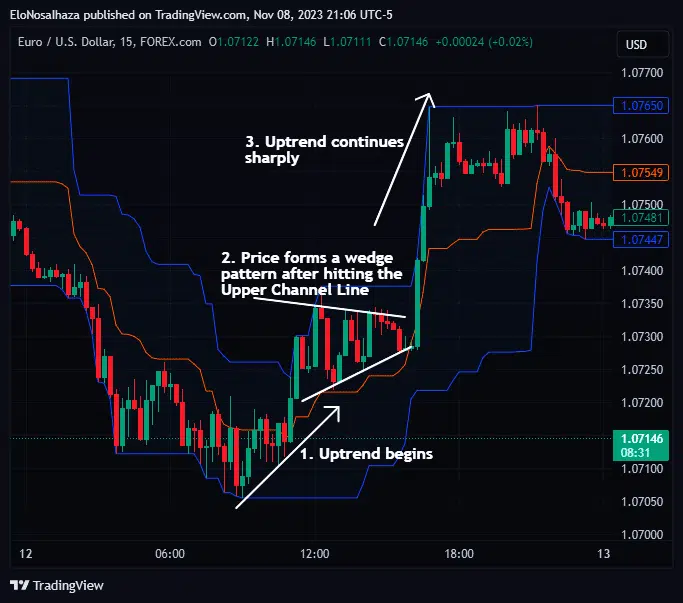
As seen below, wedge patterns can signal confident entries when merged with Donchian channels.
The price may test either channel before, during, or immediately after forming a wedge. A falling wedge indicates a bullish trend continuation, while a rising wedge is bearish.
Technical analysis is straightforward with Donchian Channels. Whether you want to confirm any trend, understand the underlying volatility, or use them for stop placement levels, it rarely gets complex when experienced.
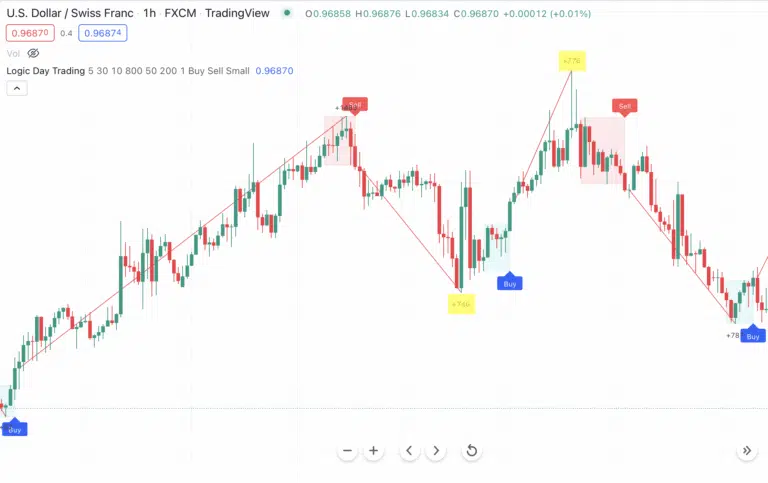
Fortunately, it can get even simpler and more automated with the Logic Day Trading Indicator for TradingView.
The customizable indicator specializes in Donchian Breakouts using price patterns for extra confirmation. It always respects the underlying trend (as generally advised), credit to its flawless algorithm.
In short, here are some incredible advantages it offers every user:
Sounds too good to be true? Click here and confirm for yourself now!
Technical analysis with Donchian Channels has contributed to some of the best trading signals ever. Investors use them for support and resistance, volatility assessment, and trend identification.
However, its most common use is in breakout trading, when the price hits the Upper or Lower Channels. The results are more impressive in combination with patterns, as seen in the top-rated Logic Day Trading Indicator.
Please leave any feedback (from questions to results) in the Comment Section, and remember to share this article with interested trading circles online.