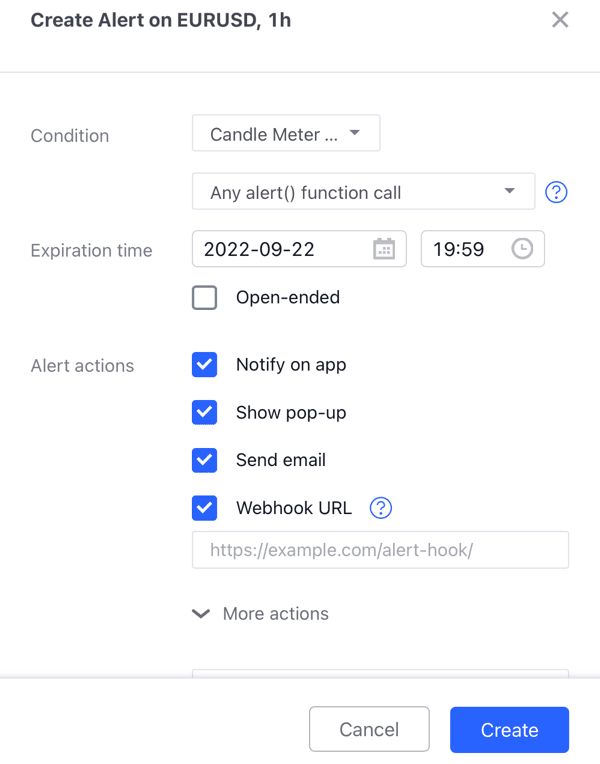
Candle Meter for TradingView

$199.00

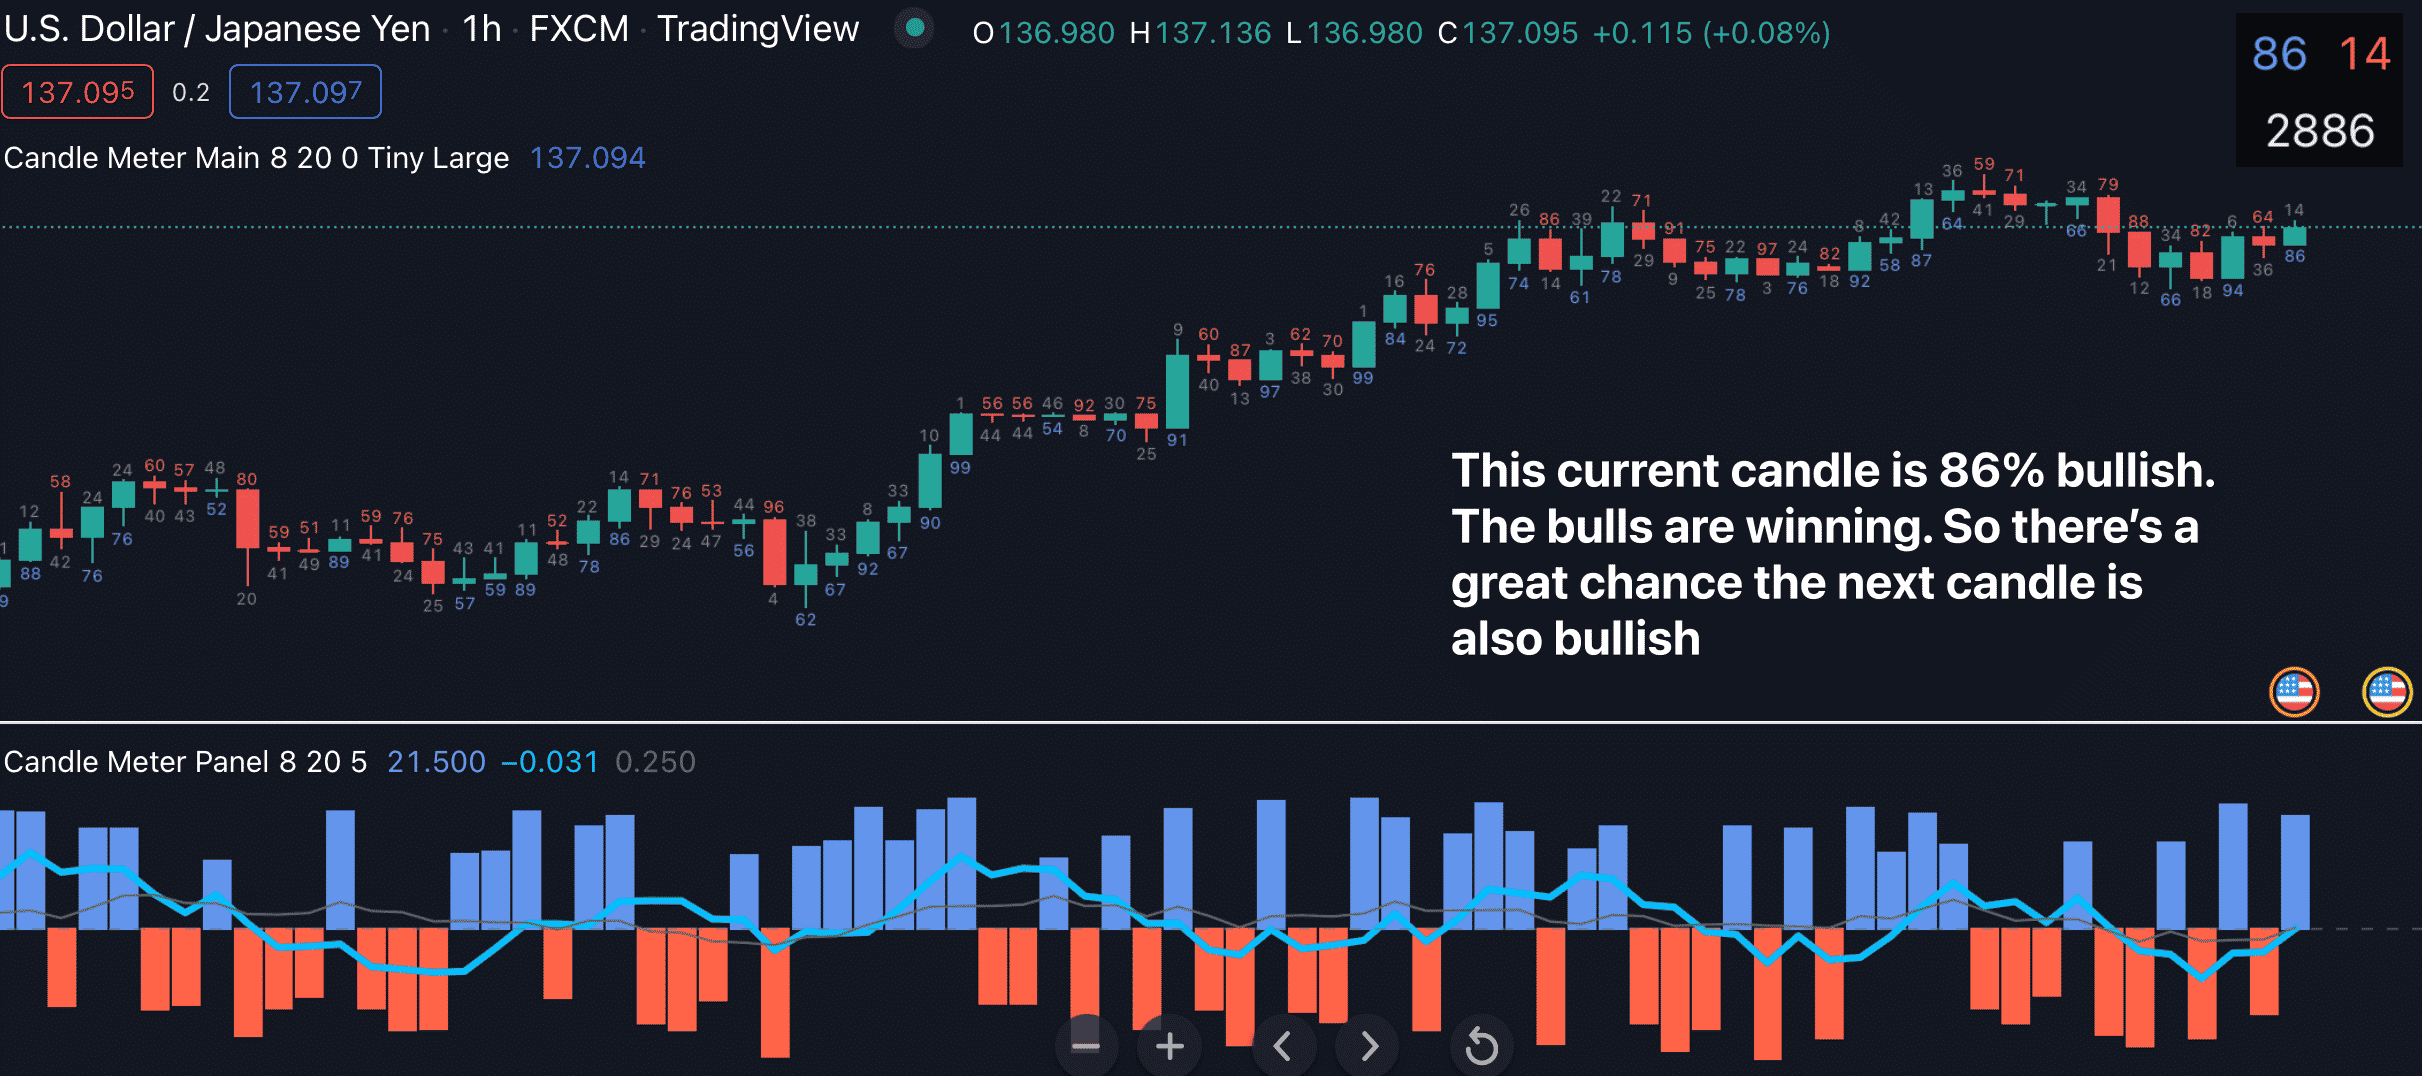
✅ Analyzes the strength of every candle in real time
✅ Tells you whether the bulls or the bears are winning
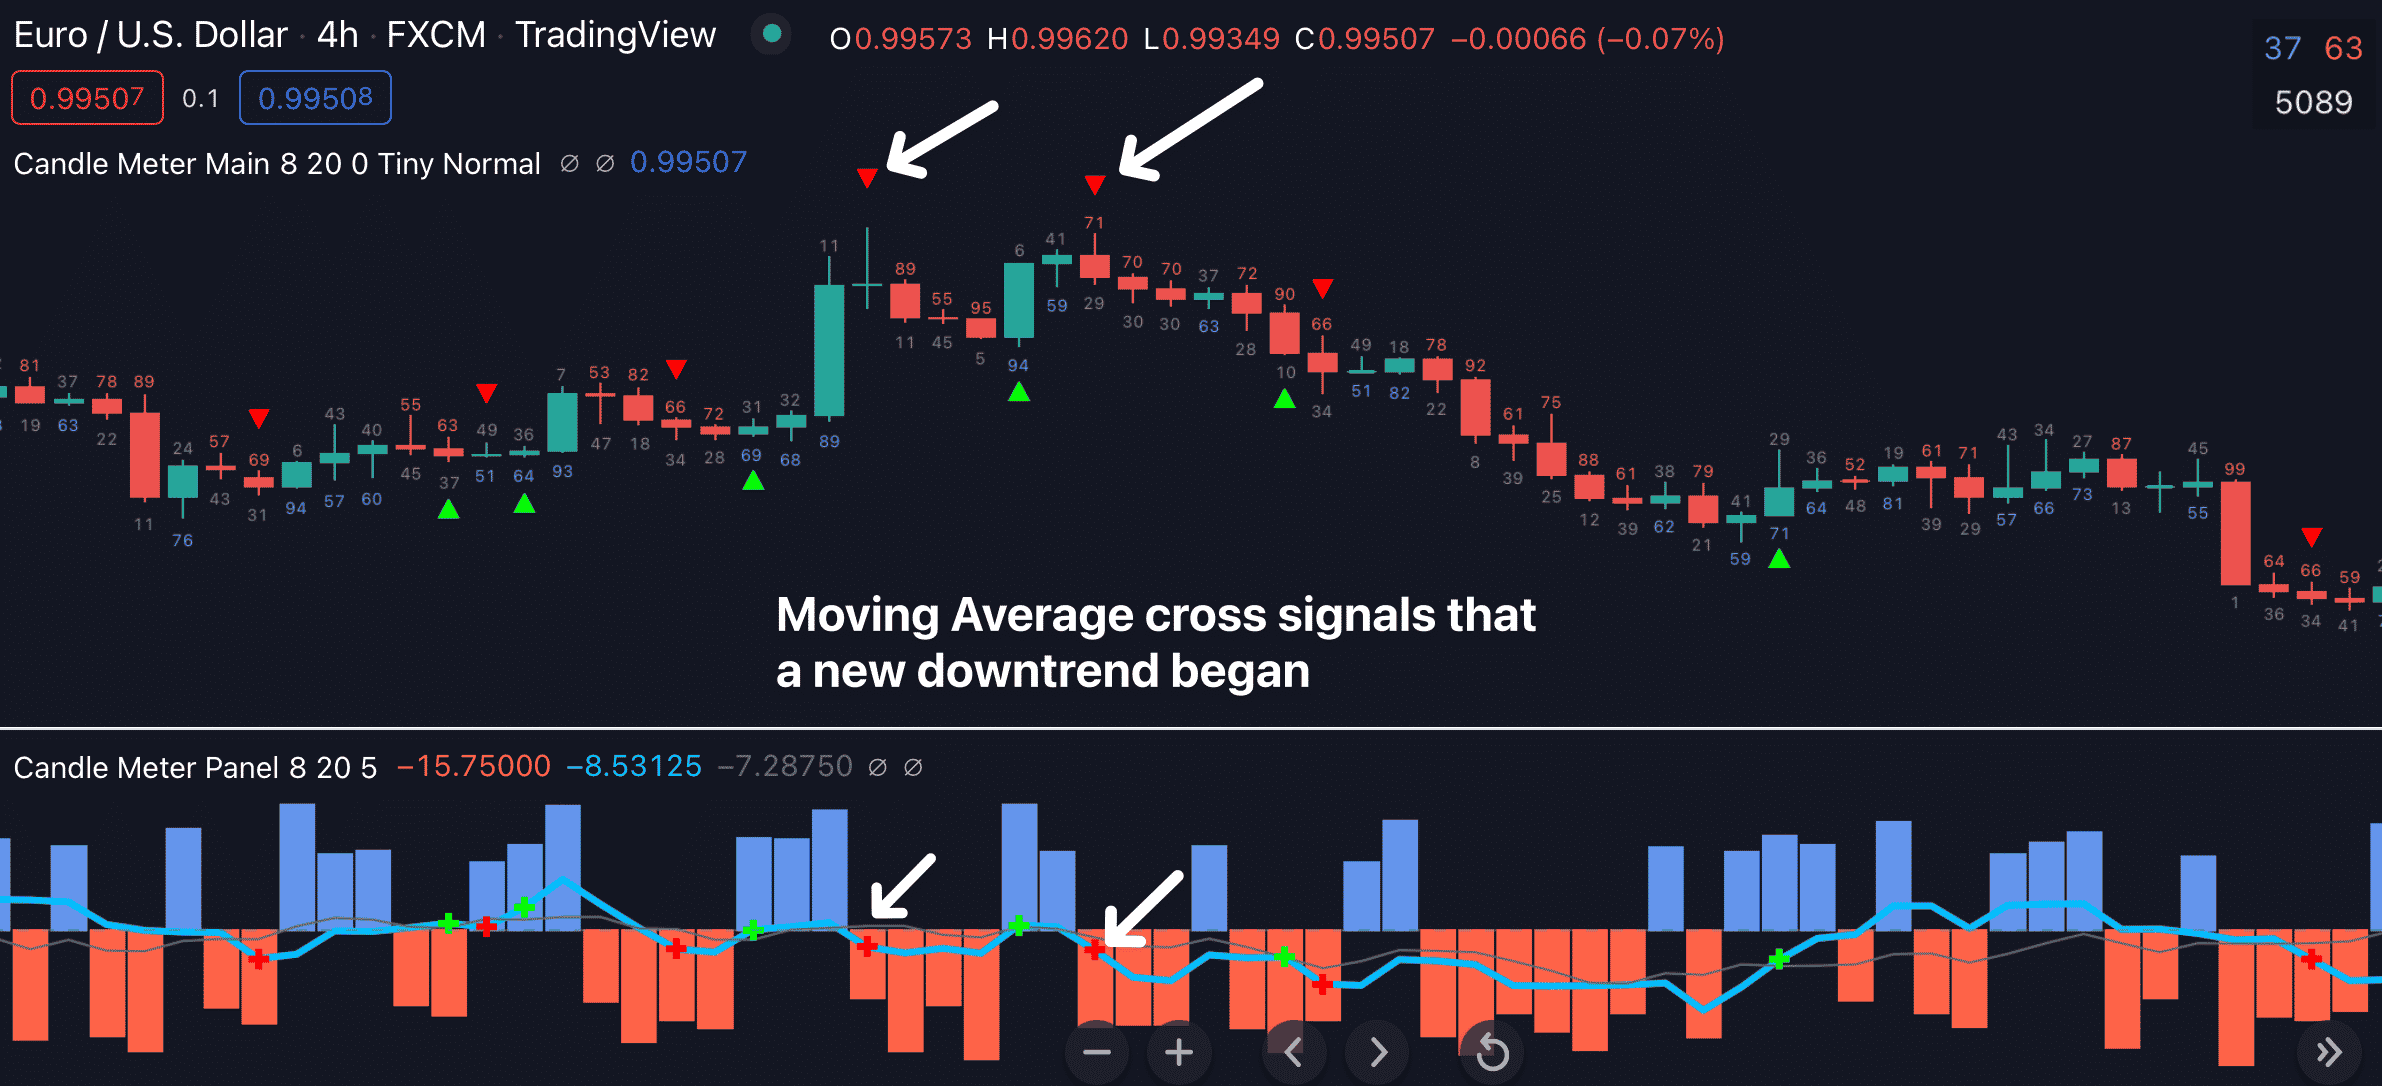
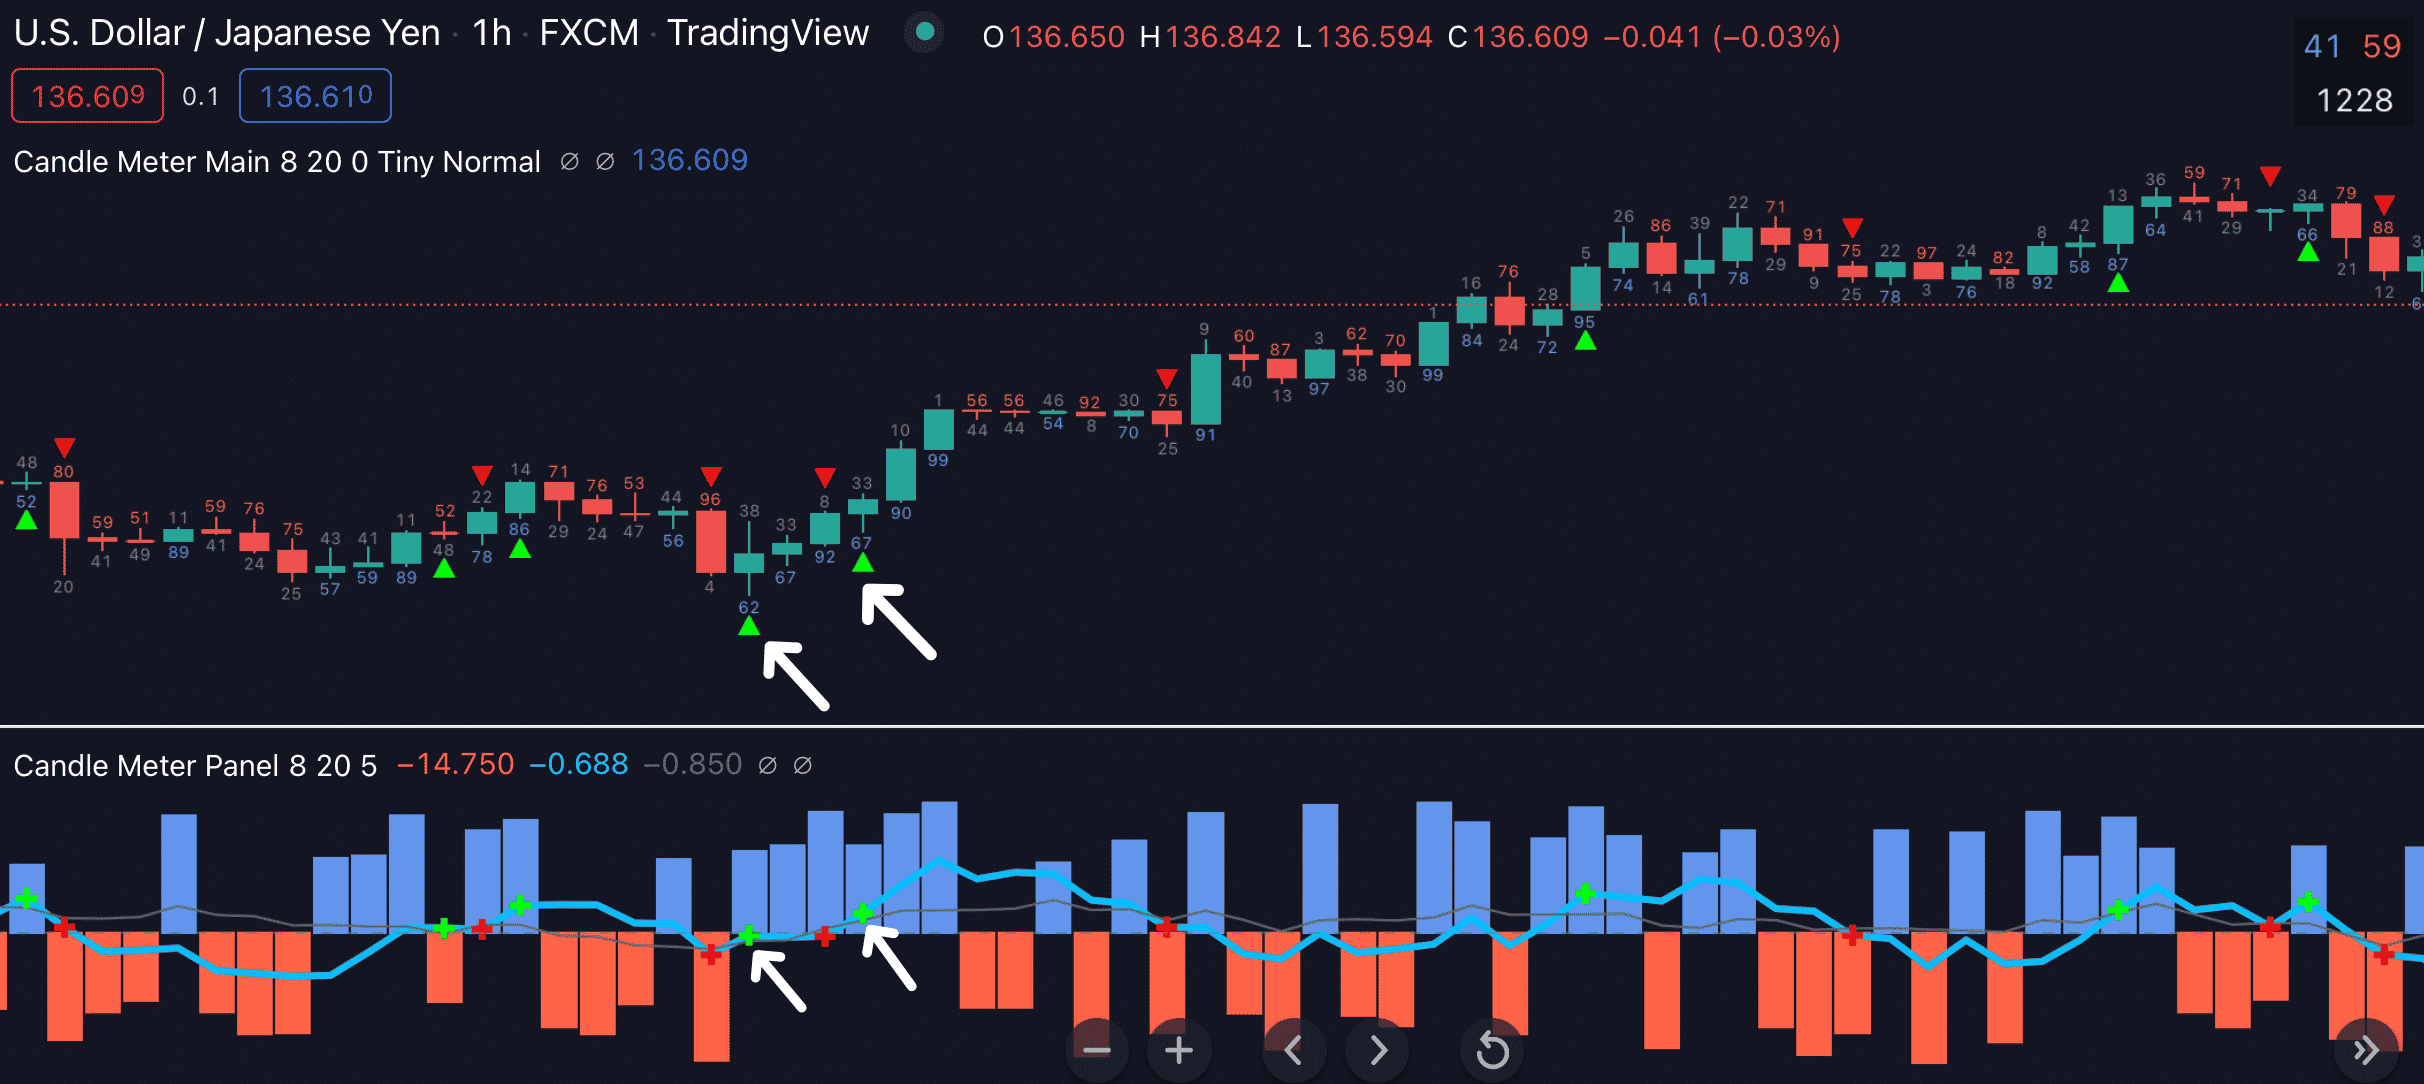
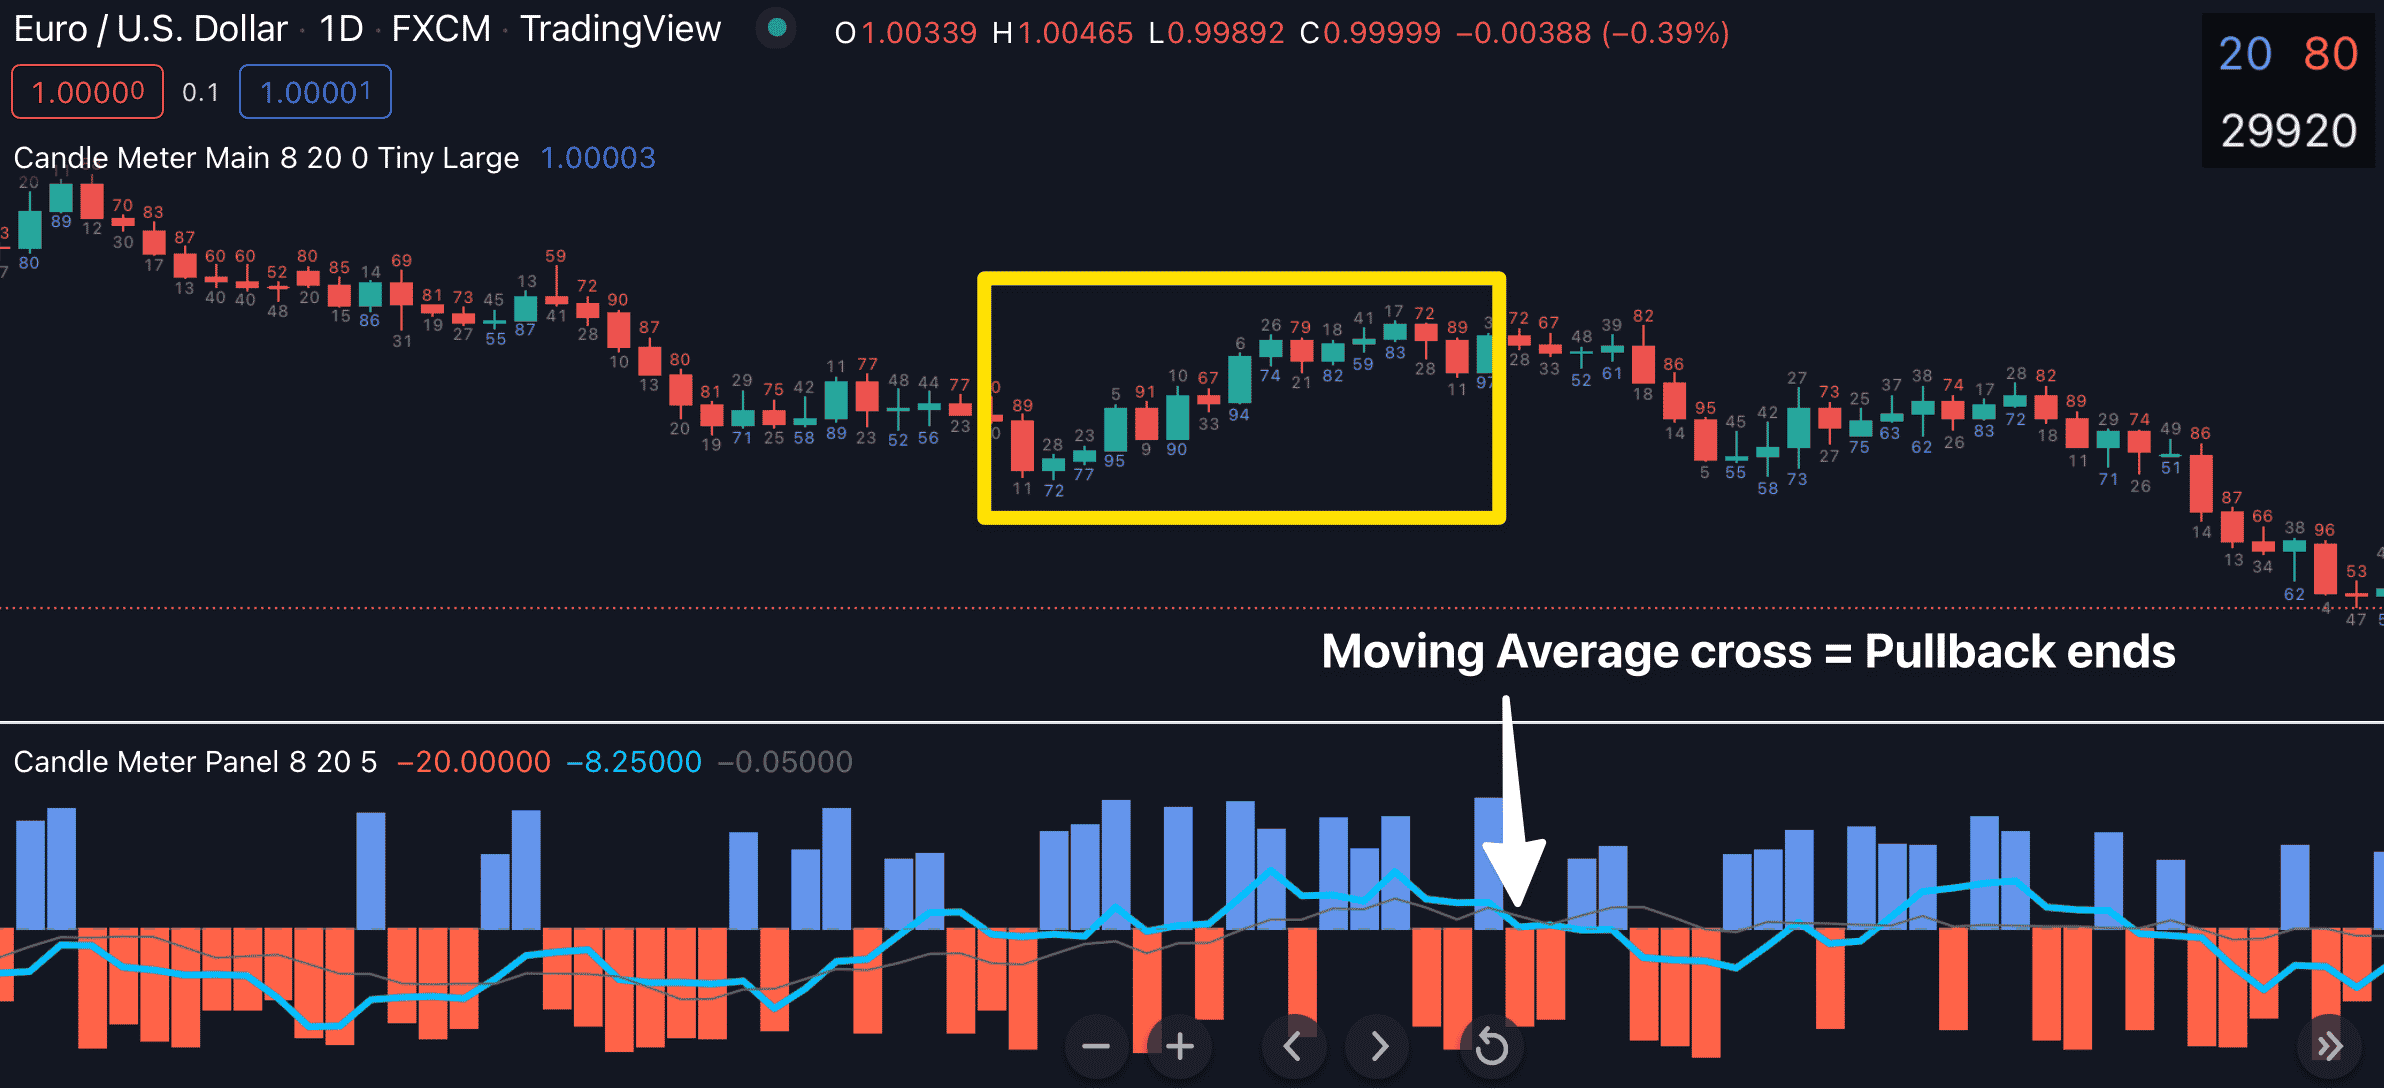
✅ Draws 2 moving averages to identify trends right from the beginning

Frequently Bought Together

+ +
Buy all these together to get this price: $397.60 Save $99.40

Hi there

Take a look at our new “Candle Meter for Tradingview” indicator below. The first thing you’ll notice is the box on the top right corner: It shows you the strength of the current candle, in real time.

And just below that is the time left until the current candle closes.

Let’s take a look closer at how this indicator works:

So… how do you interpret this “Candle Strength” value?

It’s very simple. The more bullish (or bearish) the current candle is, the more likely it is that the next candle will also be bullish (or bearish).

For example, in the photo above, the current candle is 86% bullish. So we know the bulls are dominating. And the next candle will likely be bullish.

Next…

Below the main chart, the Candle Meter indicator also draws a historgram and 2 moving averages:

The histogram helps you visual the change of the candle strength over time.

And the 2 Moving Averages helps you identify trends right from the beginning.

This special kind of moving averages based on candle strength reacts to market changes VERY FAST.

This is extremely important if you want to get in a new trend EARLY and ride it.

So, how do I trade with the Candle Meter for Tradingview indicator?

My favorite part about the Candle Meter for Tradingview indicator is that it has LESS LAG. Meaning it tells me when a new trend has begun well before regular trend indicators do.

Take a look at the chart below to see what I mean:

In this example, the 2 Moving Averages of the Candle Meter for Tradingview indicator crossed and gave you a hint that a new downtrend has begun.

This signal came very early… much earlier than what the regular, old-school indicators would have given you.

Now let’s switch to an intraday time-frame to see how well the Candle Meter for Tradingview indicator works for day trading:

A Moving Average cross gave a signal that a big market move was about to happen. And if you followed this signal, you would have gotten a nice, easy winning trade.

Now let me show you how the Candle Meter for Tradingview indicator could help you trade pullbacks successfully

In this example, the market is currently in a downtrend. Then the price starts to move up in a retracement (the area in the yellow rectangle).

During this pullback, you see a series of bullish candles.

But look at the Candle Meter historgram, notice how the strength of these bullish candles decreases over time. It tells us that the bulls are gradually losing their power.

Then finally, we got a bearish Moving Average cross. It tells us this pullback has ended and the price will soon resume its original direction.

And if you decided to take this trade and entered at the close of this candle, you would have gotten an easy winner.

That’s how easy it is to trade pullbacks with the Candle Meter for Tradingview indicator

Timely alerts, so you won’t miss out on important trades.

You’ll get all kinds of alerts: Pop-up, Sound, Email, and Push Notifications as soon as a new zone appears…

And you can customize these alerts in any way you want.

Watch this video guide to see how it works:

Setting Manuals

1. Indicator Setting – Candle Meter Main 

Fast Period: Set the period for quick-moving market trends.

Slow Period: Set the period for slower, more long-term market trends.

Display Only Values Above: Specify a threshold to display only values above this point.

Show Opposite Values: Toggle to display values in the opposite direction of the current trend.

STYLING:

Bullish Color: Choose a color for rising market trends.

Bearish Color: Choose a color for falling market trends.

Neutral Color: Choose a color for when the market shows no strong trend.

Show Table: Turn on to display a data table on the chart.

Table Background Color: Customize the background color of the table.

Label Text Size: Set the size of the text within the table.

Table Size: Set the overall size of the table on the chart.

Show Signal Arrow: Enable arrows to indicate market direction.

Up Signal Color: Choose a color for upward trend arrows.

Down Signal Color: Choose a color for downward trend arrows.


2. Indicator Setting – Candle Meter Signal

Fast Period: Adjust the period for the fast-moving component of the analysis.

Slow Period: Set the period for the slower-moving aspect, capturing longer trends.

STYLING:

Up Histogram Color: Choose the color for the histogram bars indicating upward movement.

Down Histogram Color: Select the color for histogram bars showing downward movement.

Line 1 Color: Customize the color of the first line in the indicator.

Line 2 Color: Set the color for the second line in the indicator.

Histogram Bar Width: Adjust the width of the bars in the histogram for better visibility.

Show Signal Arrow: Enable this to display arrows signaling the market direction.

Up Signal Color: Choose a color for arrows that indicate an upward trend.

Down Signal Color: Select a color for arrows pointing to a downward trend.


3. Set up alerts

To stay updated on potential trading opportunities, you can set up alerts within the Candle Meter Main.

Step 1: From the indicator settings, customize your alerts by defining your desired parameters. The selected configurations will be used for notifications in Step 2.

Step 2: To receive notifications through the app, pop-ups, alert emails, Webhook URL, sound alerts, or email-to-SMS, enable these features by clicking on TradingView’s “Alert” icon.

Step 3: Select Candle Meter Main from the “Condition” dropdown list:

Step 4: A pop-up will appear as follows. You click on “Notifications”.

Step 5: You choose the types of notifications you’d like to receive and click the “Create” button.

FAQ

After purchasing, you’ll fill out a short form that asks for your Tradingview username. And then, we’ll grant your username access to all our indicators within 24 hours.

It works on ALL markets internationally that are available on Tradingview: FX, stocks, indices, commodities, futures, etc…

All sales are final and non-refundable.

TV Champ Membership

Get instant access to the entire collection of all of our best TradingView indicators when you join our “TV Champ” membership​:

✔️ All custom indicators
✔️ All updates
✔️ All NEW indicators that we’ll release

To see the full list of all indicators included in the TV Champ membership, click here…

Reviews

Don’t take our word for it, read our customers’ testimonials from Trustpilot.com

You may also like…