Pullback Factor for TradingView
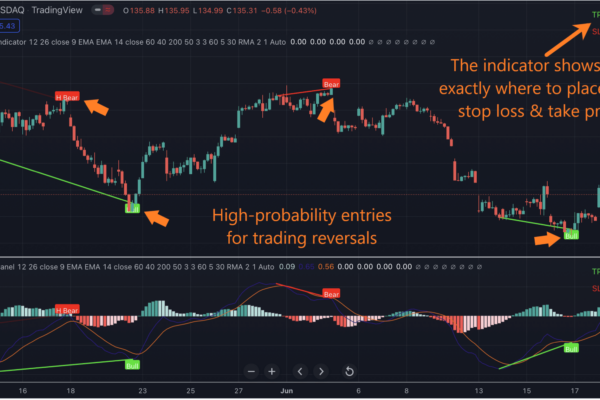
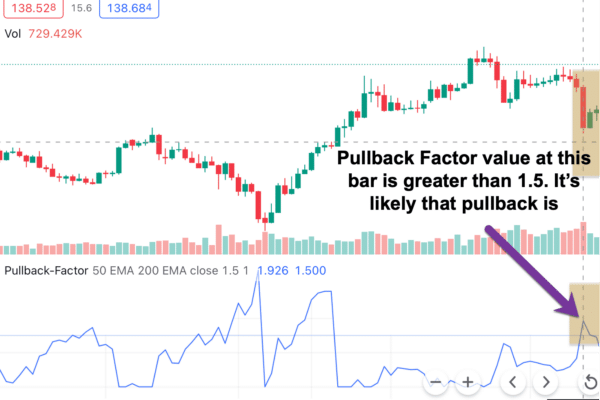
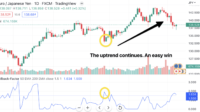
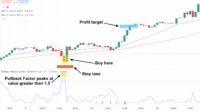
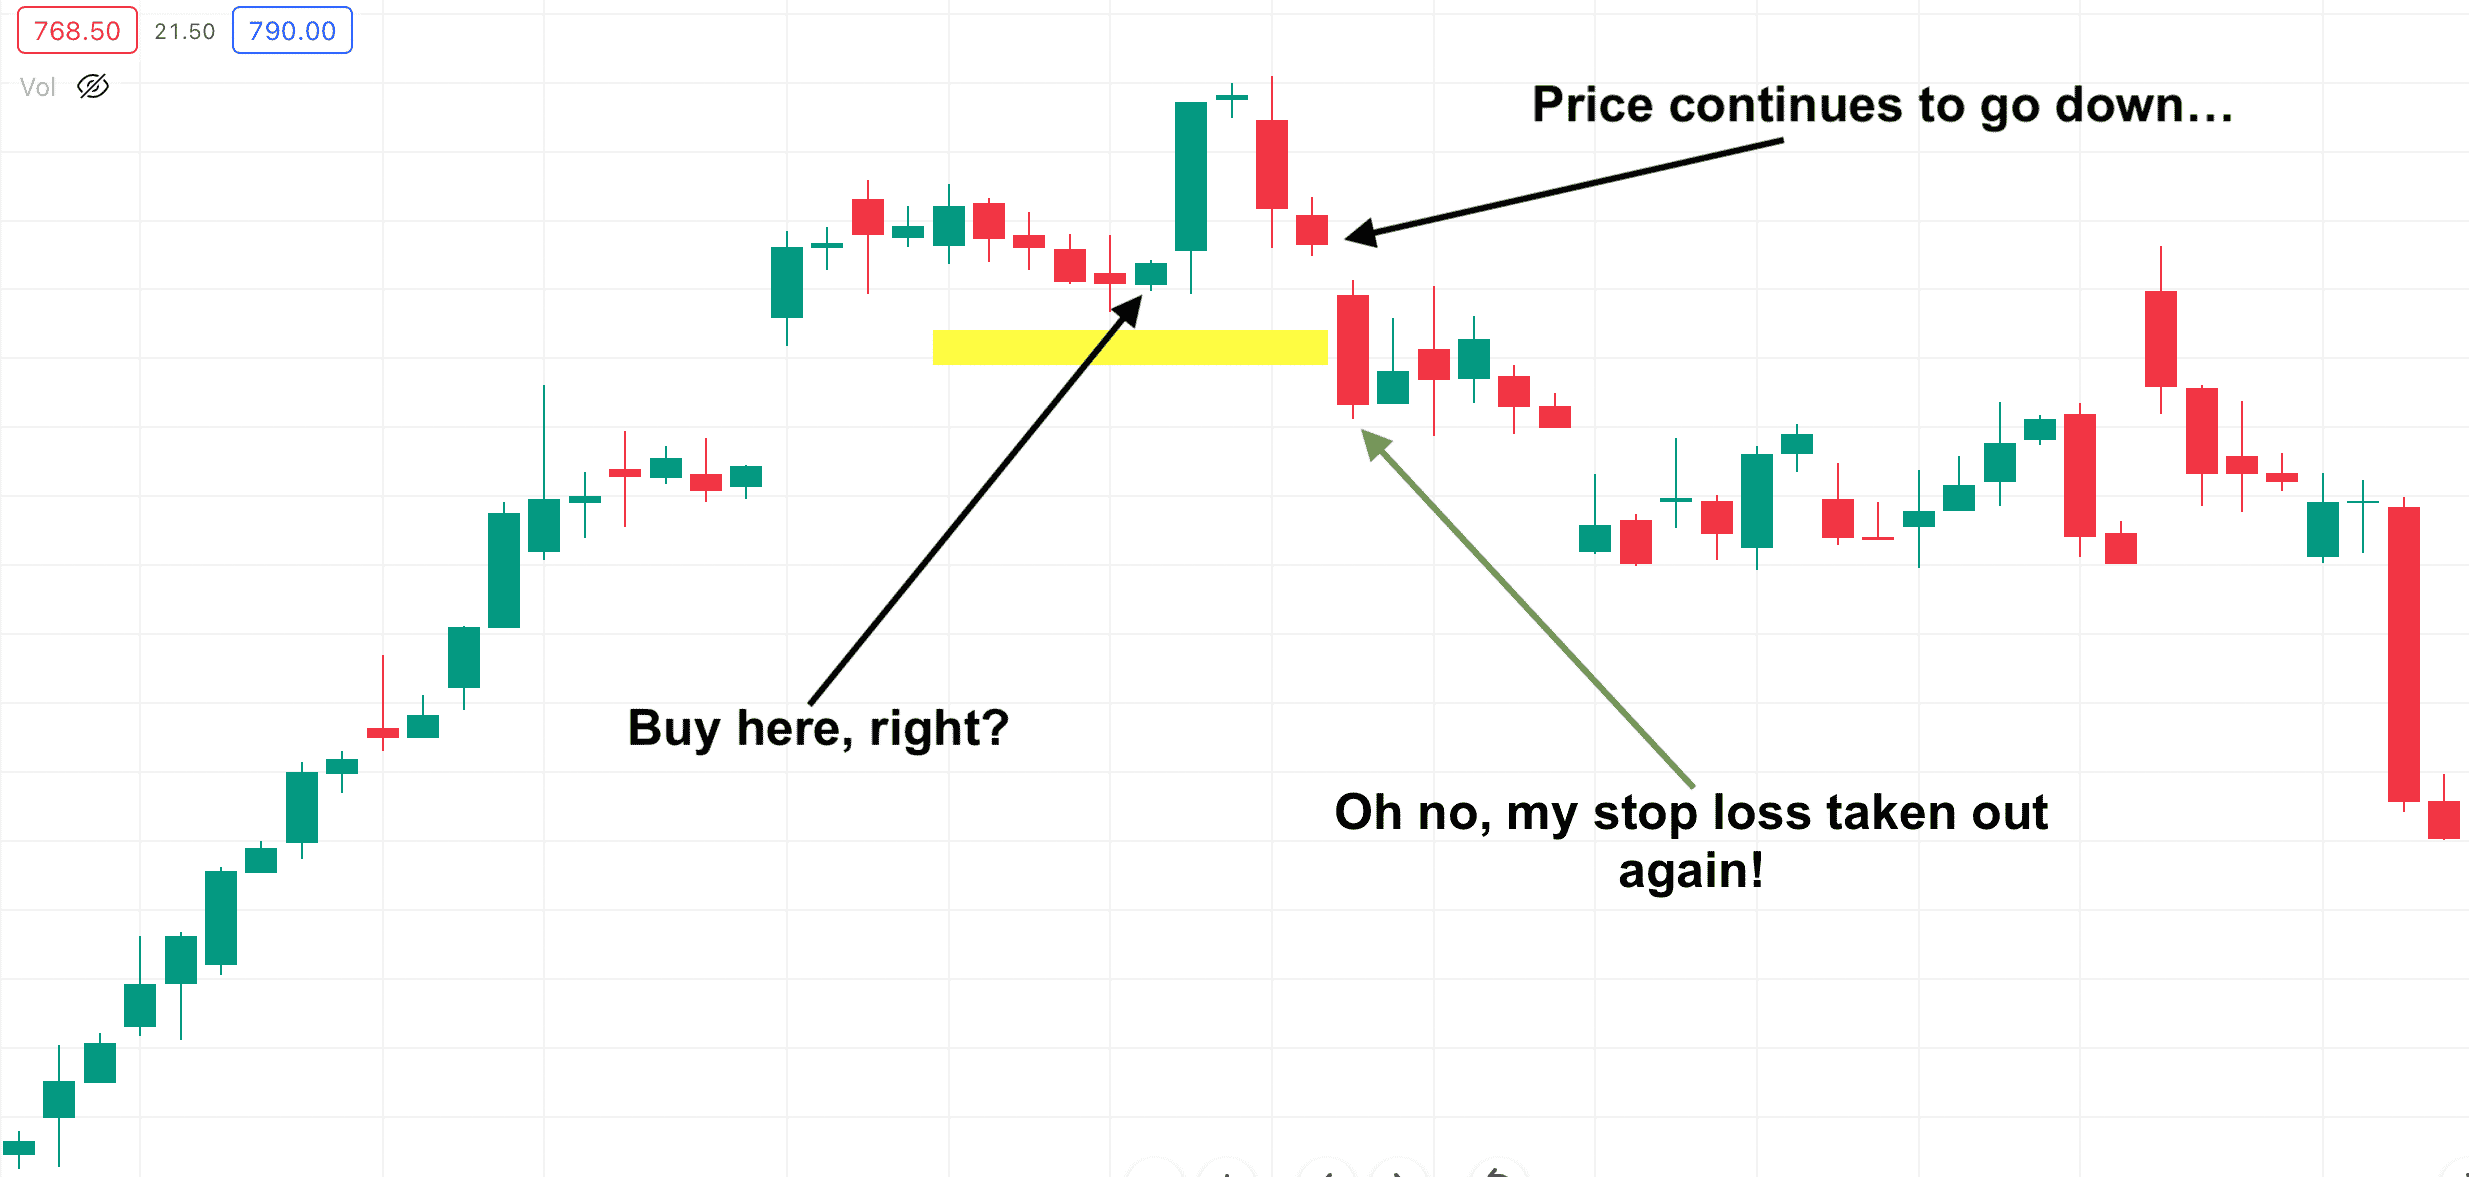
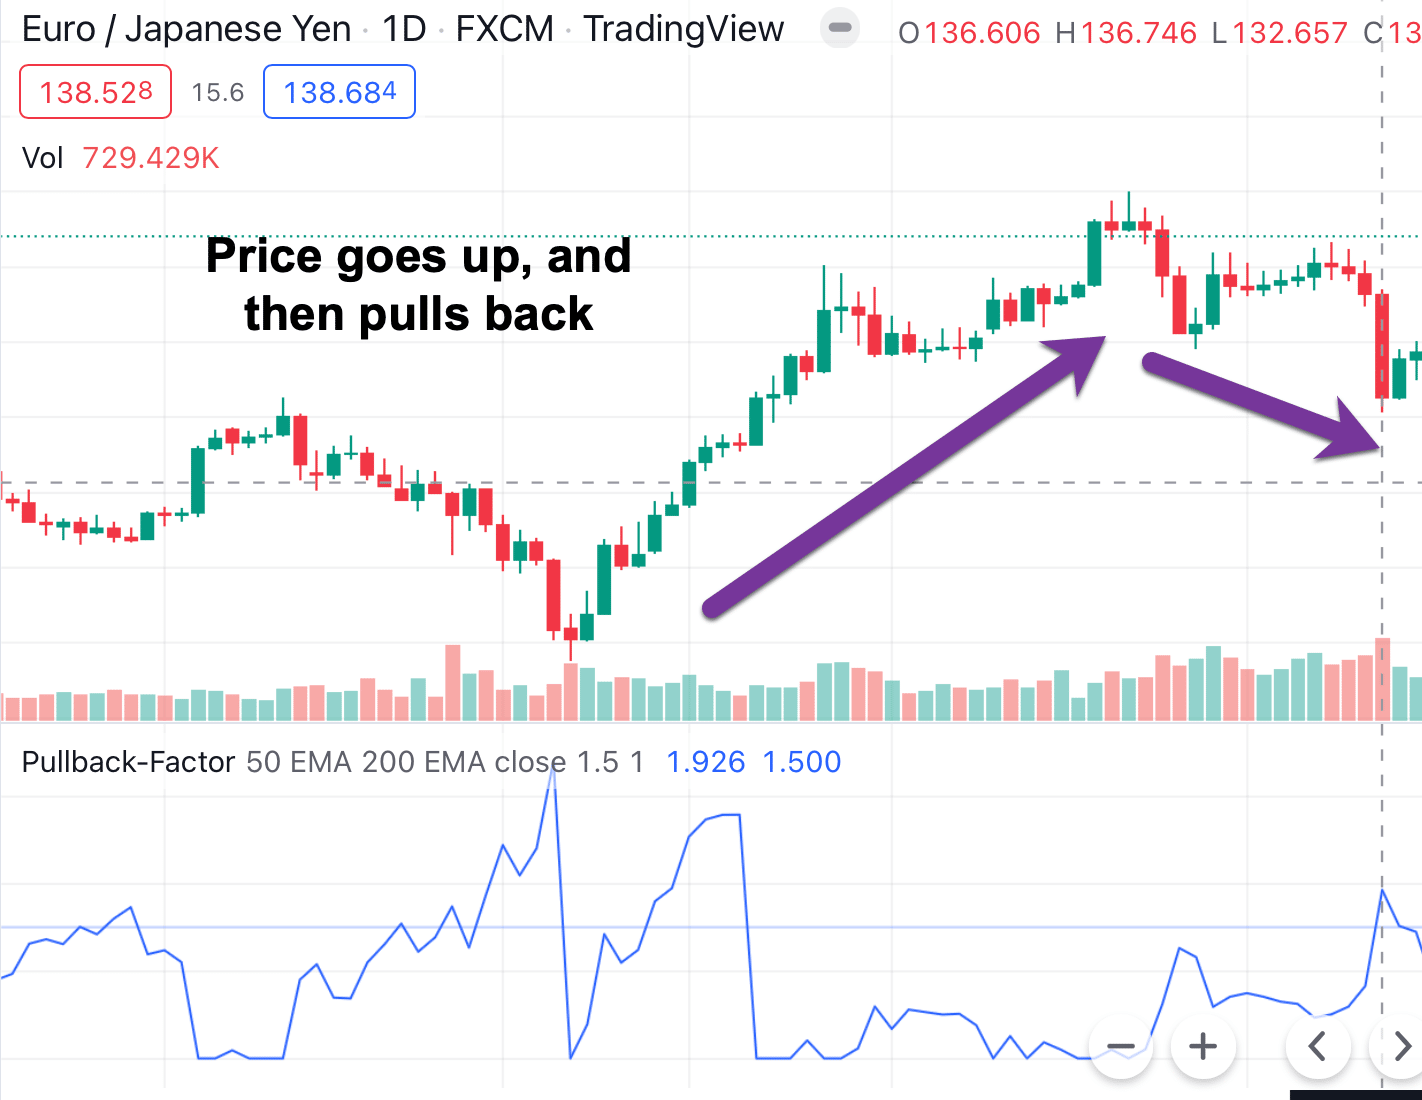
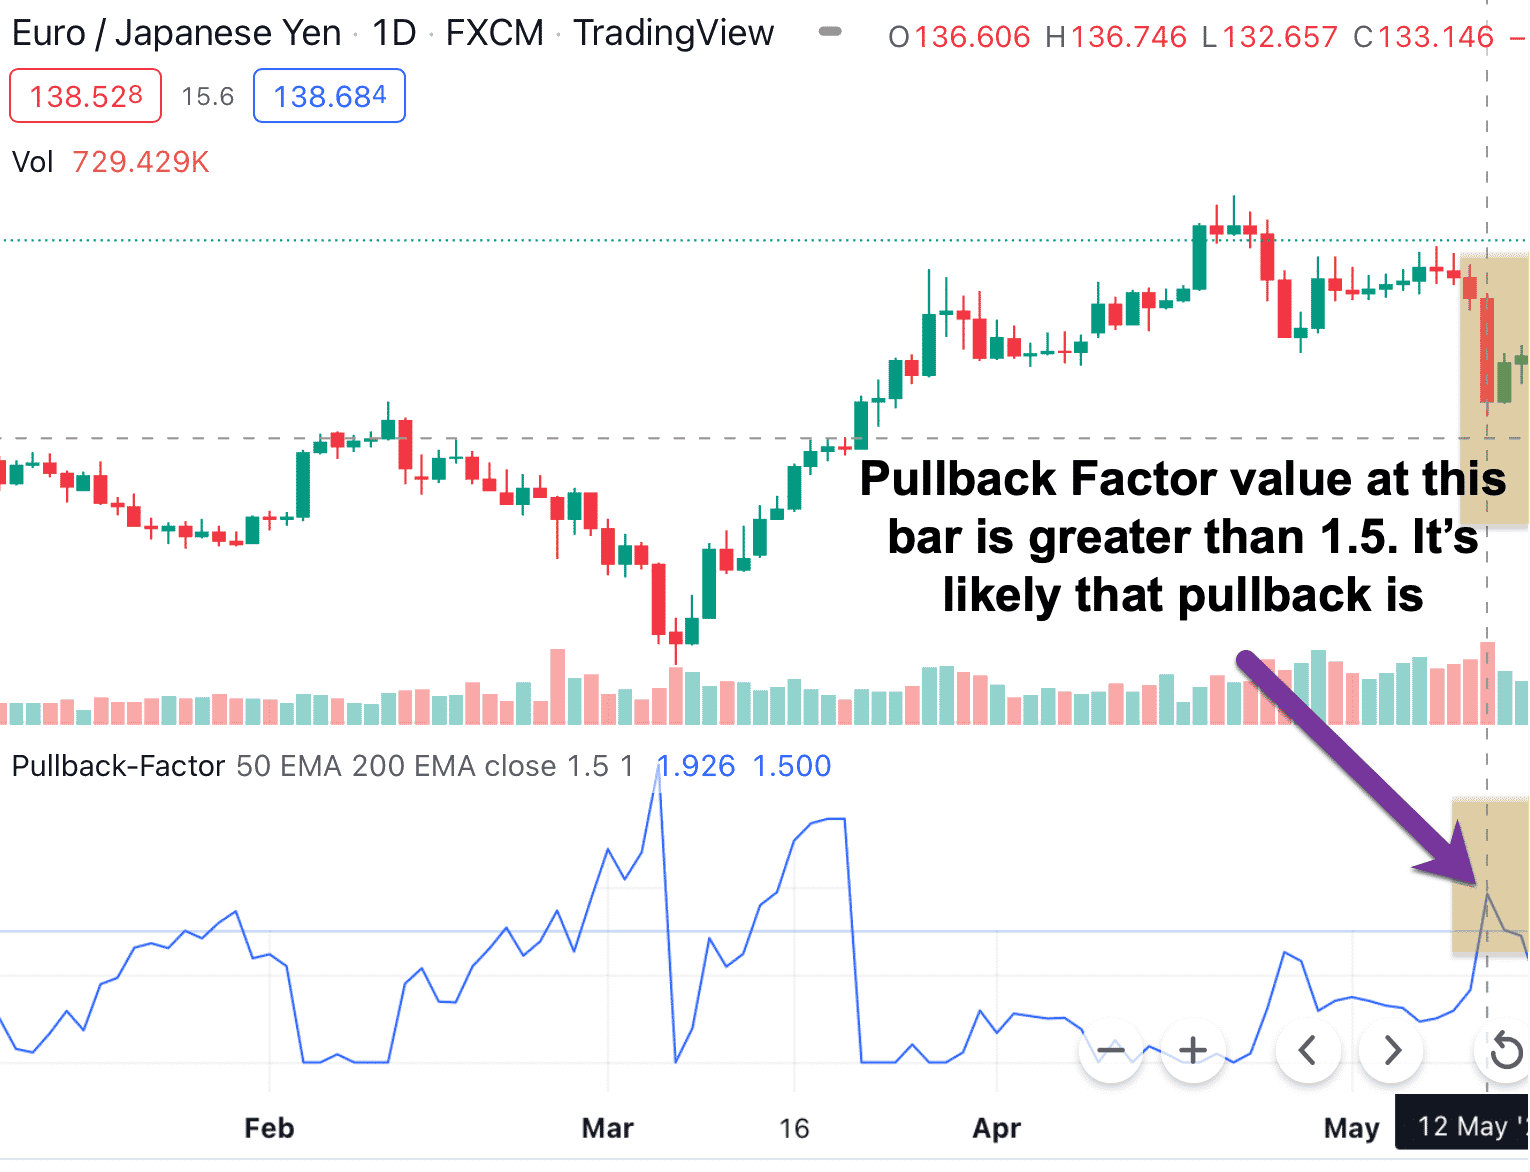
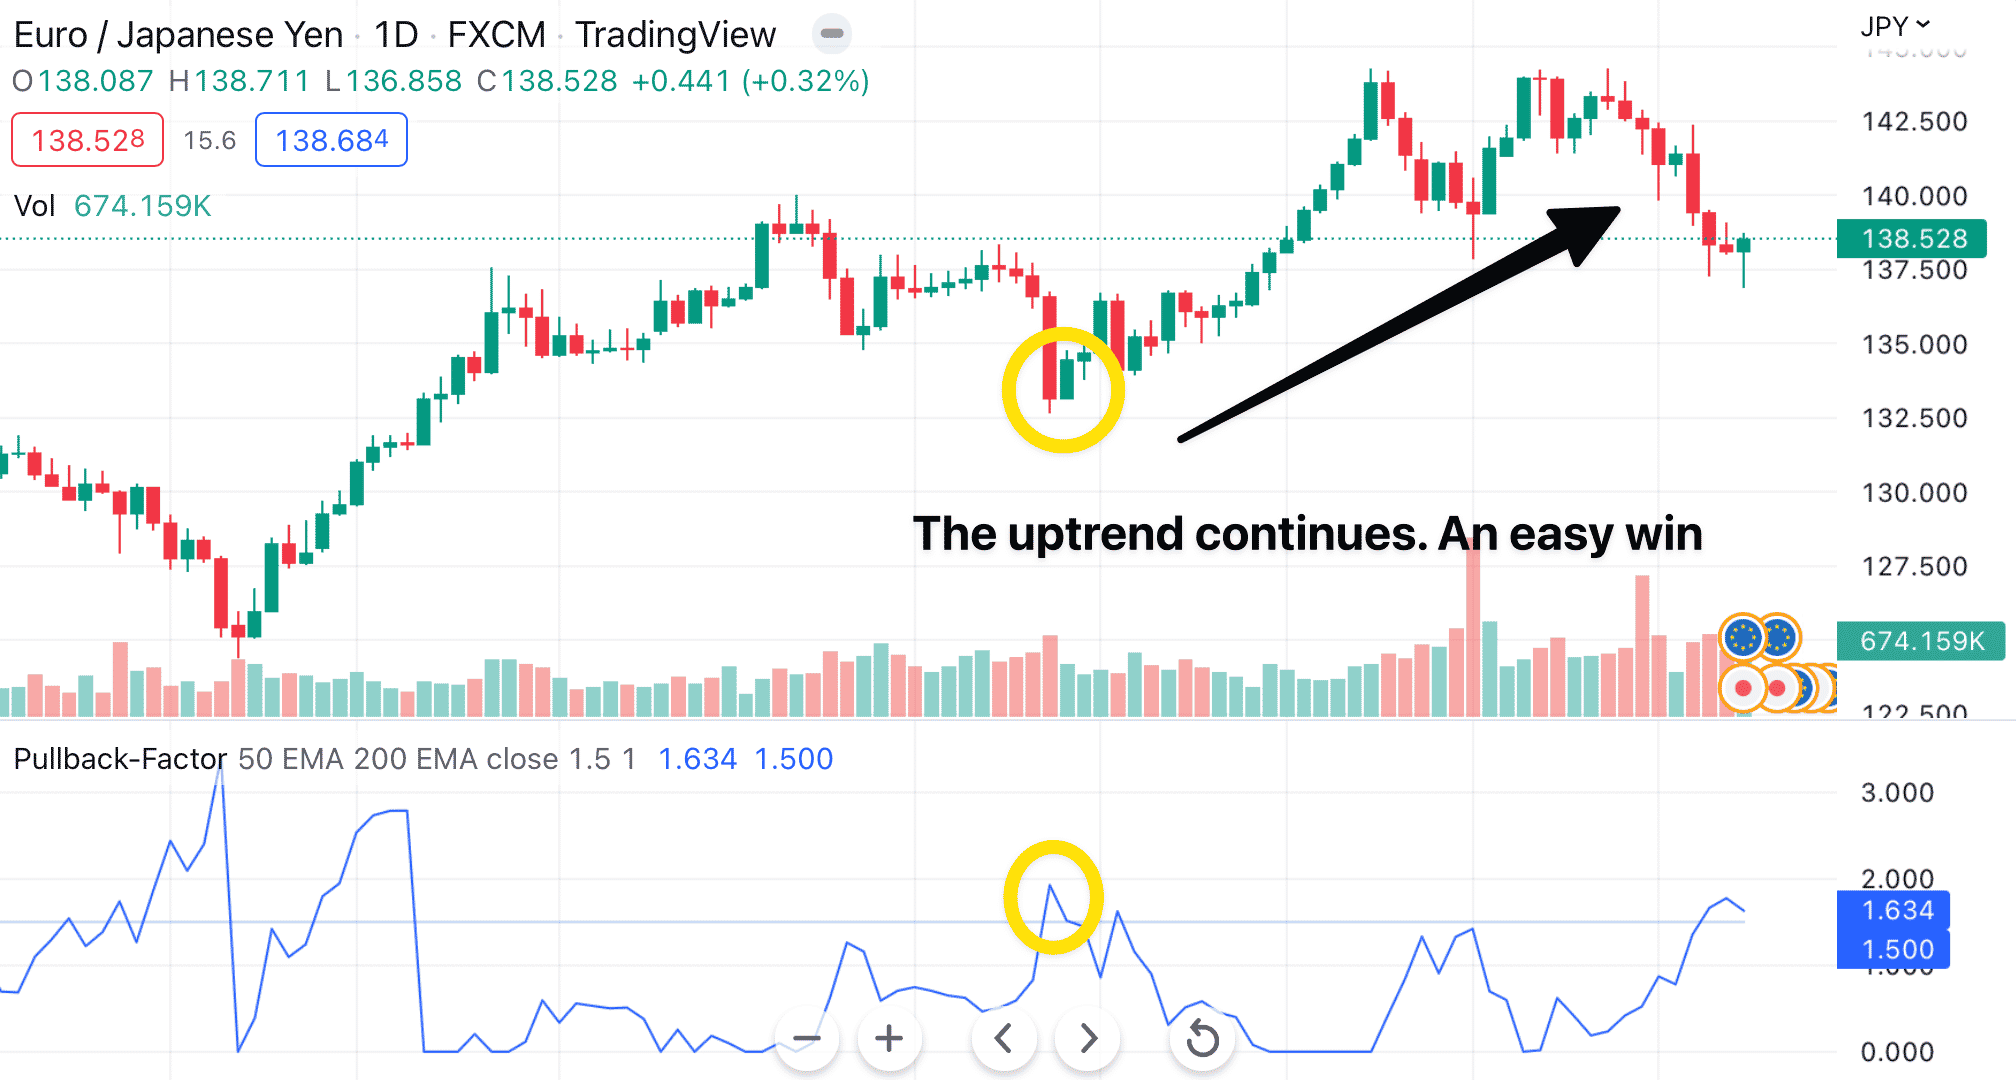
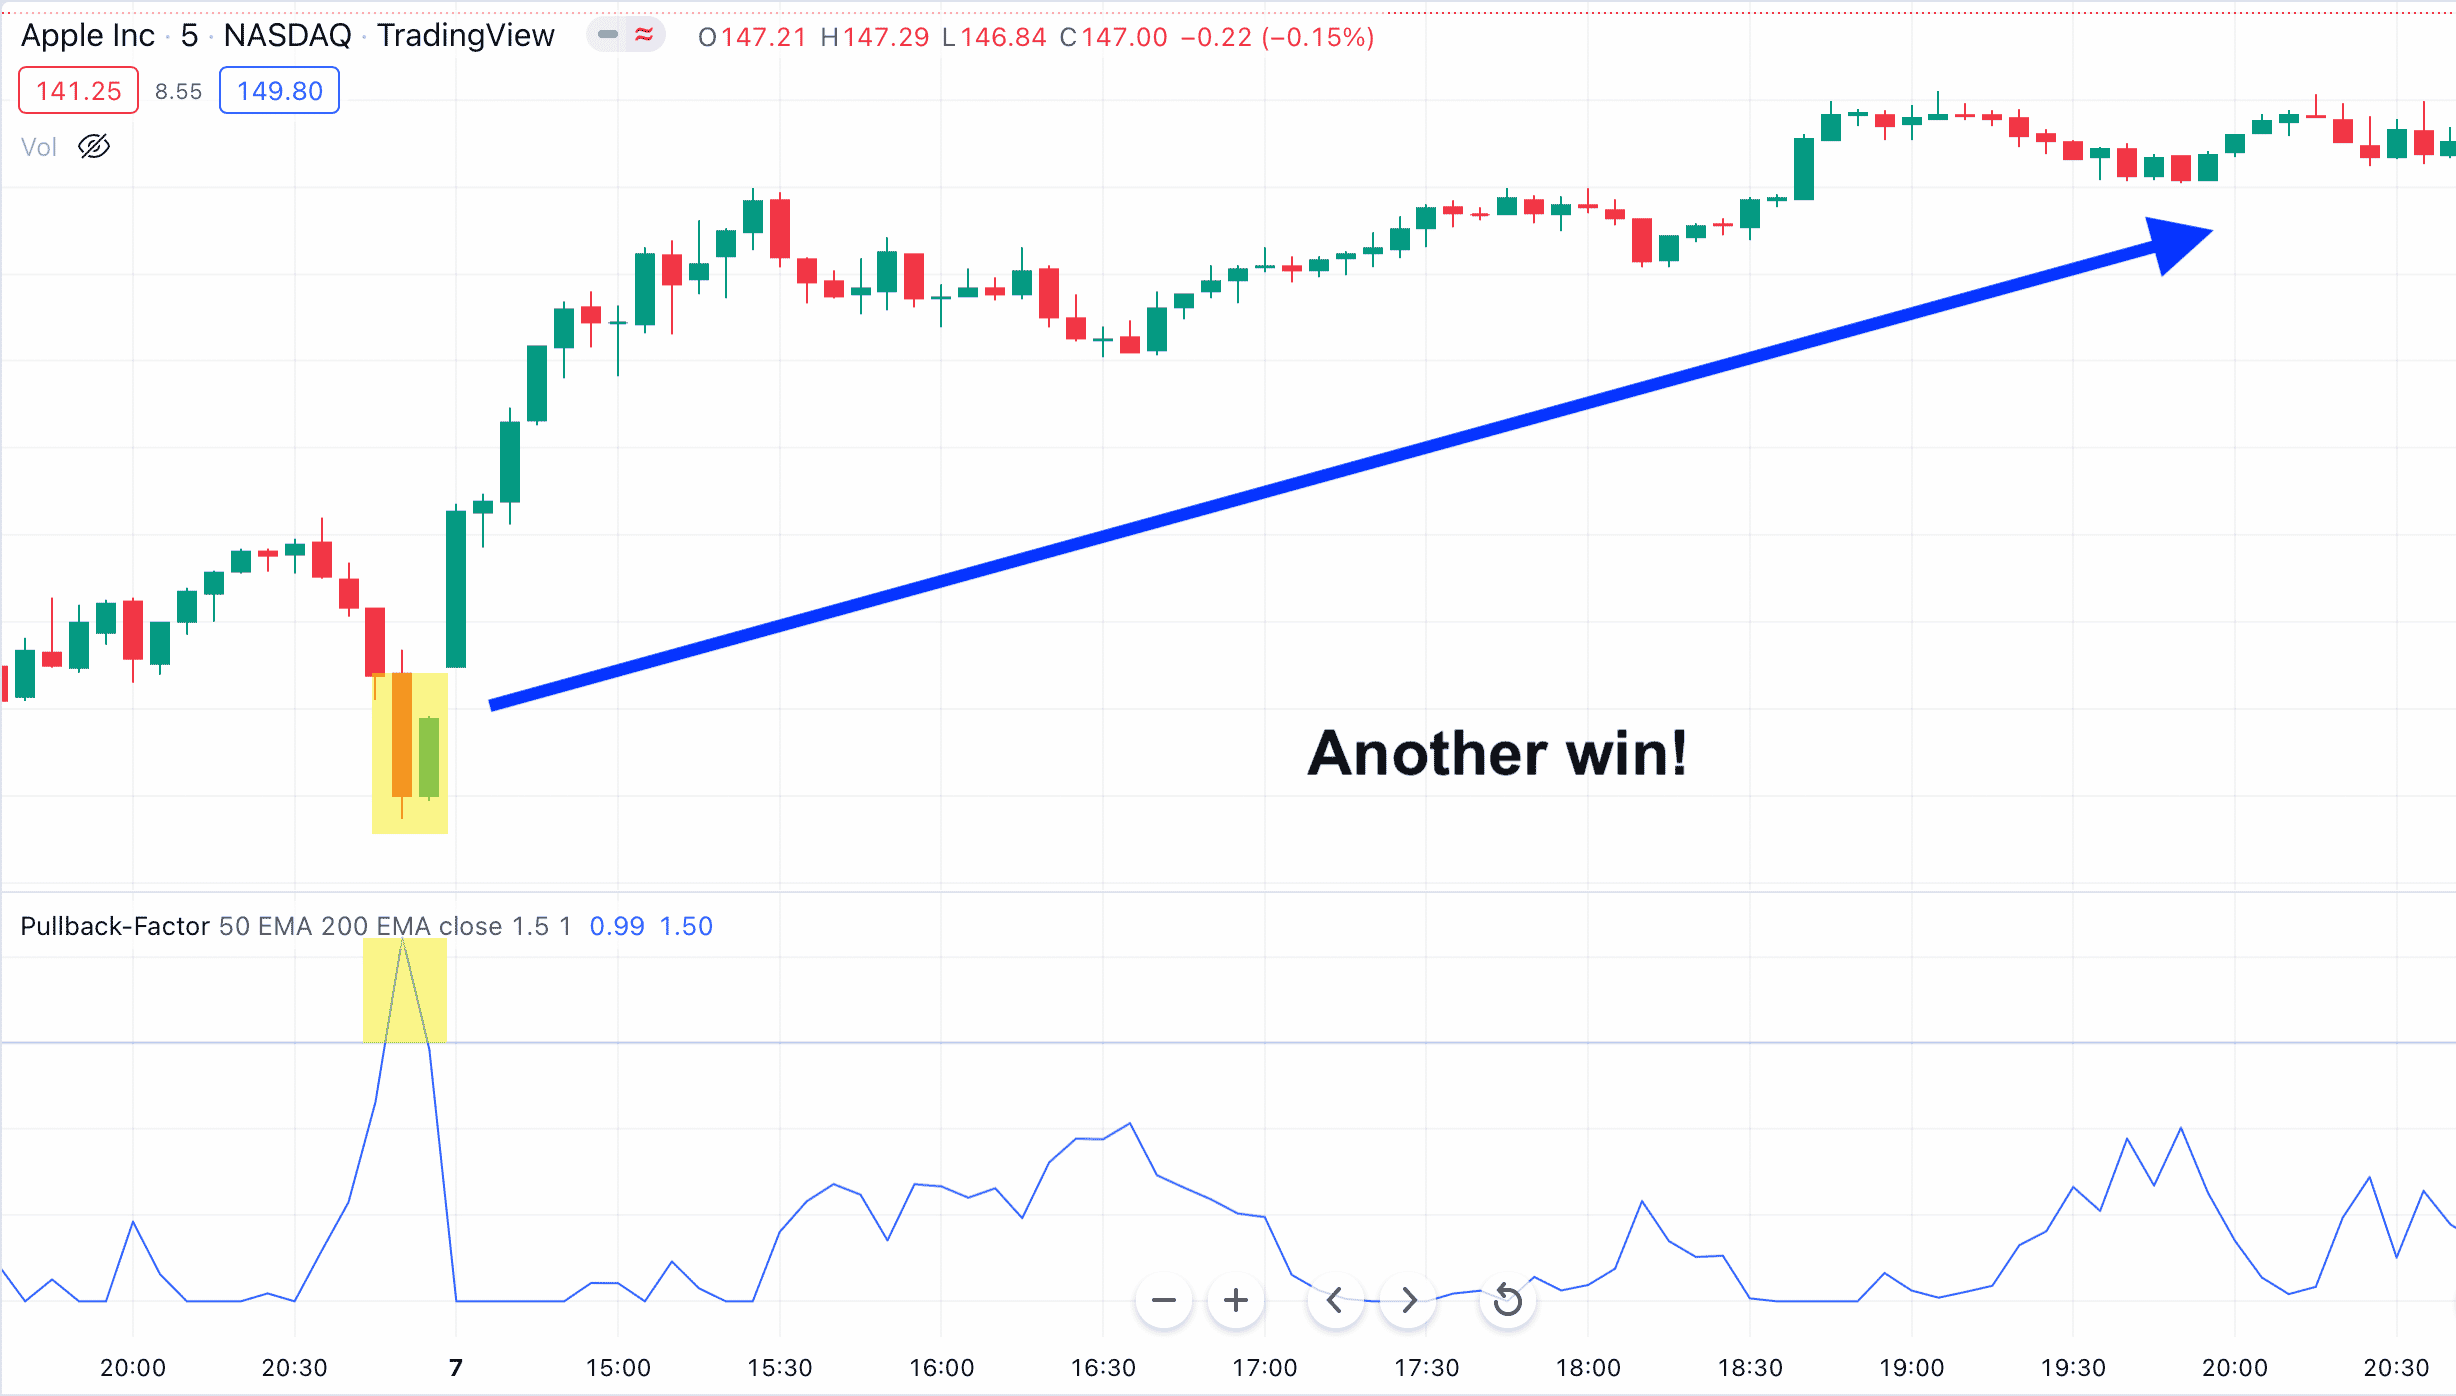
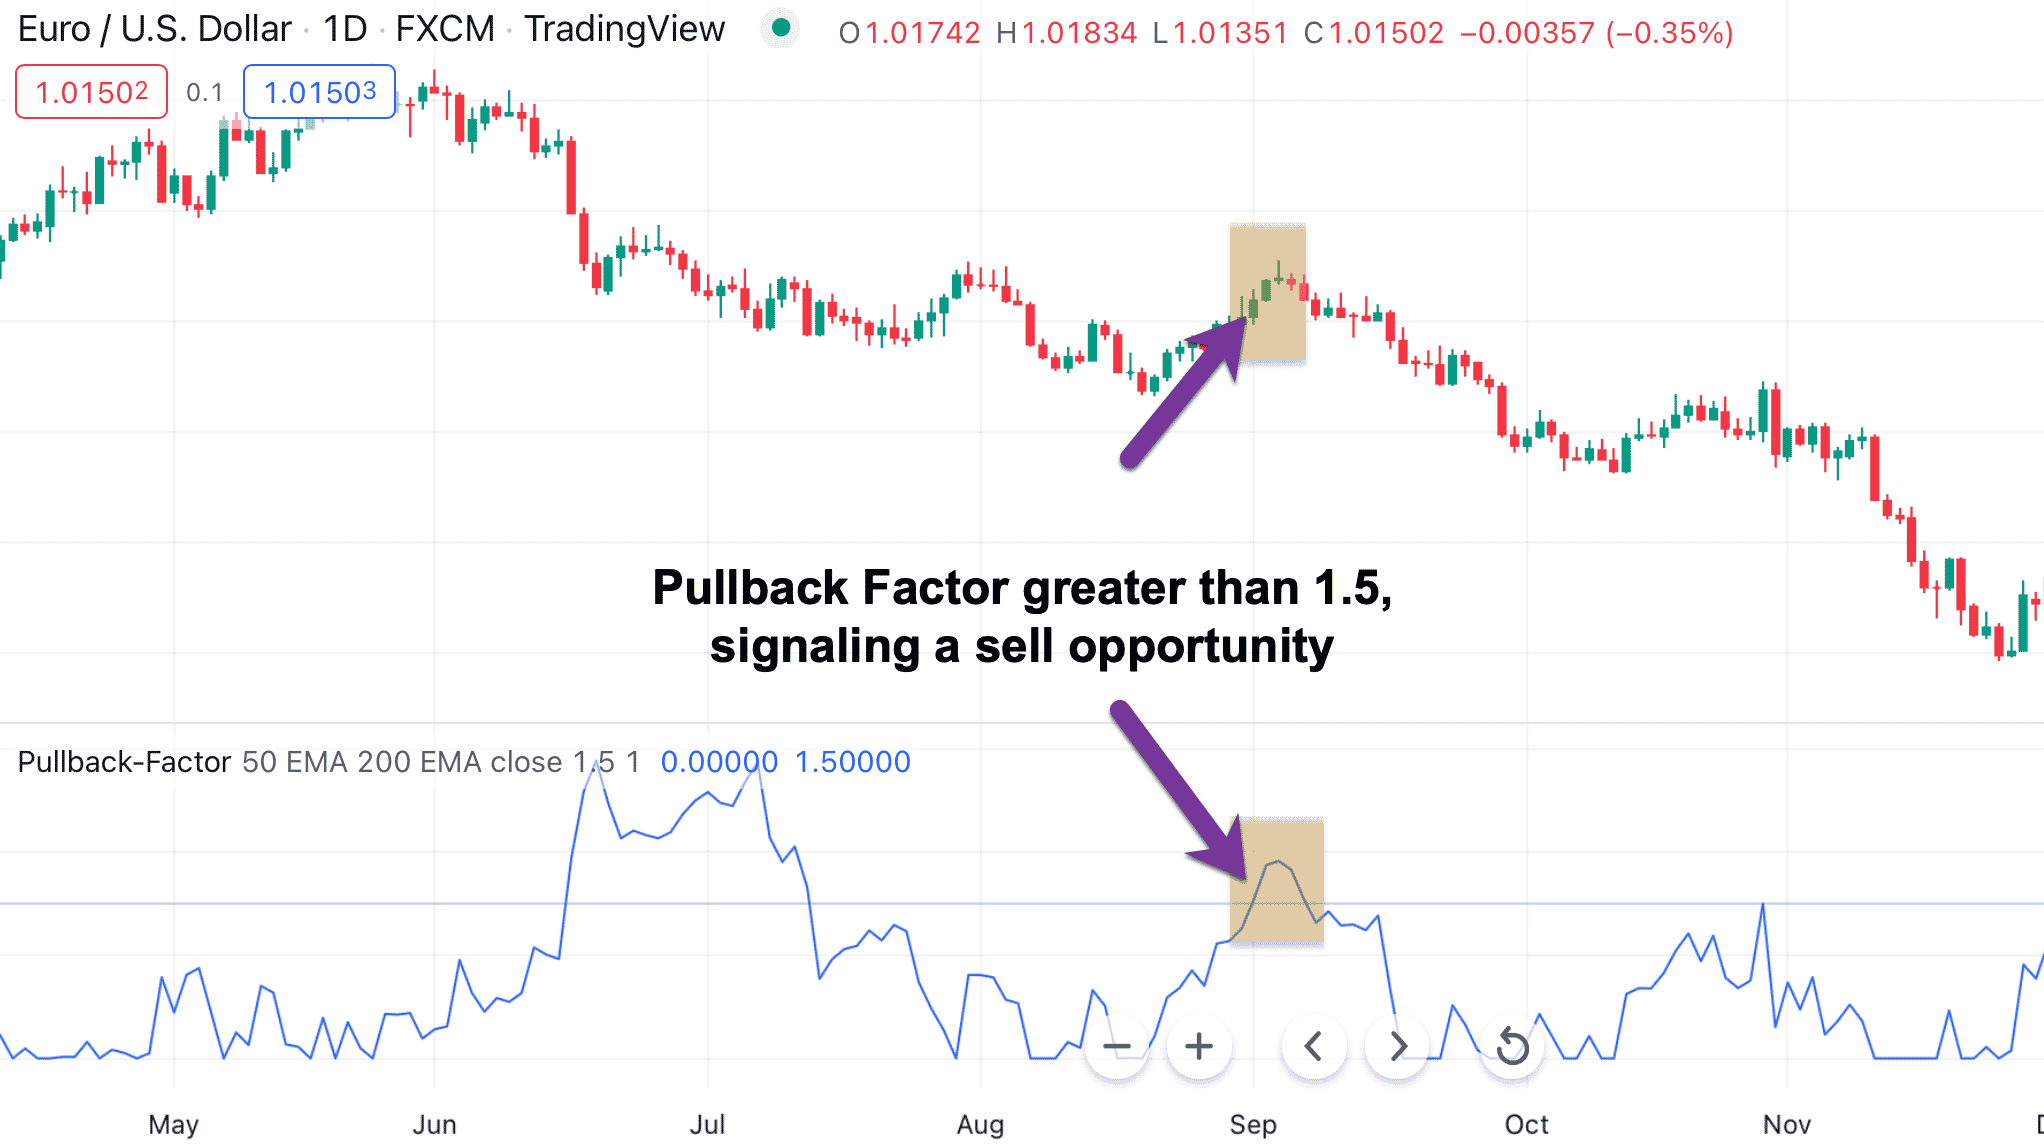
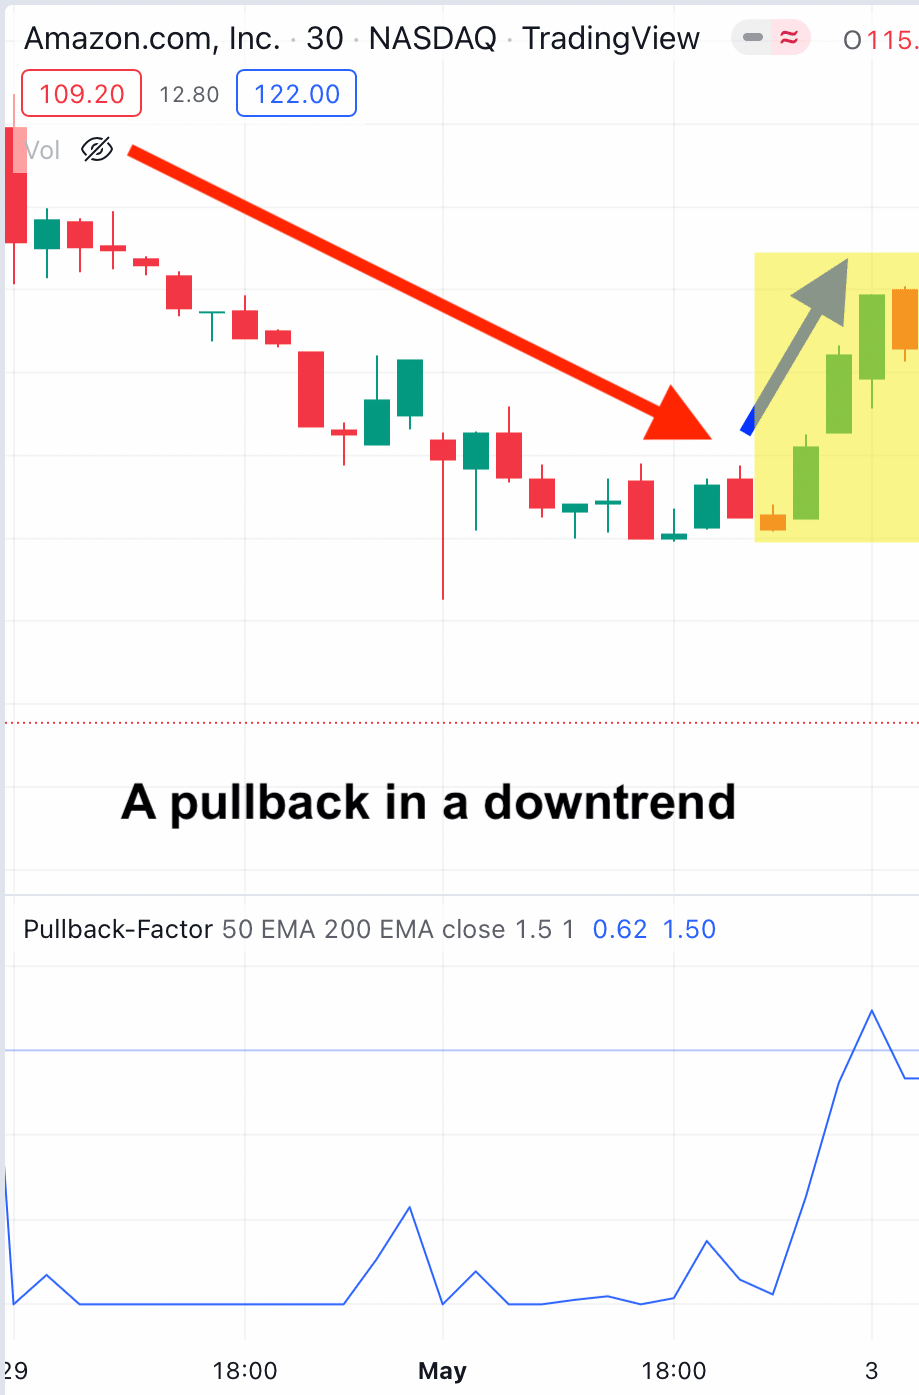
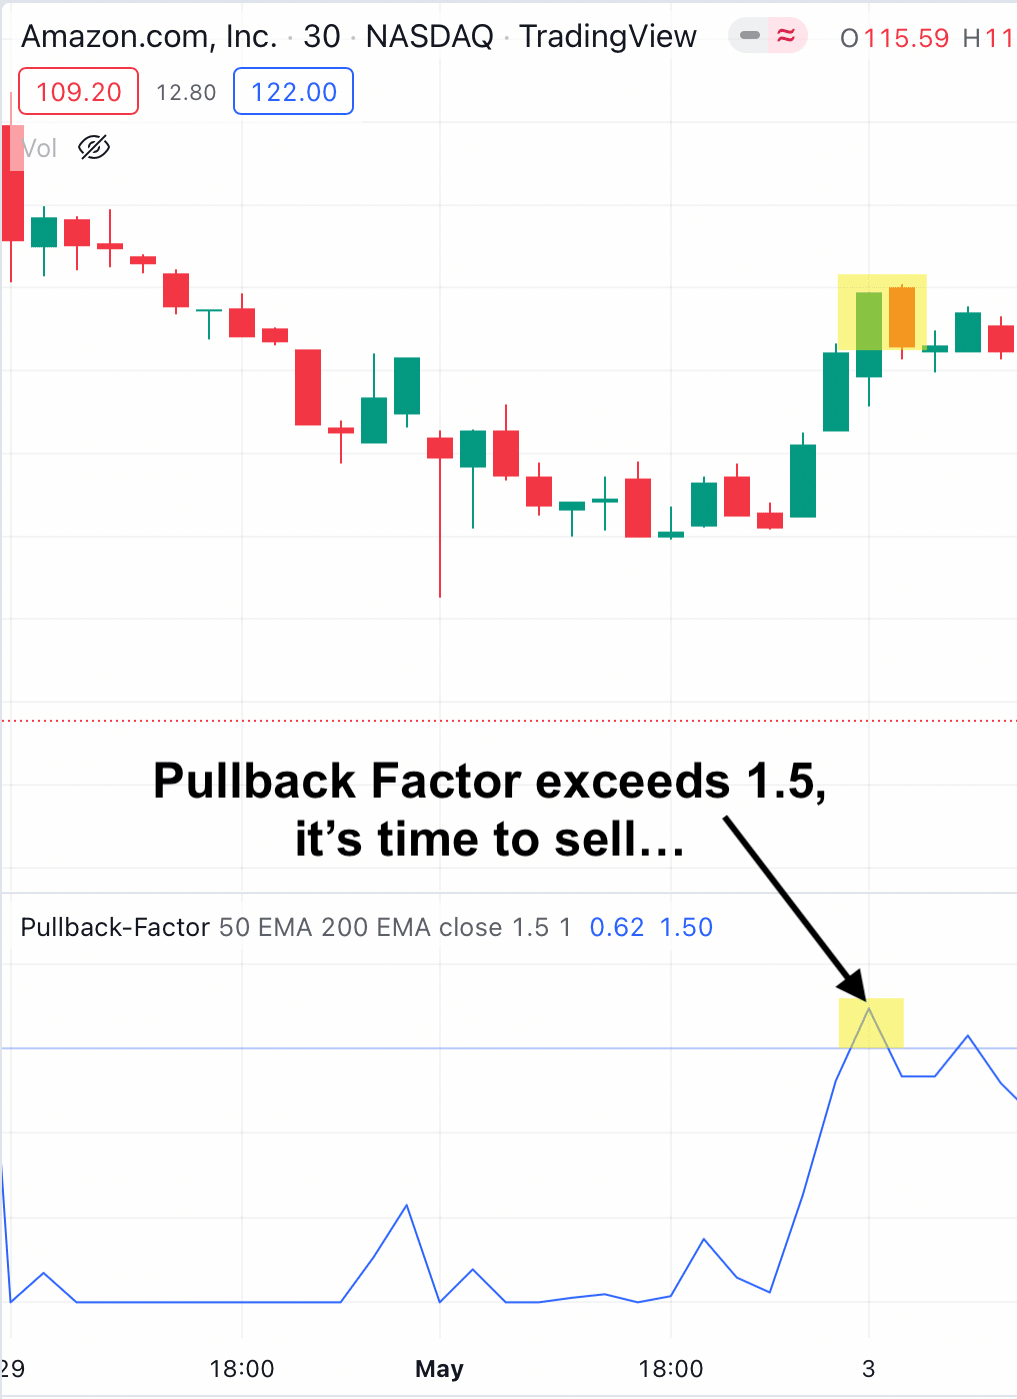
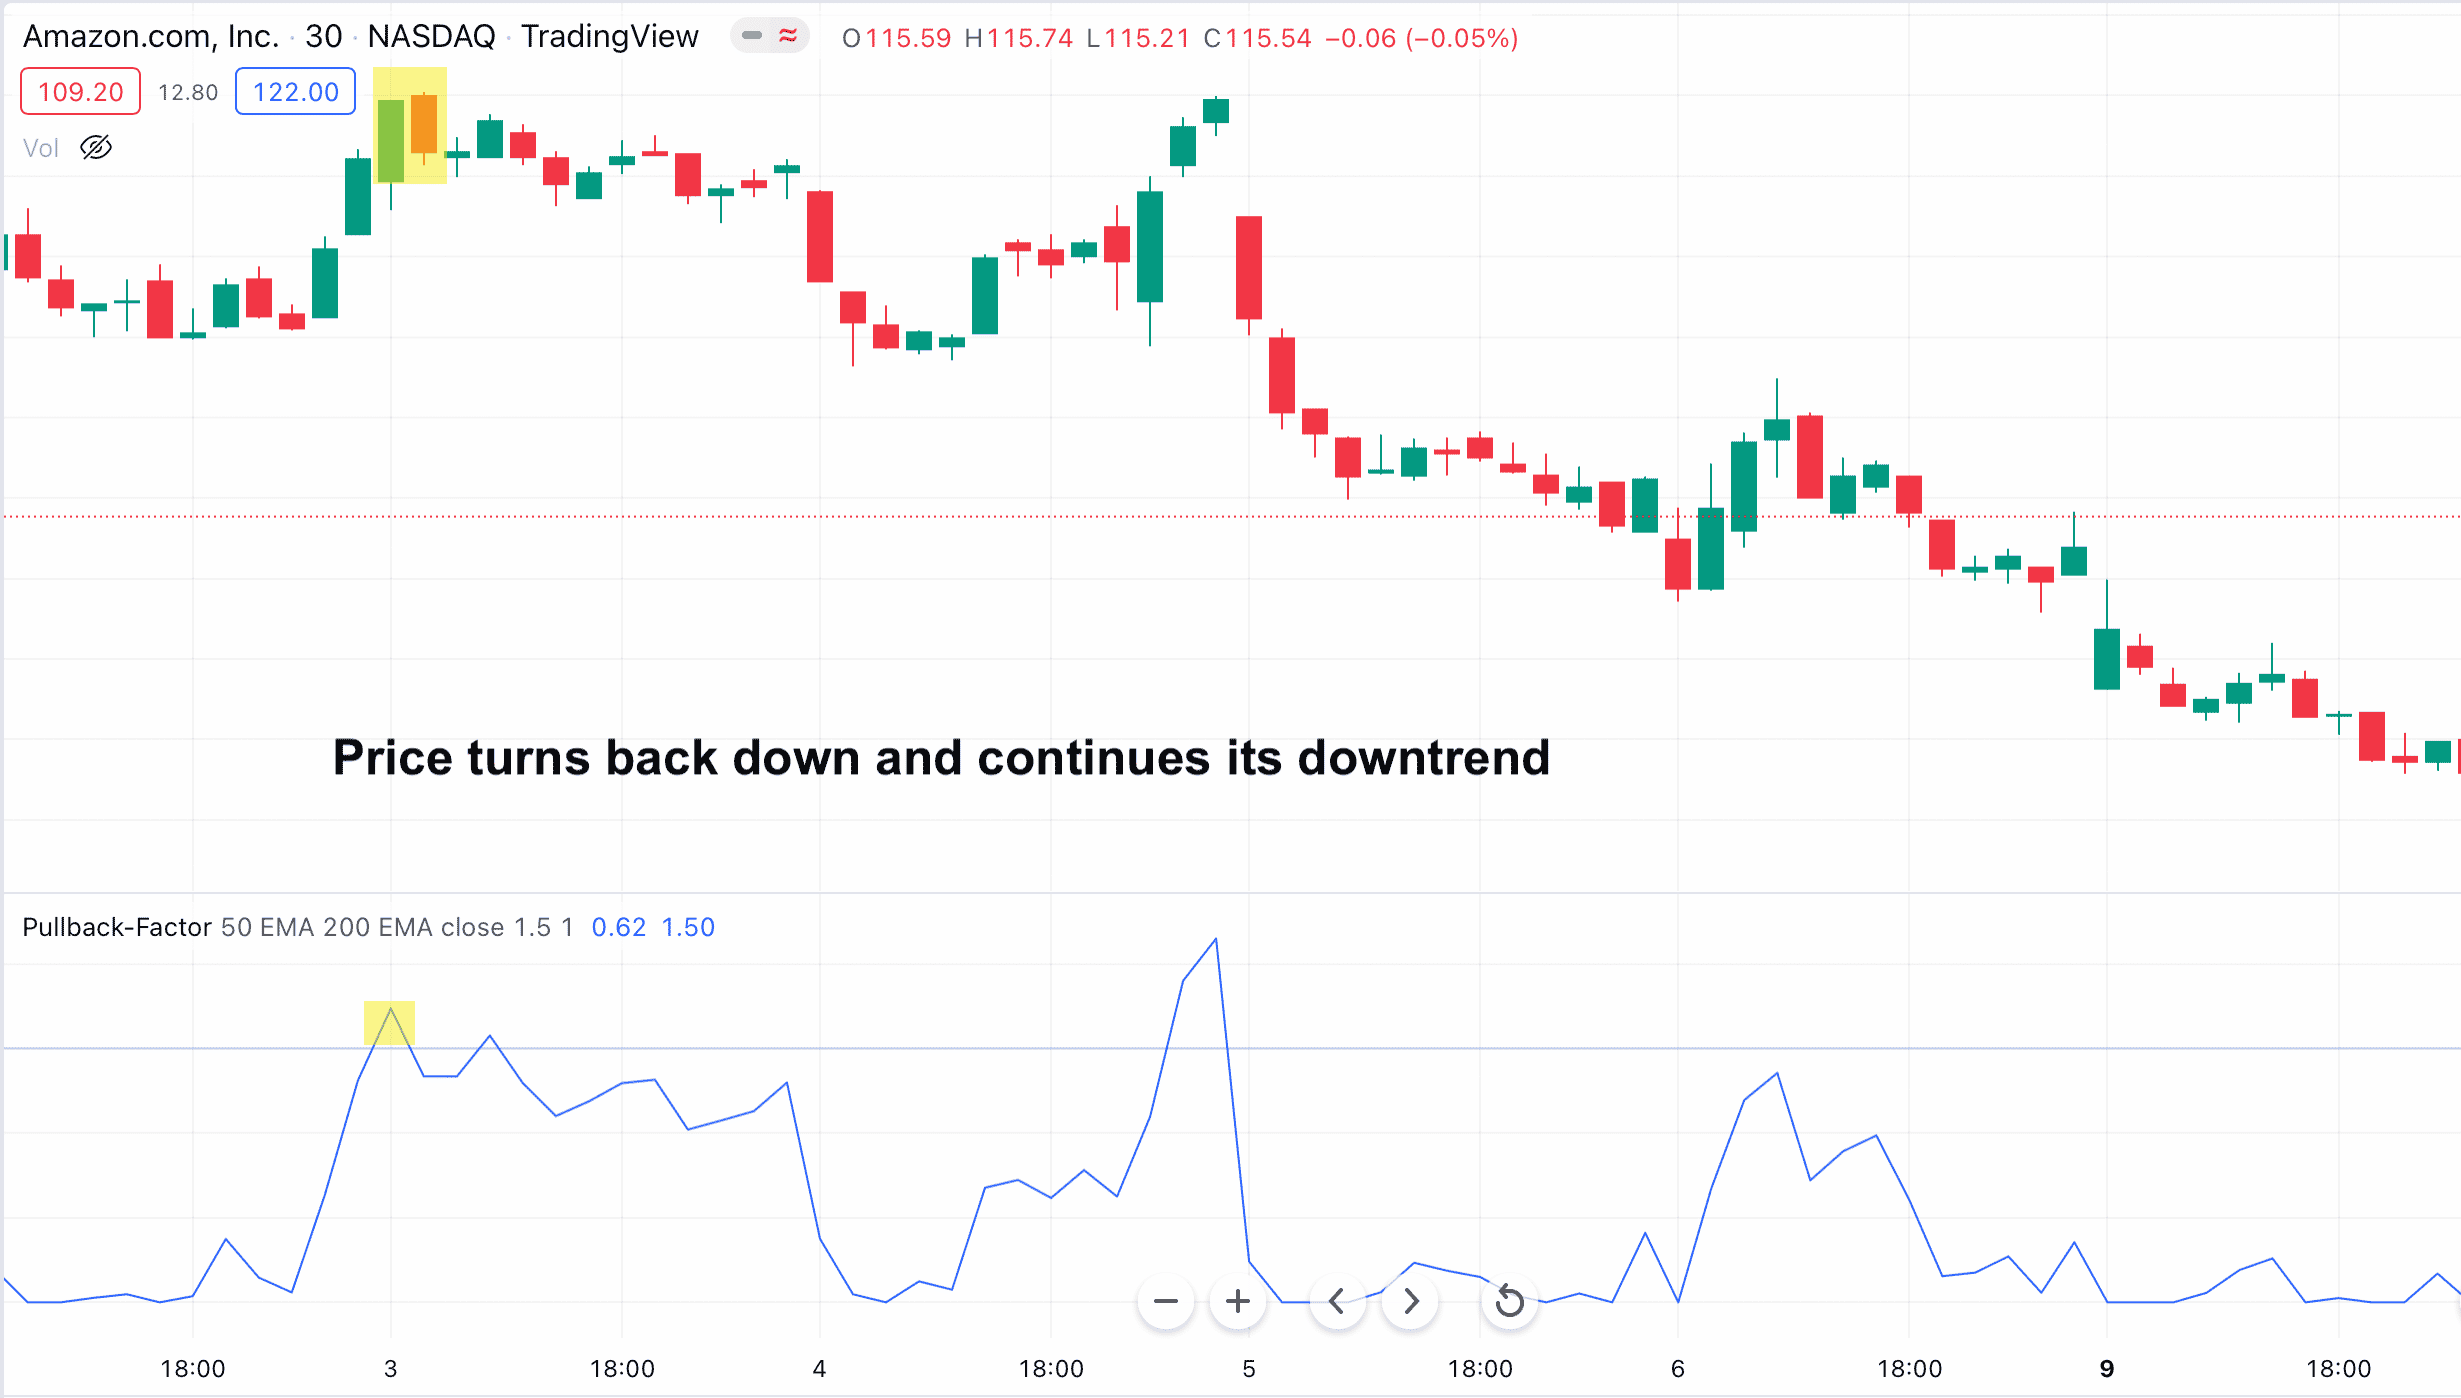
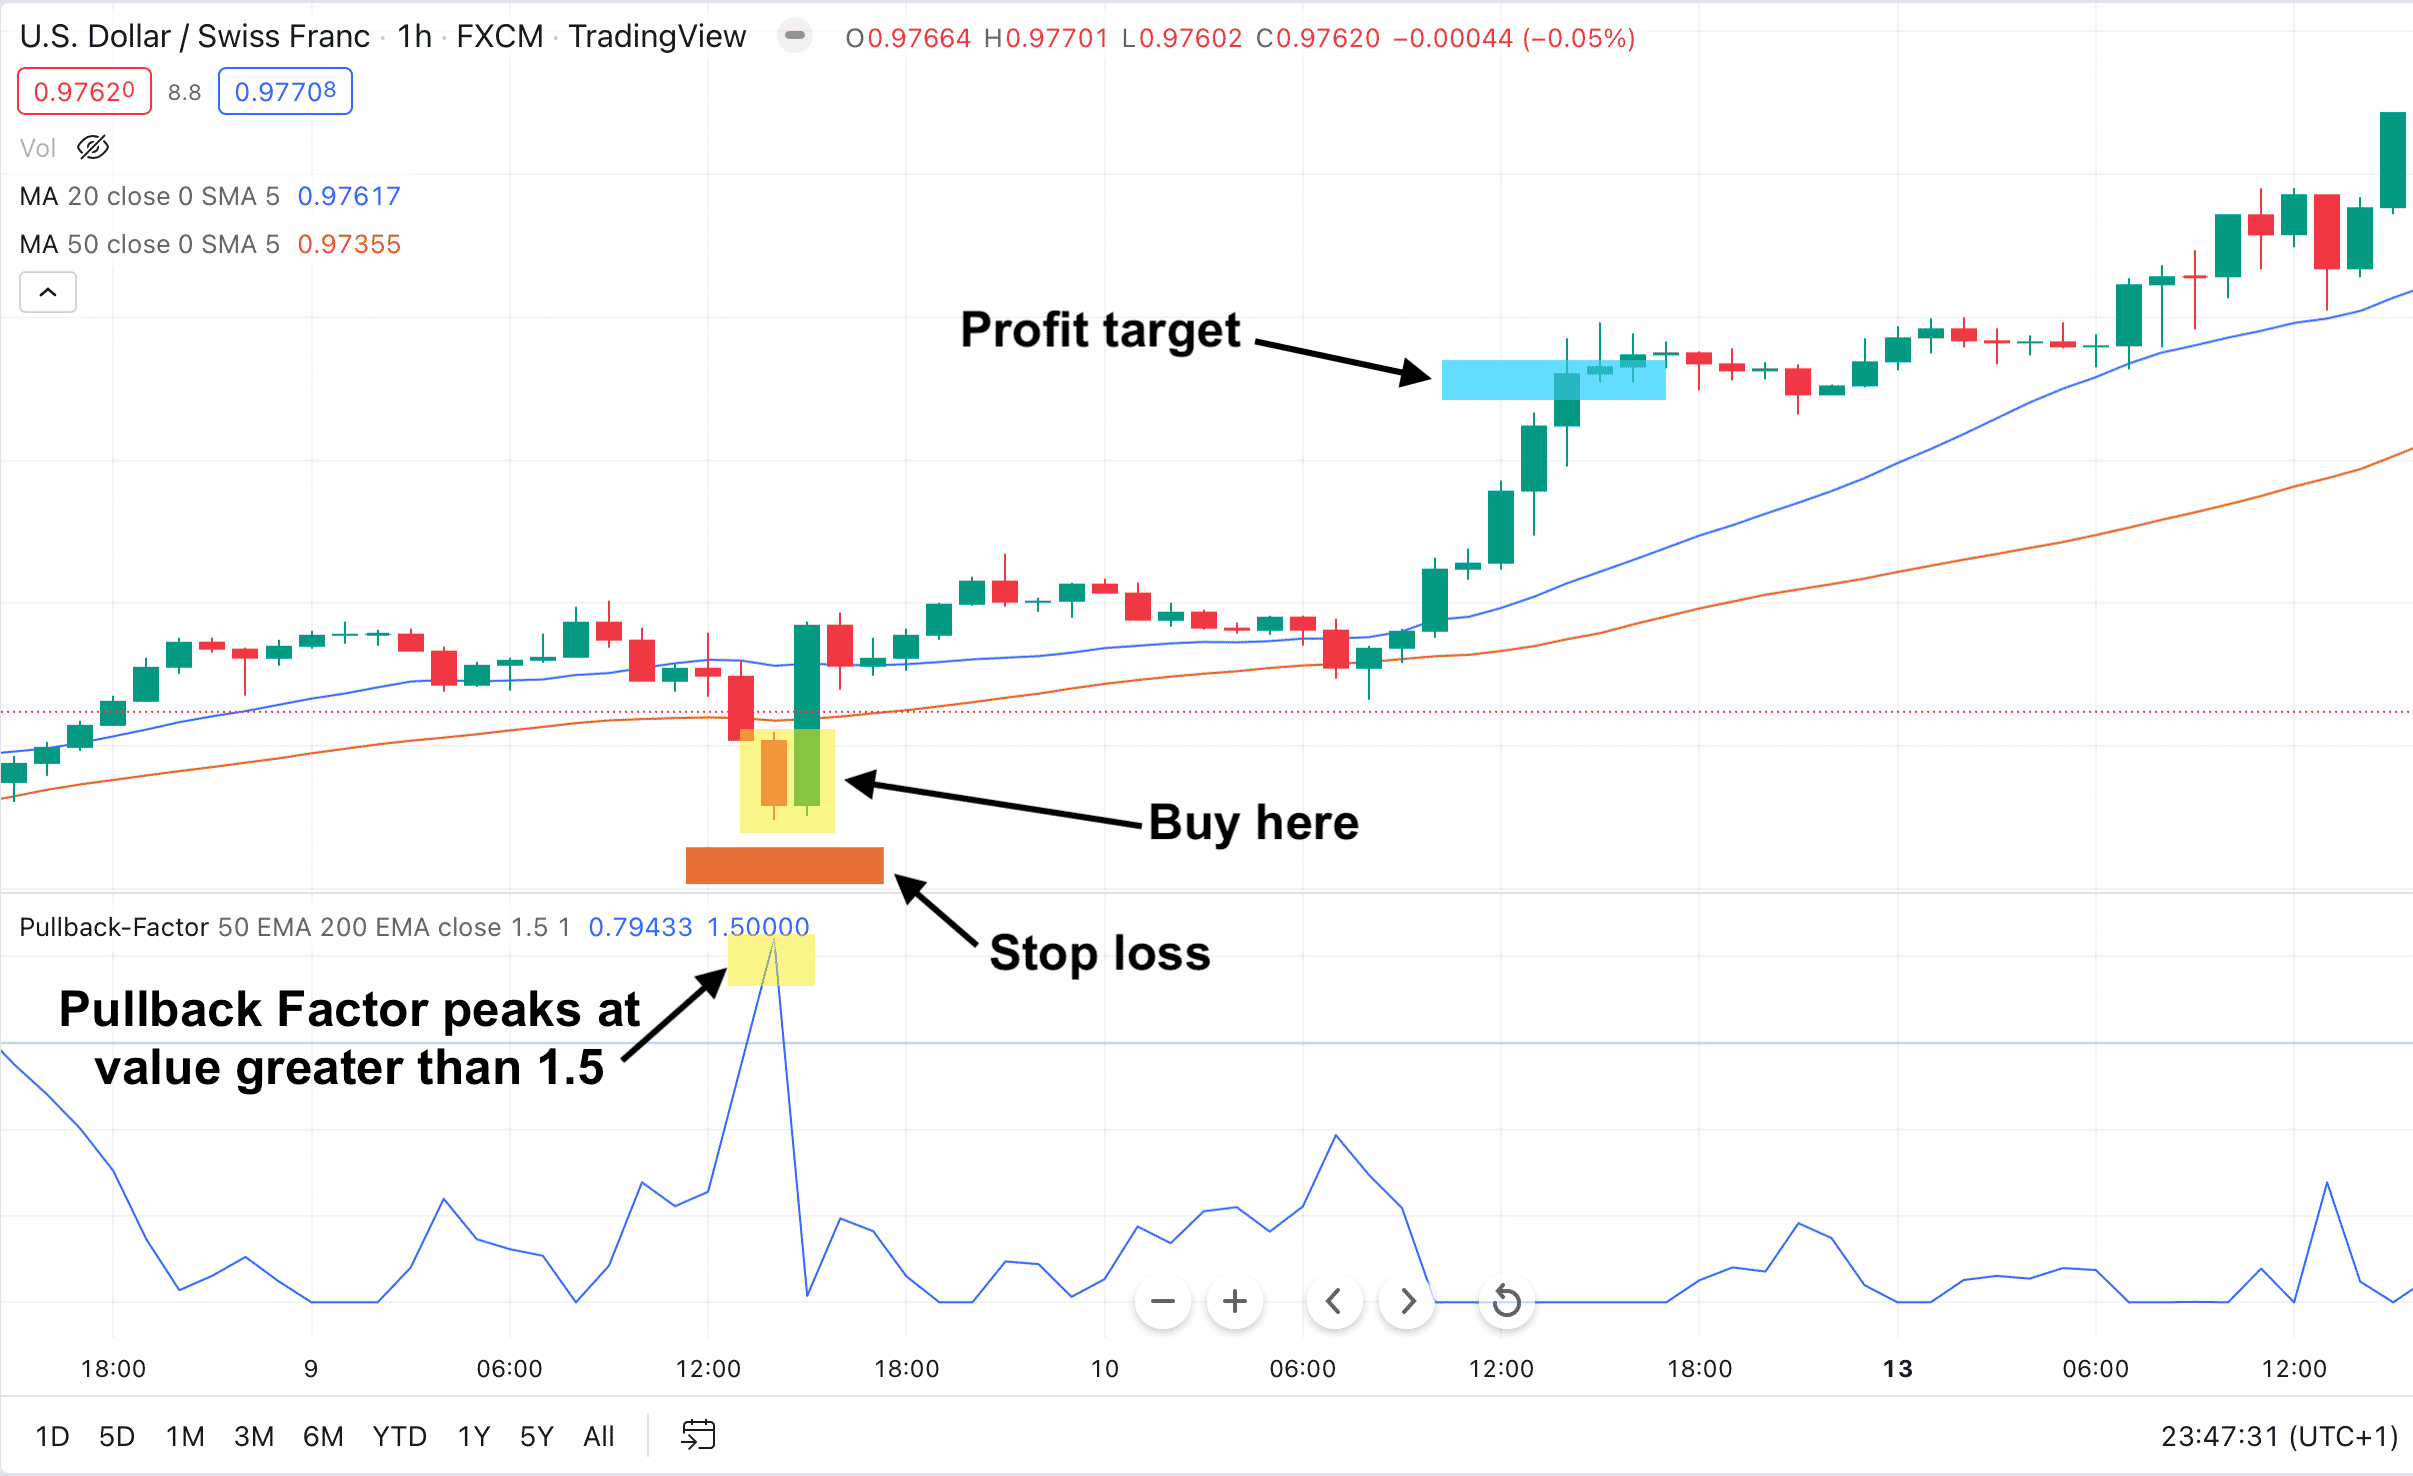
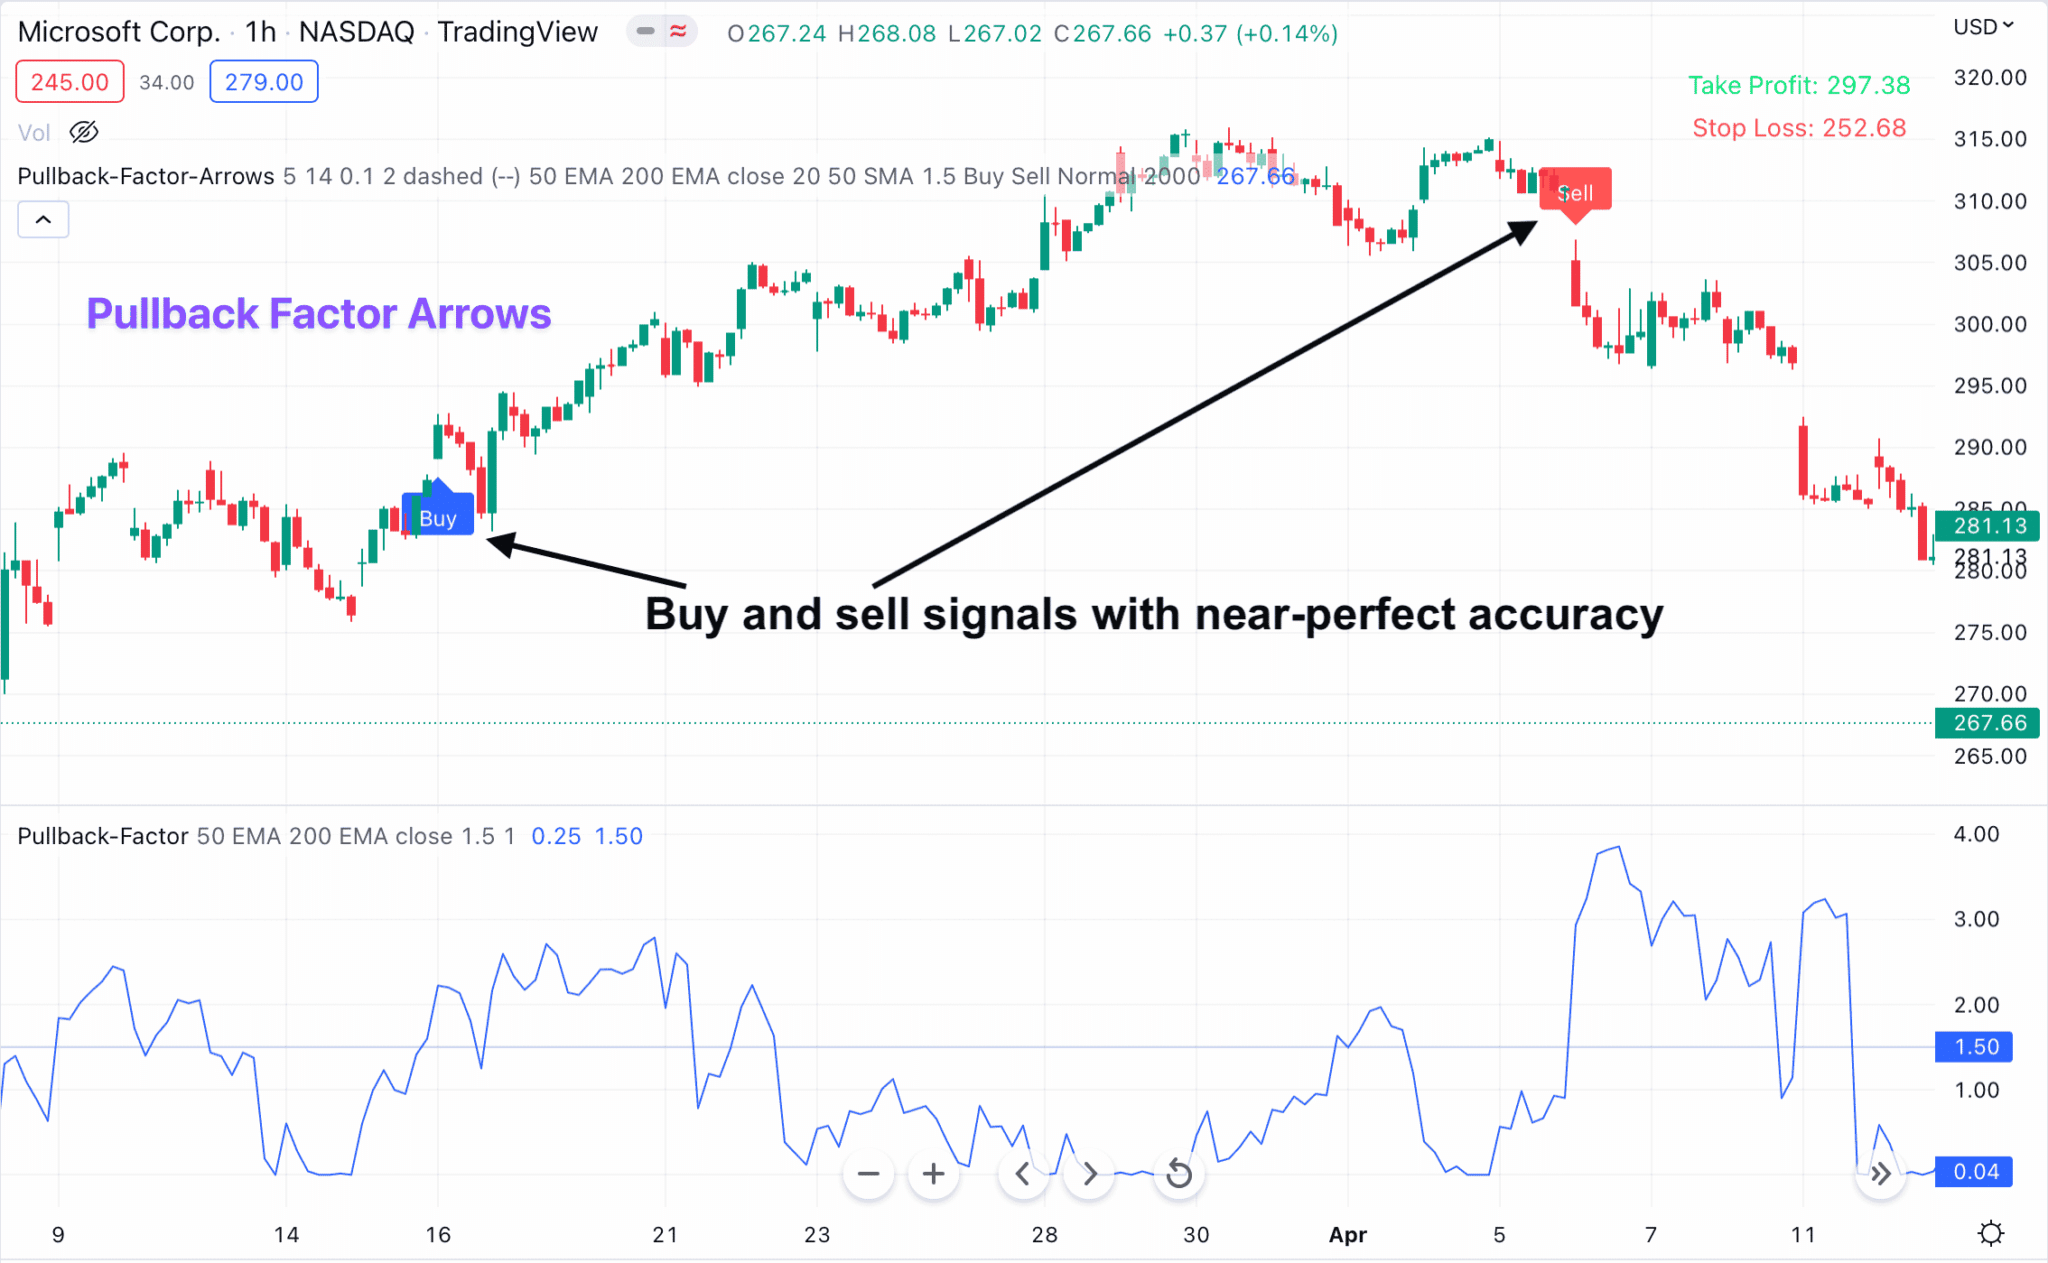
$299.00

๐Ÿ”ธ Once implemented, you can check the Pullback Factor indicator VALUE and presumably predict when the pullback will cease.
๐Ÿ”ธ Simply keep an eye on the value and start trading once it peaks at a specific level.
๐Ÿ”ธ Finally, it is applicable to any market and any timeframes.

Okay, so I should trade with the trend. But how? When exactly should I jump on the trend? And why am I always getting killed by those nasty pullbacks that trigger my stop before turning back into the trending direction?

New โ€œPullback Factor for Tradingviewโ€ Indicator Lets You Enter The Trend With Near-Perfect Timing By Identifying With Great Certainty When A Pullback Is Going To Endโ€ฆ

And it works in ANY market (whether itโ€™s FX, stocks, or indices) and ANY timeframes (from 1-minute to monthly)

Hey there,

Does this sound familiar? Your trading system gives you a buy signal, telling you that an uptrend has just begun. So you enter a trade.

But then, as soon as you enter the trade, the market immediately reverses. You get stopped out.

To add salt to the wound, just as soon as your stop loss is triggered, you get a second buy signal. The first loss is so painfulโ€ฆ you donโ€™t want to take the second trade just yet.

But then, this happens:

A huge monstrous uptrend happens in the direction I originally predicted just after I got stopped out.

Orโ€ฆ maybe youโ€™re more careful. And wait for the market to pullback. You know, the market goes up, pulls back, and goes up again, right?

I mean, something like this:

So, price goes up. Then it pulls back. Then the pullback seems to stop. This is where Iโ€™m supposed to buy, right?

Watch what happens

Argh, Iโ€™m going crazyโ€ฆ

How am I supposed to know when the pullback is done?

So I can avoid entering early and getting stopped outโ€ฆ

Or even better, how can I take advantage of the pullback to enter the trend with greater timingโ€ฆ and at the best price possible?

If thatโ€™s what you want, hereโ€™s the good news:

Our Pullback Factor Indicator for TradingView Solves This Problem For Youโ€ฆ

Hereโ€™s why:

Pullback Factor indicator uses our volatility-based algorithm to identify whether or not the current pullback is about to end. When the pullback ends, that meansโ€ฆ price is ready to CONTINUE its original trend.

In fact, statistical testing shows that: When the Pullback Factor indicator gives a signal that a certain pullback is complete, thereโ€™s a high probability the original trend will resume immediately afterward.

So you can be certain and confident placing a trade in the direction of the trend.

Let me show you how it works. Hereโ€™s a common scenario:

So the price goes up in an uptrend, then it pulls back. Now youโ€™re wondering how long this pullback will lastโ€ฆ

But then, you look at the Pullback Factor indicator value. And everything suddenly became clear.

No more uncertainty:

At this bar, the Pullback Factor value is 1.59 which is larger than 1.5. And a Pullback Factor value larger than 1.5 means that thereโ€™s a great probabiltiy that this pulback is coming to an end. And the price will continue its original trend (uptrend in this case) shortly.

 So now you know with great certainty that this uptrend will likely continue.

And so, you enter a long tradeโ€ฆ

Letโ€™s see what happens next:

This time, because you use Pullback Factor, your timing is perfect. And the price immediately shoots up in your direction. An easy win.

And itโ€™s not stopping thereโ€ฆ

Letโ€™s take a look at how well Pullback Factor works in another market โ€” Apple stock this time. Here you see another buy set-up when the Pullback Factor value exceeds 1.5. And you put on another long trade.

Andโ€ฆ

Just as Pullback Factor predicted, price moves up aggressively in your favor again. So, the Pullback Factor indicator helps you place 2 long trades that result in 2 huge winsโ€ฆ

Moving on, letโ€™s see how well Pullback Factor works in a downtrend.

Hereโ€™s a EUR/USD chart:

Nowโ€ฆ switching to AMAZON stock. Look at this chart:

img8-1.png

So the market goes down in a downtrend. Then it pulls back.

You know the drill. Now is the time to determine when this pullback will end, and when price will resume its trend direction:

img9.png

You see that the Pullback Factor value is greater than 1.5 (at the bars highlighted in yellow). And so you sell.

Watch how the price behaves after that:

Youโ€™re right again. As soon as you place your short trade, the market turns back down. And the downtrend continues.

And as a result, youโ€™ve got a huge win.

But youโ€™re not seeing everything yet. Now itโ€™s time to take it up a notchโ€ฆ 

Hereโ€™s my own trading system that incorporates the Pullback Factor indicator. And you have my permission to STEAL itโ€ฆ

Let me give you my own trading rules which are built upon the Pullback Factor indicator. You can steal these rules, and put them to work for youโ€ฆ immediately:

FIRST. You need to trade with the trend. To identify the trend, use 20-day moving average and 50-day moving average.

When the 20-day moving average is above 50-day moving average, the trend is up. And so weโ€™re only looking for long trades.

When the 20-day moving average is below the 50-day moving average, the trend is down. And so weโ€™re only looking for short trades.

SECOND. If the trend is up, enter a long trade when the Pullback Factor peaks at a level above 1.5. Conversely, if the trend is down, enter a short trade when the Pullback Factor peaks at a level above 1.5.

THIRD. Set your stop loss at the nearest support or resistance level. And your profit target would be two times (or three times) your stop.

Simple, right?

Well, let me show you how easy it really is. Look at this example on USD/CHF: 

So here the 20-day moving average (red line) is above the 50-day moving average (blue line). And as such, weโ€™re looking for buy opportunities.

The set-up is confirmed when Pullback Factor indicator peaks at a value greater than 1.5. So we place a long trade.

As expected, the indicator gives us a good trade. Price starts to move up in our favor immediately. And hit our profit target a few bars later.

Nice and easy, just the way I want itโ€ฆ

Do you think you can profit from these easy wins? I bet you could. Plus, the indicator is extremely flexible: Works on ANY instrumentsโ€ฆ ANY time-frame.

You can maximize your PROFITS with indices, stocks, commodities, and futures

โ€ฆ virtually any instrument you could think of.

You can get more! Introducingโ€ฆ

TV CHAMP MEMBERSHIP

Join our exclusive TV Champ membership and grab ALL our custom indicators for Tradingview. To see the full list of all indicators included in the TV Champ membership, click hereโ€ฆ

Yearly
$2997

Platform: TradingView

  •  Billed yearly
  •  All custom indicators (Listed hereโ€ฆ)
  • All updates
  •  All NEW indicators that weโ€™ll release
Contact us to buy
Lifetime
$5997

Platform: TradingView

  •  One-time payment
  •  Lifetime access
  •  All custom indicators (Listed hereโ€ฆ)
  •  All updates
  •  All NEW indicators that weโ€™ll release
contact us to buy

Our Customer Feedback

Donโ€™t take our word for it, read our customersโ€™ testimonials from Trustpilot.com

4.2

Review Average!
TrustScore 4 out of 5
Based on 94 reviews

1