Frequently Bought Together
Pivotal Reversal Pro for Tradingview
$299.00
✔️ Stop losing out on BIG trades—quit leaving money on the table!
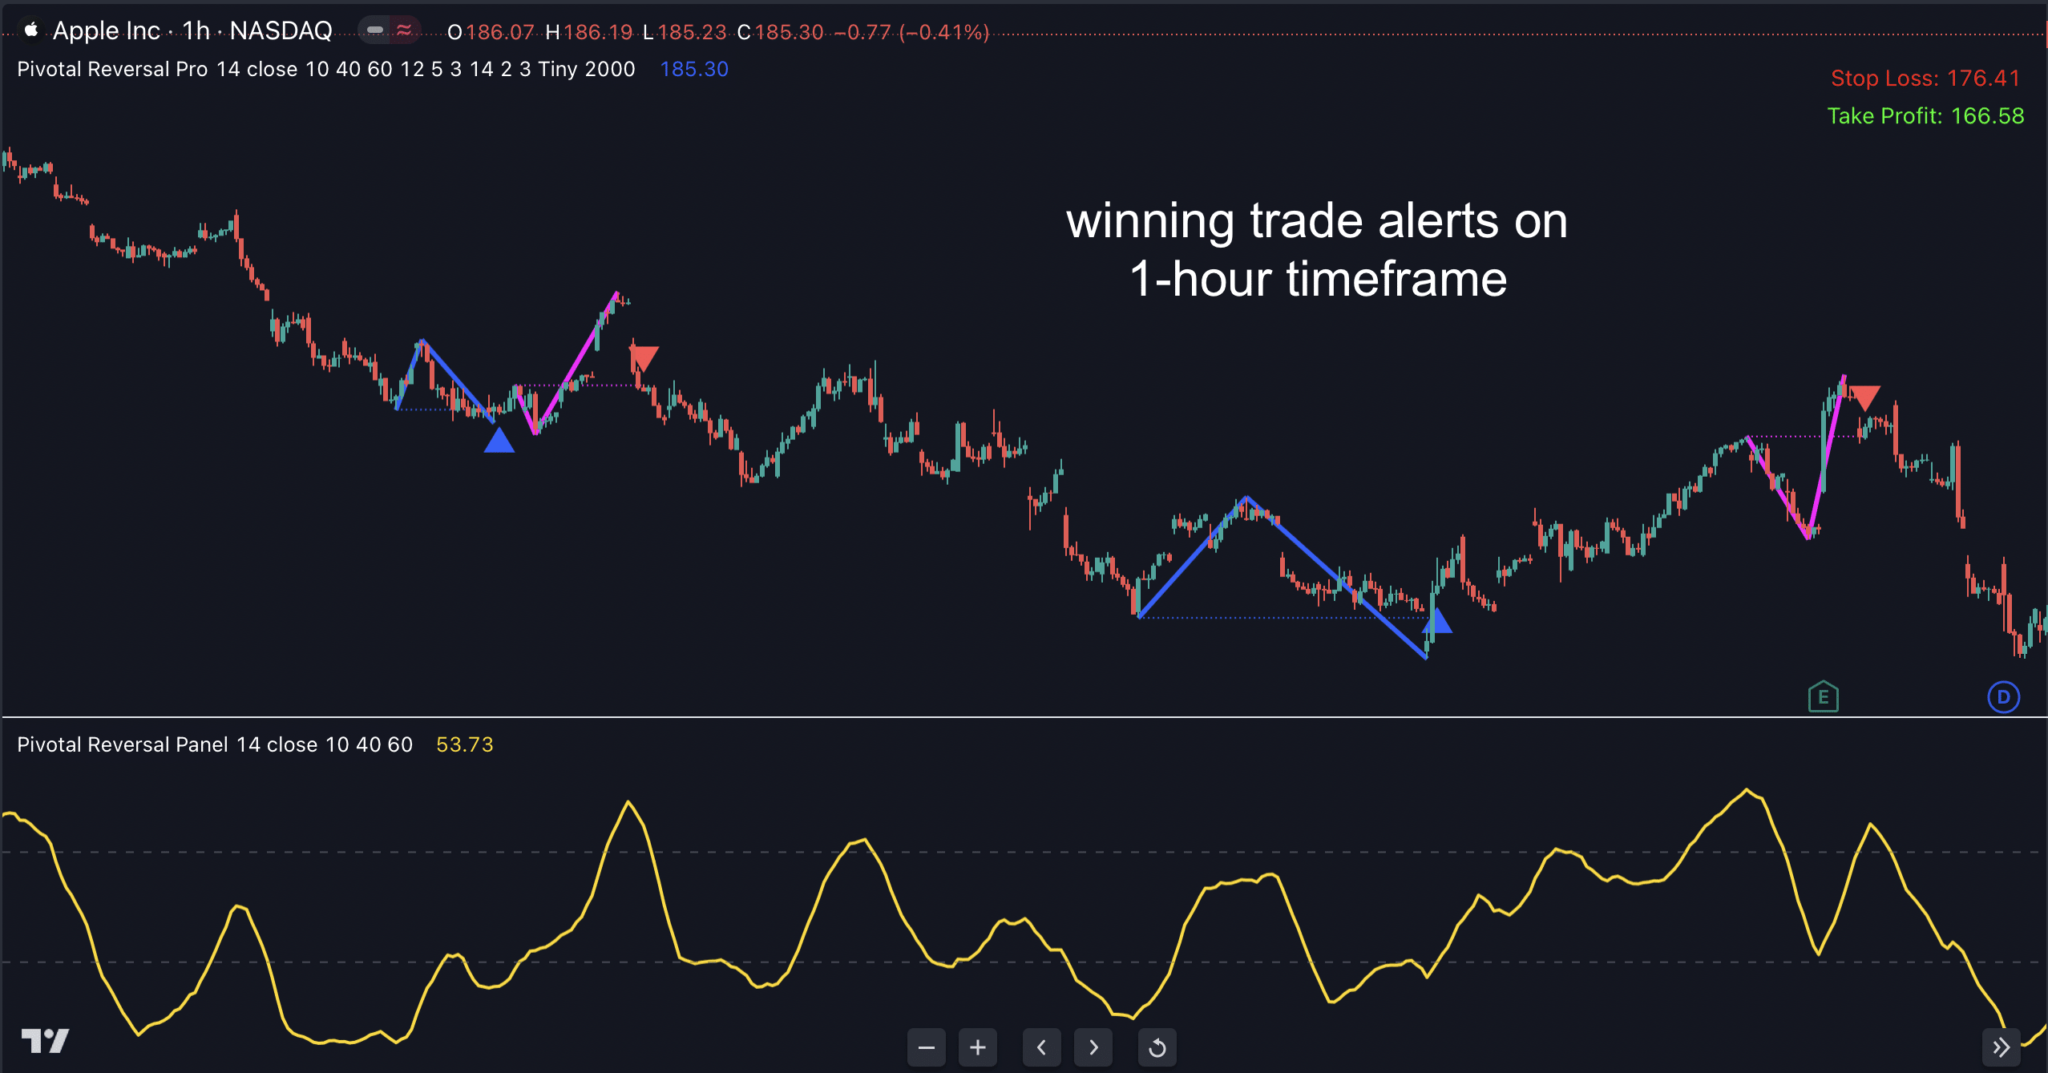
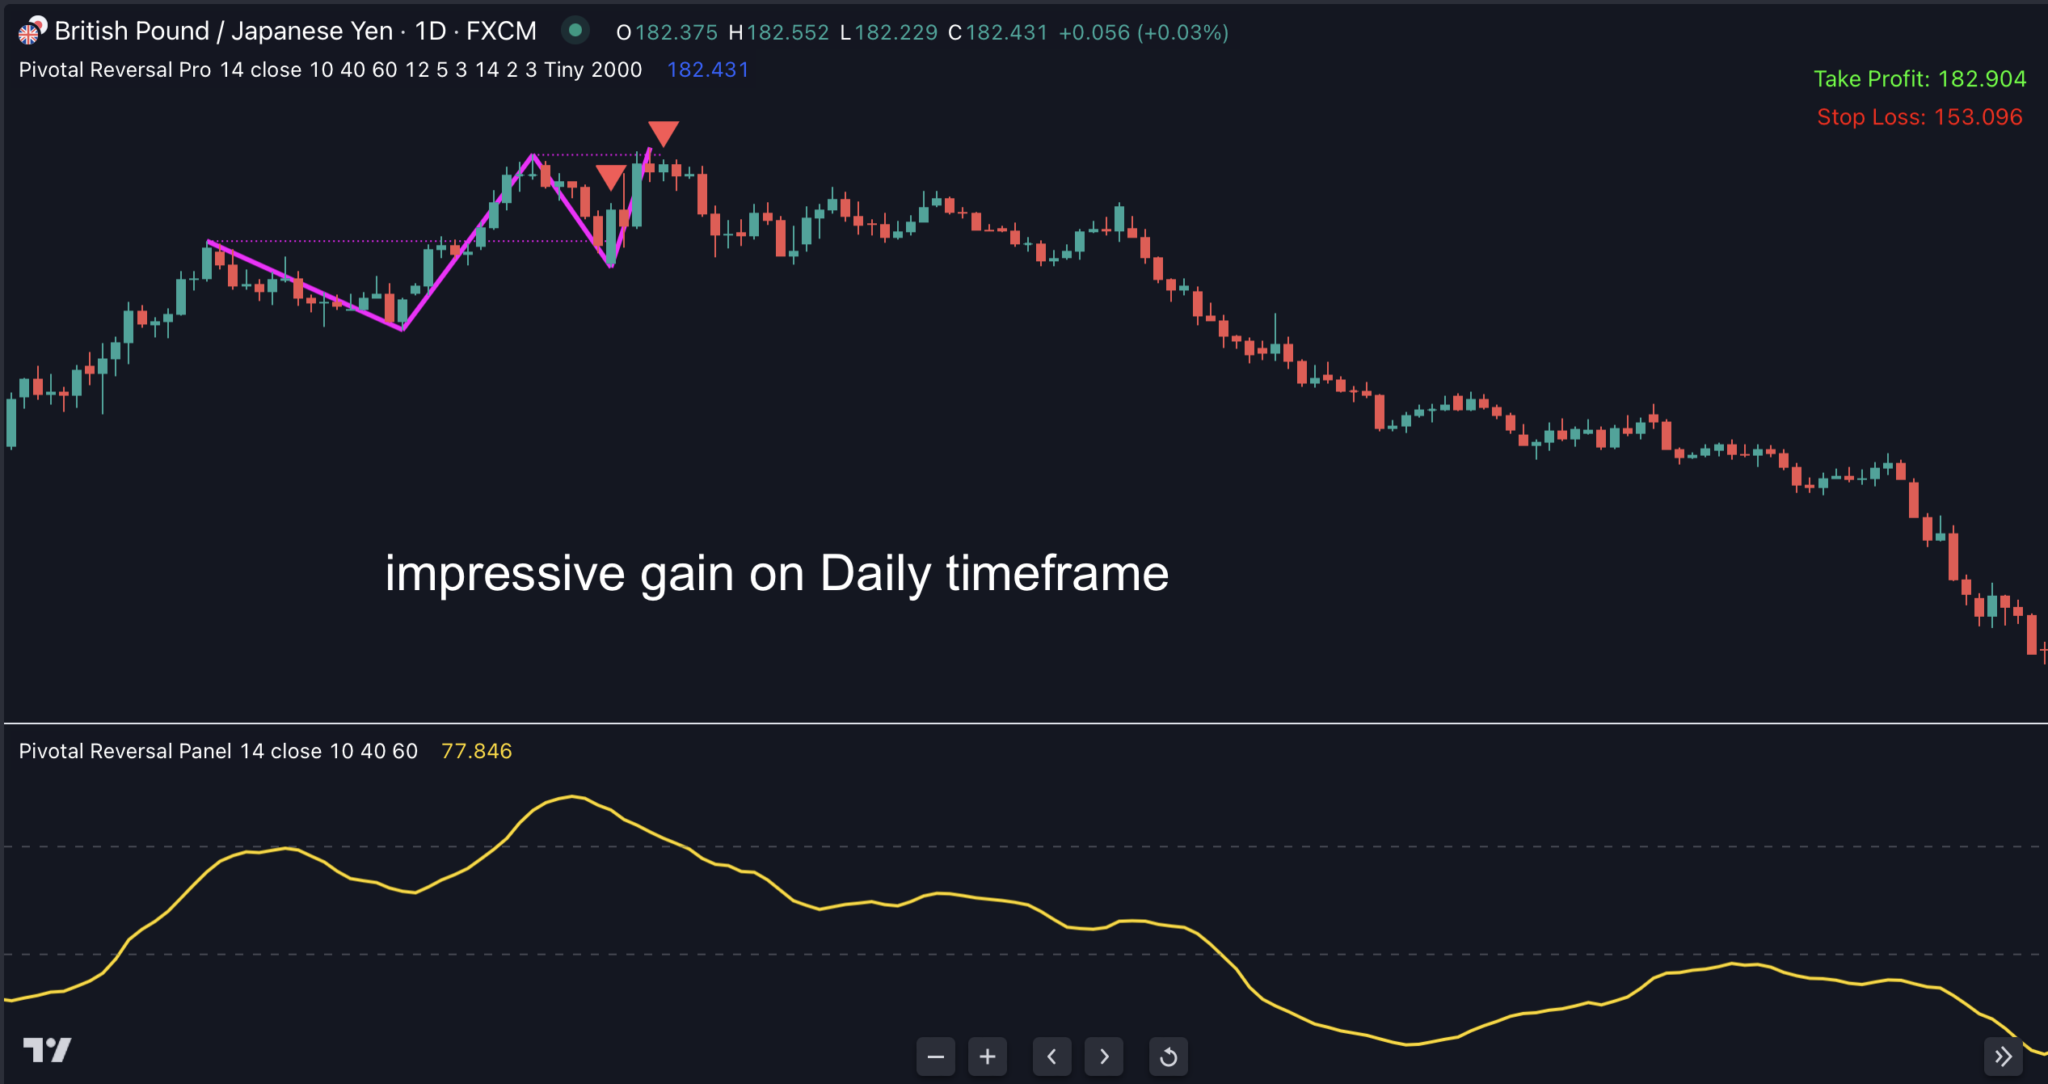
✔️ The ultimate pivot trading solution for veterans & beginners…
✔️ Entries, stop loss and TRUE exit points designed for potentially HUGE winners!
Setting Manuals
- Indicator Setting:
Please note that there are 2 parts to this product: Pivotal Reversal and Pivotal Reversal Panel. Please add them both from your Invite-only scripts.
2.1 Pivotal Reversal
RSI Period: Determines the lookback period for the Relative Strength Index calculation, impacting the indicator’s responsiveness to price changes.
RSI Applied Price: Specifies which price (close, open, high, low) the Relative Strength Index should be calculated on, allowing for customized sensitivity to market movements.
RSI Smoothing Period: Sets the smoothing period for the RSI, reducing volatility and smoothing out the RSI line for clearer signal interpretation.
Smoothed RSI Bullish Signal Threshold Level: Sets the RSI level above which the market is considered to be in a potential bullish state, indicating possible entry points for long trades.
Smoothed RSI Bearish Signal Threshold Level: Sets the RSI level below which the market is considered to be in a potential bearish state, indicating possible entry points for short trades.
ZigZag Depth: Adjusts the minimum price movement required to form a new leg in the ZigZag pattern, affecting the indicator’s sensitivity to market changes.
ZigZag Deviation: Sets the percentage deviation needed for the ZigZag to reverse, influencing how significant a price move must be to alter the course of the ZigZag pattern.
ZigZag Backstep: Specifies the minimum number of bars between highs and lows in the ZigZag pattern, ensuring clarity in trend direction and reversals.
SL & TP
ATR Period for SL Shift: Determines the lookback period for the Average True Range, used in calculating the shift for the stop-loss level.
SL Shift Coefficient (from ATR): Defines the multiplier applied to the ATR to calculate the stop-loss distance from the entry point, offering a dynamic risk management tool based on market volatility.
TP Coefficient (from SL): Sets the ratio between the take-profit and the stop-loss levels, enabling strategic and proportionate profit targets relative to risk.
STYLING
Bullish Pattern Color: Specifies the color used to highlight bullish patterns or signals on the chart, improving visual differentiation of buying opportunities.
Bearish Pattern Color: Specifies the color used to highlight bearish patterns or signals on the chart, improving visual differentiation of buying opportunities.
Up Arrow Color: Selects the color of upward-pointing arrows, indicating bullish signals or entry points.
Down Arrow Color: Selects the color of downward-pointing arrows, indicating bearish signals or potential short entries.
Up/Down Arrow Size: Adjusts the size of the up and down arrows on the chart, ensuring that they are clearly visible according to user preference.
Display TP/SL on Chart: Toggles the visibility of take-profit and stop-loss levels directly on the chart for easy reference and trade management.
TP Color: Sets the color for illustrating take-profit levels on the chart, aiding in quick identification of profit targets.
SL Color: Sets the color for illustrating stop-loss levels, facilitating immediate recognition of risk management thresholds.
Max Bars to Calculate: Specifies the maximum number of bars over which the indicator performs its calculations, optimizing performance and focusing analysis on the most relevant data.
1..1 Pivotal Reversal Panel
RSI Period: Sets the number of bars used to calculate the Relative Strength Index, affecting the indicator’s general sensitivity to price movements.
RSI Applied Price: Chooses the price component (close, open, high, low) used in the RSI calculation, tailoring the indicator’s response to specific price action.
RSI Smoothing Period: Determines the smoothing applied to the RSI calculation, reducing short-term fluctuations and highlighting longer-term trends or reversals.
Smoothed RSI Bullish Signal Threshold Level: Specifies the threshold above which the smoothed RSI indicates bullish market conditions, suggesting potential buying opportunities.
Smoothed RSI Bearish Signal Threshold Level: Specifies the threshold below which the smoothed RSI signals bearish market conditions, hinting at possible selling points.
STYLING
Line Color: Selects the color of the indicator’s line on the chart, enhancing visual clarity and personalizing the display to fit the trader’s preferences.
2. How can I set up alerts?
To stay updated on potential trading opportunities, you can set up alerts within the Pivotal Reversal Pro.
Step 1: From the indicator settings, customize your alerts by defining your desired parameters. The selected configurations will be used for notifications in Step 2.
Step 2: To receive notifications through the app, pop-ups, alert emails, Webhook URL, sound alerts, or email-to-SMS, enable these features by clicking on TradingView’s “Alert” icon.
Step 3: Select Pivotal Reversal Pro from the “Condition” dropdown list:
Step 4: A pop-up will appear as follows. You click on “Notifications”.
Step 5: You choose the types of notifications you’d like to receive and click the “Create” button.
FAQ
After purchasing, you’ll fill out a short form that asks for your Tradingview username. And then, we’ll grant your username access to all our indicators within 24 hours.
It works on ALL markets internationally that are available on Tradingview: FX, stocks, indices, commodities, futures, etc…
All sales are final and non-refundable.
TV CHAMP MEMBERSHIP
Join our exclusive TV Champ membership and grab ALL our custom indicators for Tradingview. To see the full list of all indicators included in the TV Champ membership, click here…
Platform: TradingView
Our Customer Feedback
Don’t take our word for it, read our customers’ testimonials from Trustpilot.com
4.2