People often ask us how professional traders predict the direction of an asset’s movement. This question is frequently asked by both novice traders and those who closely follow the finance industry.
One of the most common techniques that Wall Street traders employ to forecast the movement of an asset is chart analysis.
In recent months, we have written extensively about charting and technical indicators, examining popular indicators like the Relative Strength Index, Momentum indicator, and Bollinger Bands in Technical Analysis Of Stock Trends For Beginners and Forex Day Trading: Tips, Strategies and Indicators. You can check it out now!
While these tools are widely used by traders, today we will explore a less popular tool known as the Zig Zag Indicator.
Table of Contents
1. What Is The Zig Zag Indicator?
The Zig Zag indicator is a useful trading tool that connects significant market lows and highs. Despite its value, this indicator is not as widely used by traders, and it is not included as a default feature in most trading platforms, including MetaTrader. Therefore, traders must install it from the marketplace.
Fortunately, adding this indicator to your trading platform is a simple process. If you are using MetaTrader, you can visit the code base, search for the Zig Zag indicator, download it, and then apply it to your chart.
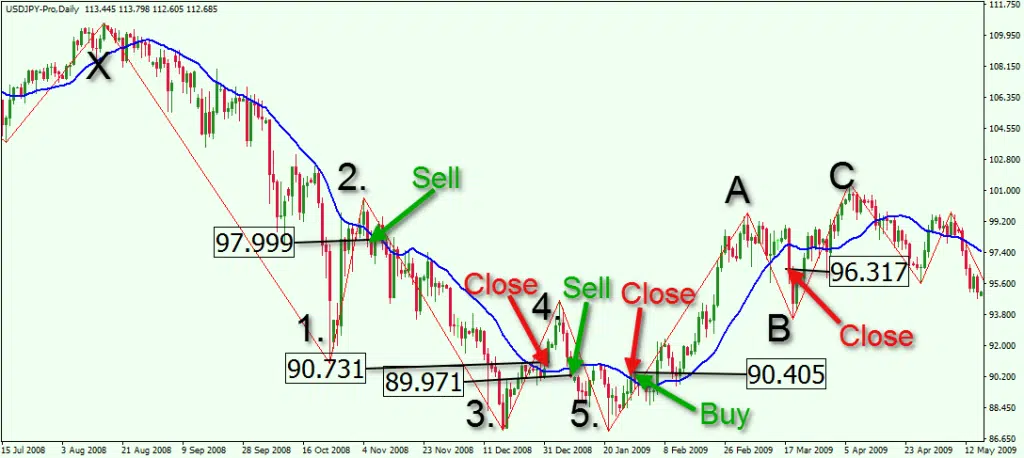
Once you have installed the Zig Zag indicator, you will notice a red line connecting market lows and highs, as demonstrated on the chart below.
2. The Three Zig Zag Indicator Settings
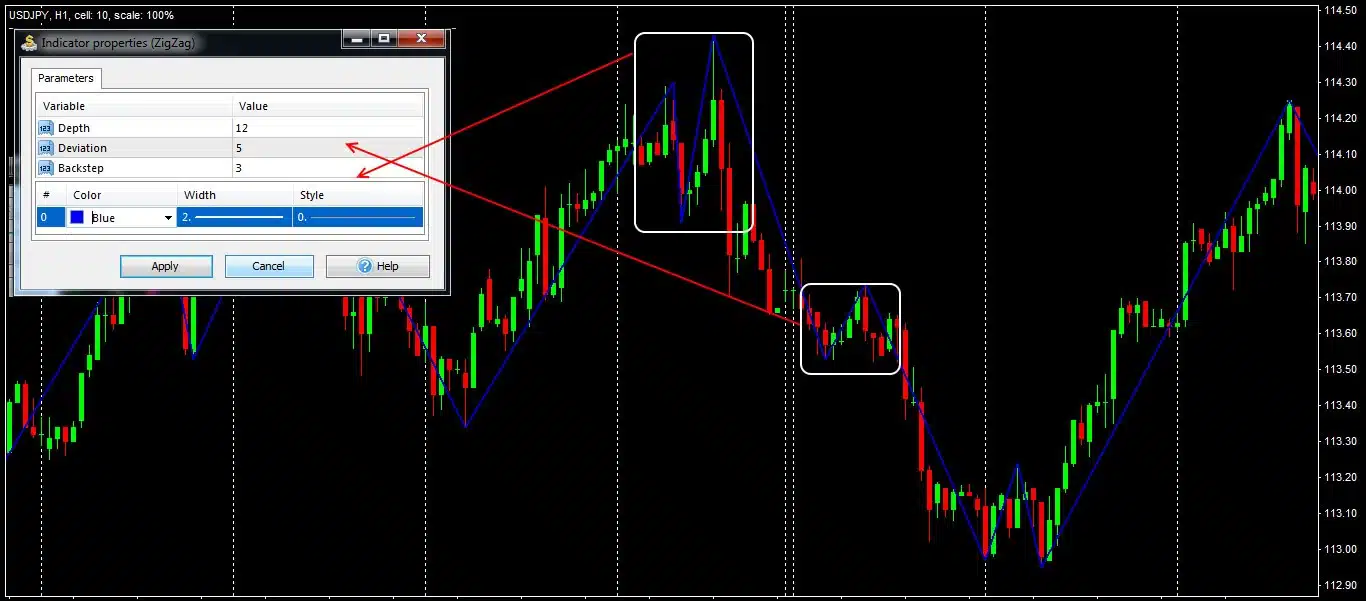
The Zig Zag indicator has three adjustable settings, namely depth, deviation, and backstep. By default, the values for these settings are 12, 5, and 3, respectively, all of which are expressed in percentages. However, traders can adjust these settings to fit their trading strategy and preferences.
One key setting that can impact the appearance of the Zig Zag line is the deviation setting. Increasing the deviation will spread the lines out more noticeably. For instance, in the chart below, the same market data is displayed as in the previous chart, but with the deviation increased to 10.
2.1. What Do These Numbers Mean?
The deviation setting of the Zig Zag indicator refers to the minimum percentage difference between the highs and lows of adjacent candlesticks. Specifically, this setting ignores price movements that are less than the specified percentage. In the default setting, this value is 5%.
The depth setting represents the minimum number of consecutive candlesticks in which the Zig Zag line must not reach either a new high or a new low before a new peak or trough is established. Essentially, this setting helps to identify significant market movements.
Lastly, the backstep setting refers to the minimum number of candlesticks required between the highs and lows used to establish a peak or trough in the Zig Zag line. This setting helps to smooth out the line and avoid false signals.
3. When You Should Include The Zig Zag Indicator In Your Trading Strategy
The Zig Zag indicator is a valuable tool used by traders for several purposes, including:
- Identifying significant market swings – The primary function of the Zig Zag indicator is to identify significant tops and bottoms in the market. A top position indicates a good time to sell or short a security, while a bottom position indicates a good time to buy or go long.
- ElliottElliot Wave Analysis – Another important technique used by traders is ElliottElliot Wave Analysis, which posits that the price of an asset moves in five motive waves and three corrective waves. The Zig Zag indicator is an essential tool for identifying these positions.
- Identifying entry and exit points – Traders can use the Zig Zag indicator to determine entry and exit points for trades.
- Confirmation of trends – The Zig Zag indicator can also be used in combination with other indicators to confirm trends in the market. By analyzing the Zig Zag line alongside other technical indicators, traders can gain a more comprehensive understanding of market movements.
3.1. How To Use It
There are various ways to use the Zig Zag indicator in trading. One effective approach is to utilize the indicator to identify buy and sell points when the asset is moving within a channel. To accomplish this, traders can apply the Zig Zag indicator and then use the equidistance tool to establish key levels.
Alternatively, traders can manually draw trend lines, as shown in the chart below, to identify levels of support and resistance.
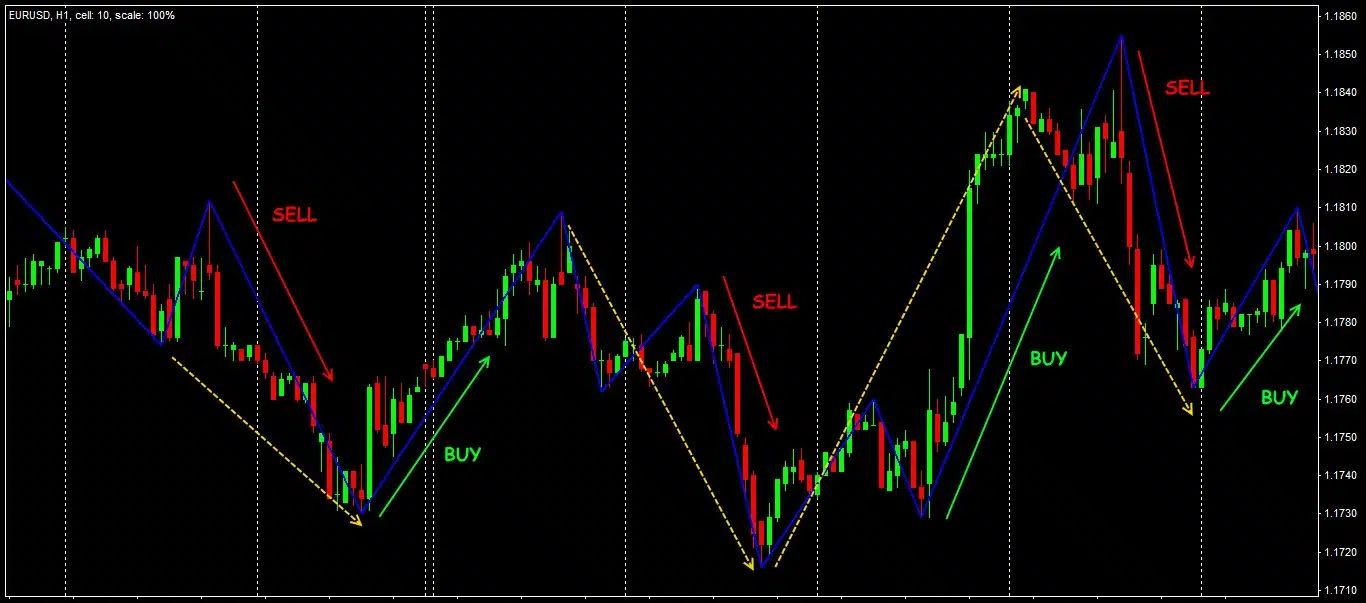
In either case, the goal is to buy when the price reaches the lower Zig Zag level and sell or short when it reaches the upper Zig Zag level. By using this strategy, traders can effectively capitalize on the price movements within the channel.
3.2. Zig Zag and Elliot Wave
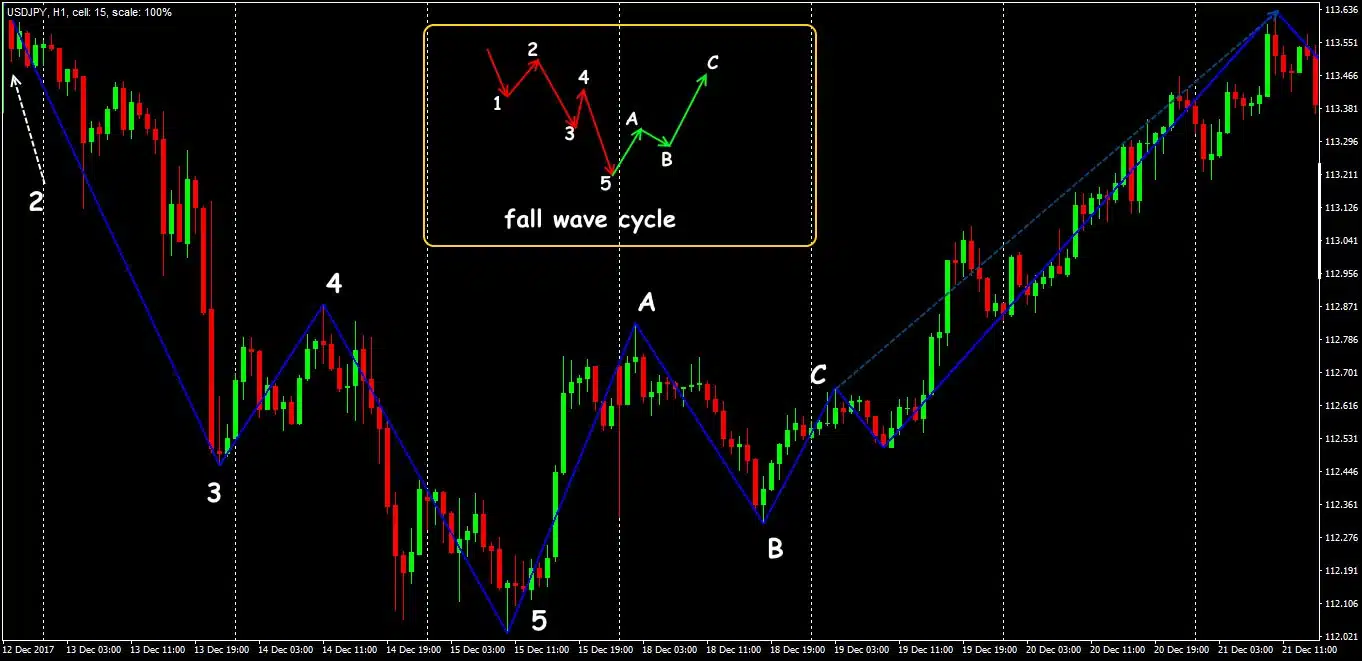
The Zig Zag indicator can also be effectively combined with the Elliot Wave technique, where traders analyze the five impulse waves and apply them to the market. By utilizing the Zig Zag indicator in this approach, traders can identify key areas to place the Elliot wave numbers, as demonstrated in the chart below.
Typically, the first wave is a small rally, followed by a dip and then a significant rally. This is followed by a minor dip and another brief rally. While identifying these movements can be done manually, the Zig Zag indicator helps traders to identify them more quickly and accurately.
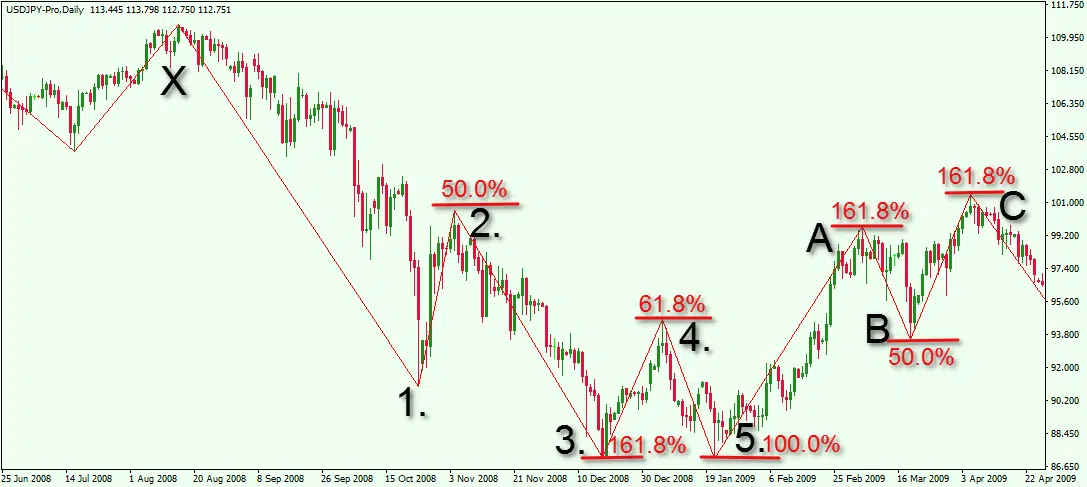
Furthermore, traders often combine the Zig Zag indicator with other tools like Fibonacci retracements and Andrews Pitchfork to further enhance their trading analysis. By using multiple indicators in combination, traders can gain a more comprehensive understanding of market trends and movements.
4. Unleash quick, precise trades with the Anchored Supply Demand Indicator
Built on the foundation of the Zig Zag indicator to find swing highs and lows, the Anchored Supply Demand indicator incorporates that swing point price range data to detect “anchored” supply/demand zones and reversal entries.
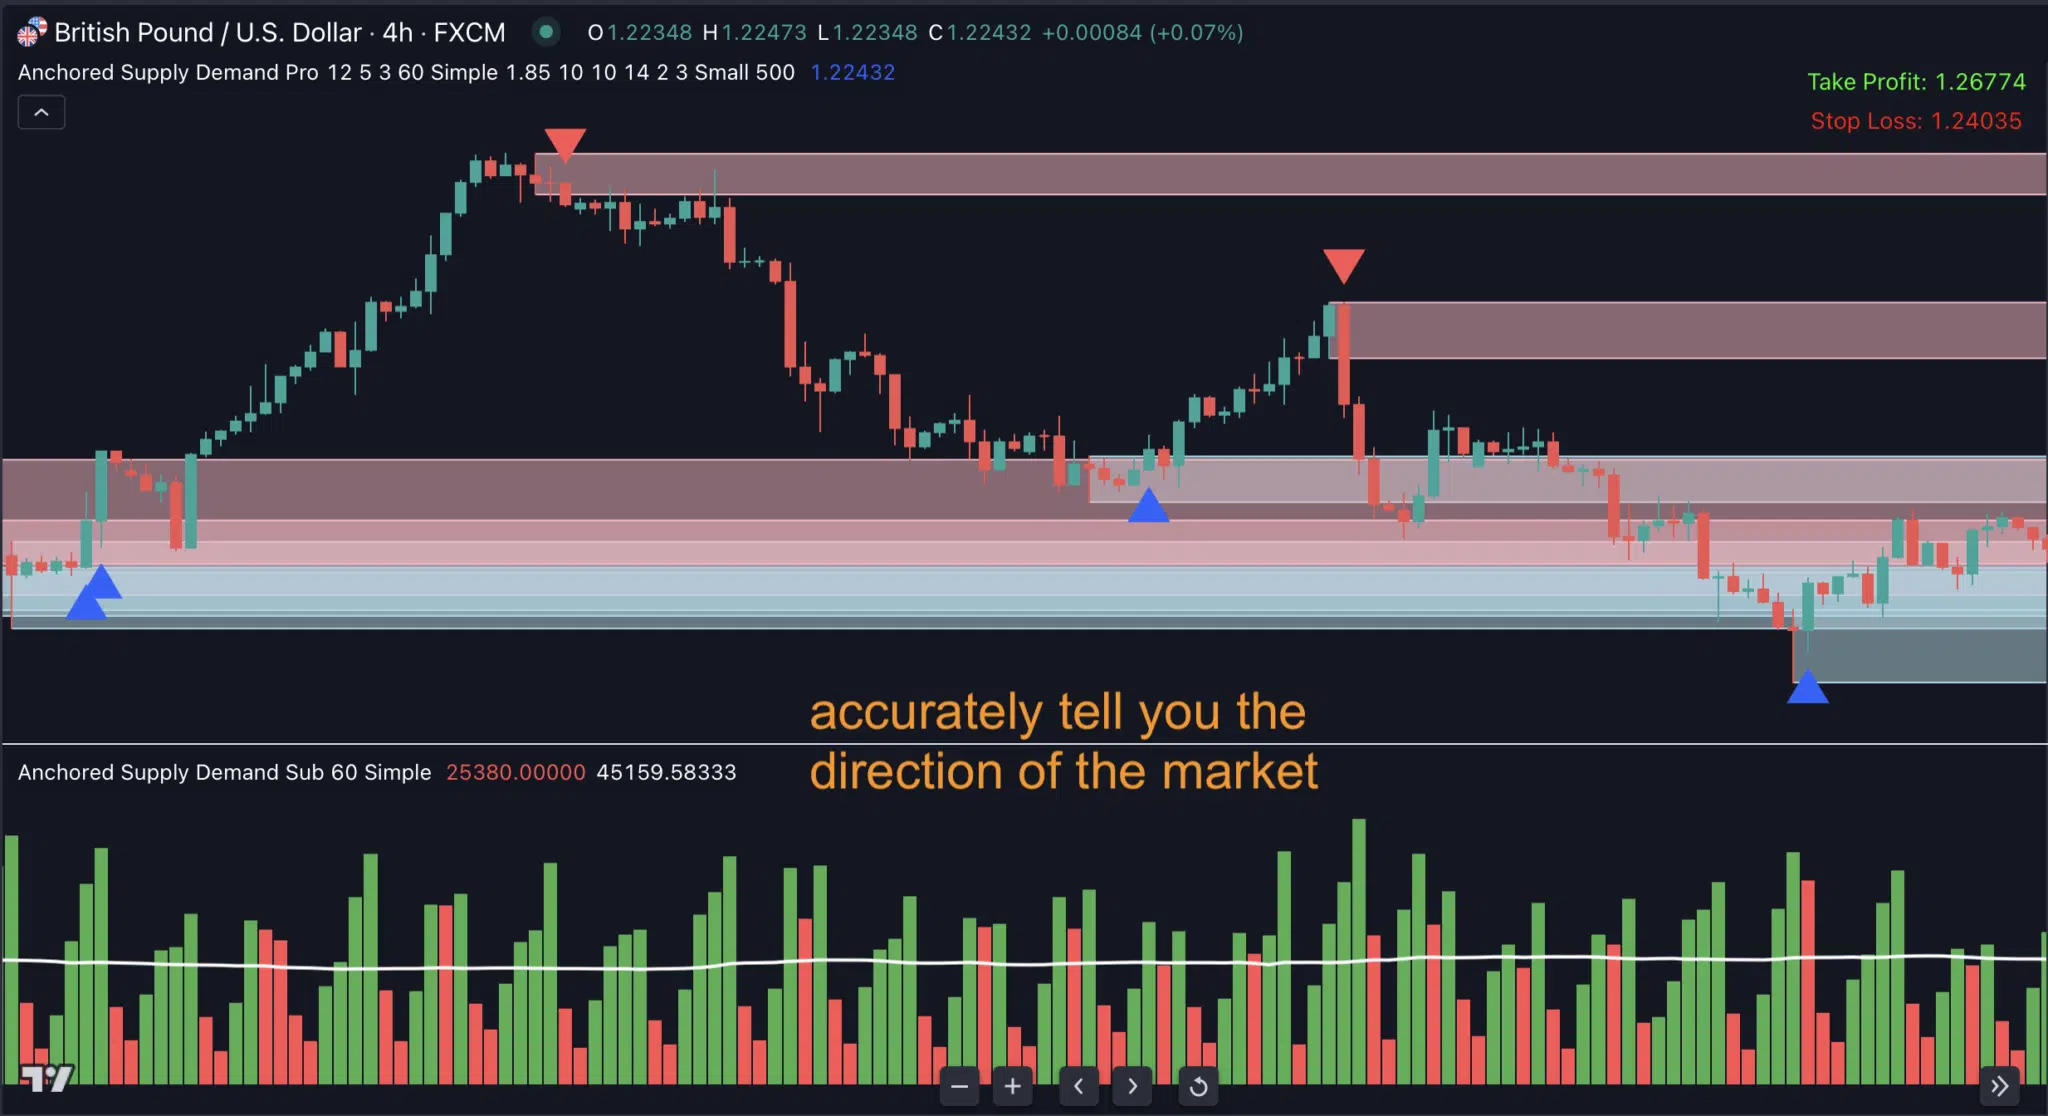
Here are a few of its features, to put it briefly:
- Find “anchored” supply demand zones with precision.
- Pinpoint exact reversal points from the detected zones.
- Identify breakout opportunities with high potential.
If you want to see how the Zig Zag indicator shines as part of the Anchored Supply Demand powerhouse, click here to watch them in action.
Anchored Supply Demand significantly takes the Zig Zag indicator to the next level, and you can expect precise and profitable reversal trade setups to be served in your chart in a blink of an eye.
5. Summary
Although the Zig Zag indicator is relatively unknown to many traders, it is a valuable tool that can benefit your trading strategy. To effectively use this indicator, it is crucial to conduct thorough research and practice using a demo account.
Moreover, it is essential to learn how to combine the Zig Zag indicator with other technical indicators to gain a more comprehensive understanding of market trends and movements. By using multiple indicators in conjunction, traders can develop a more sophisticated trading strategy and make informed trading decisions.
Zig Zag is a strong component of the Anchored Supply Demand indicator, in which it can power the indicator to find strong “anchored” supply/demand zones and reliable reversal trade setups.
In order to make the best decisions, it is important to equip yourself not only with fundamental knowledge but also with supportive tools that can serve as excellent guides.
What do you think? Please feel free to share your comments!
Find this article useful? Share this blog with your friends on social media!