Frequently Bought Together
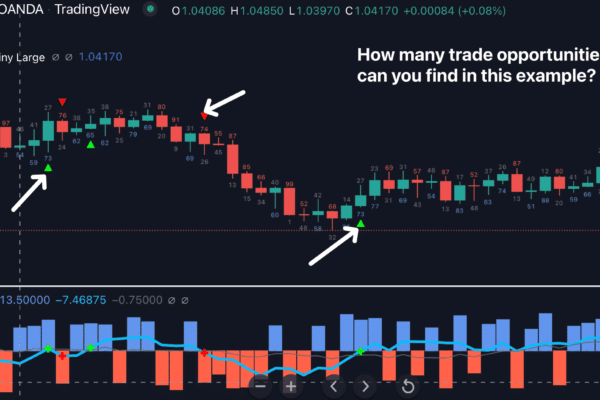
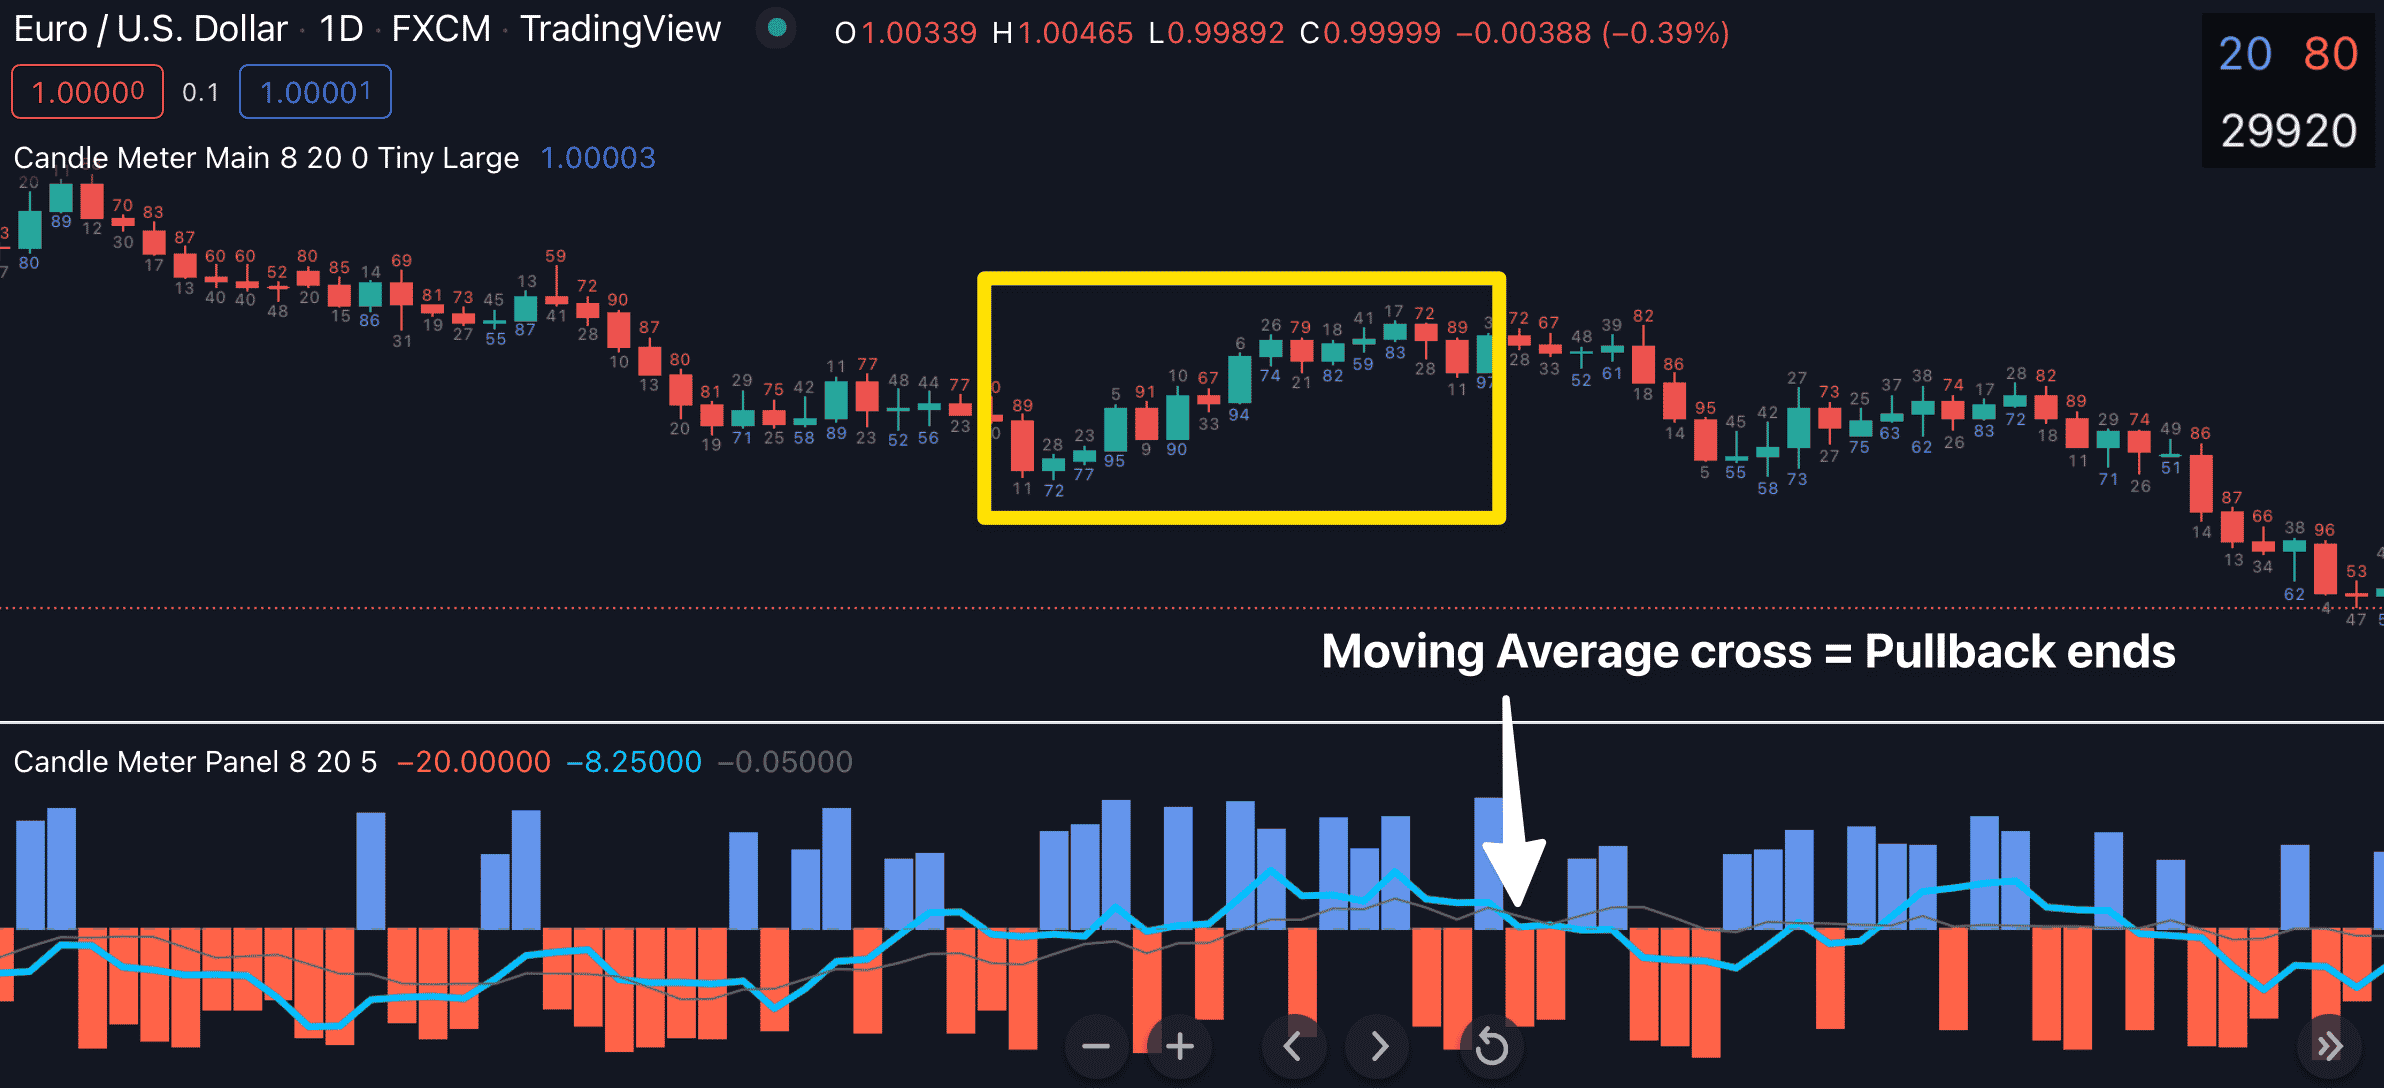
Candle Meter for TradingView
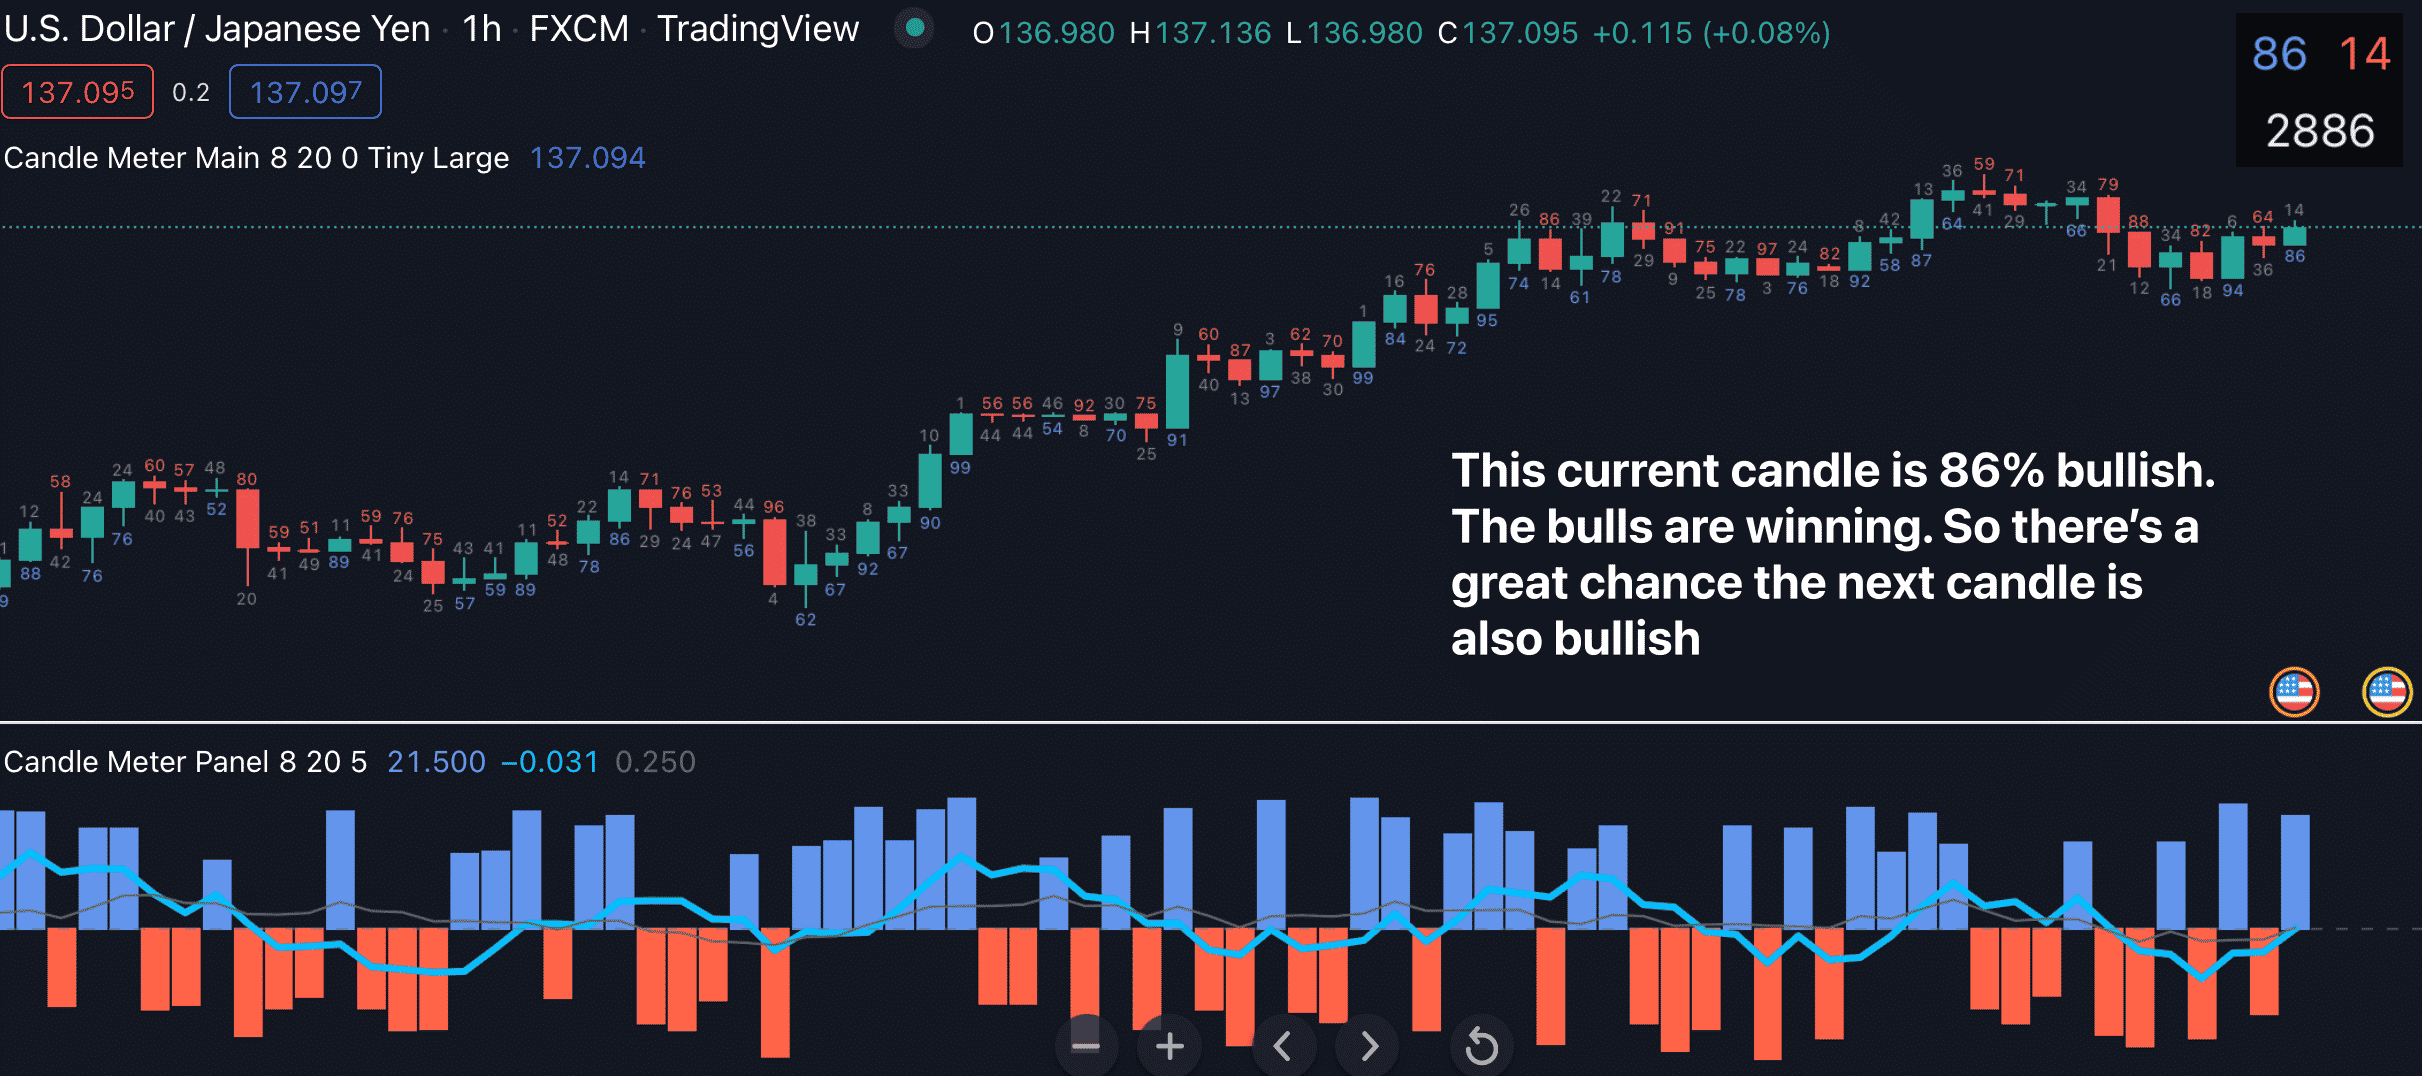
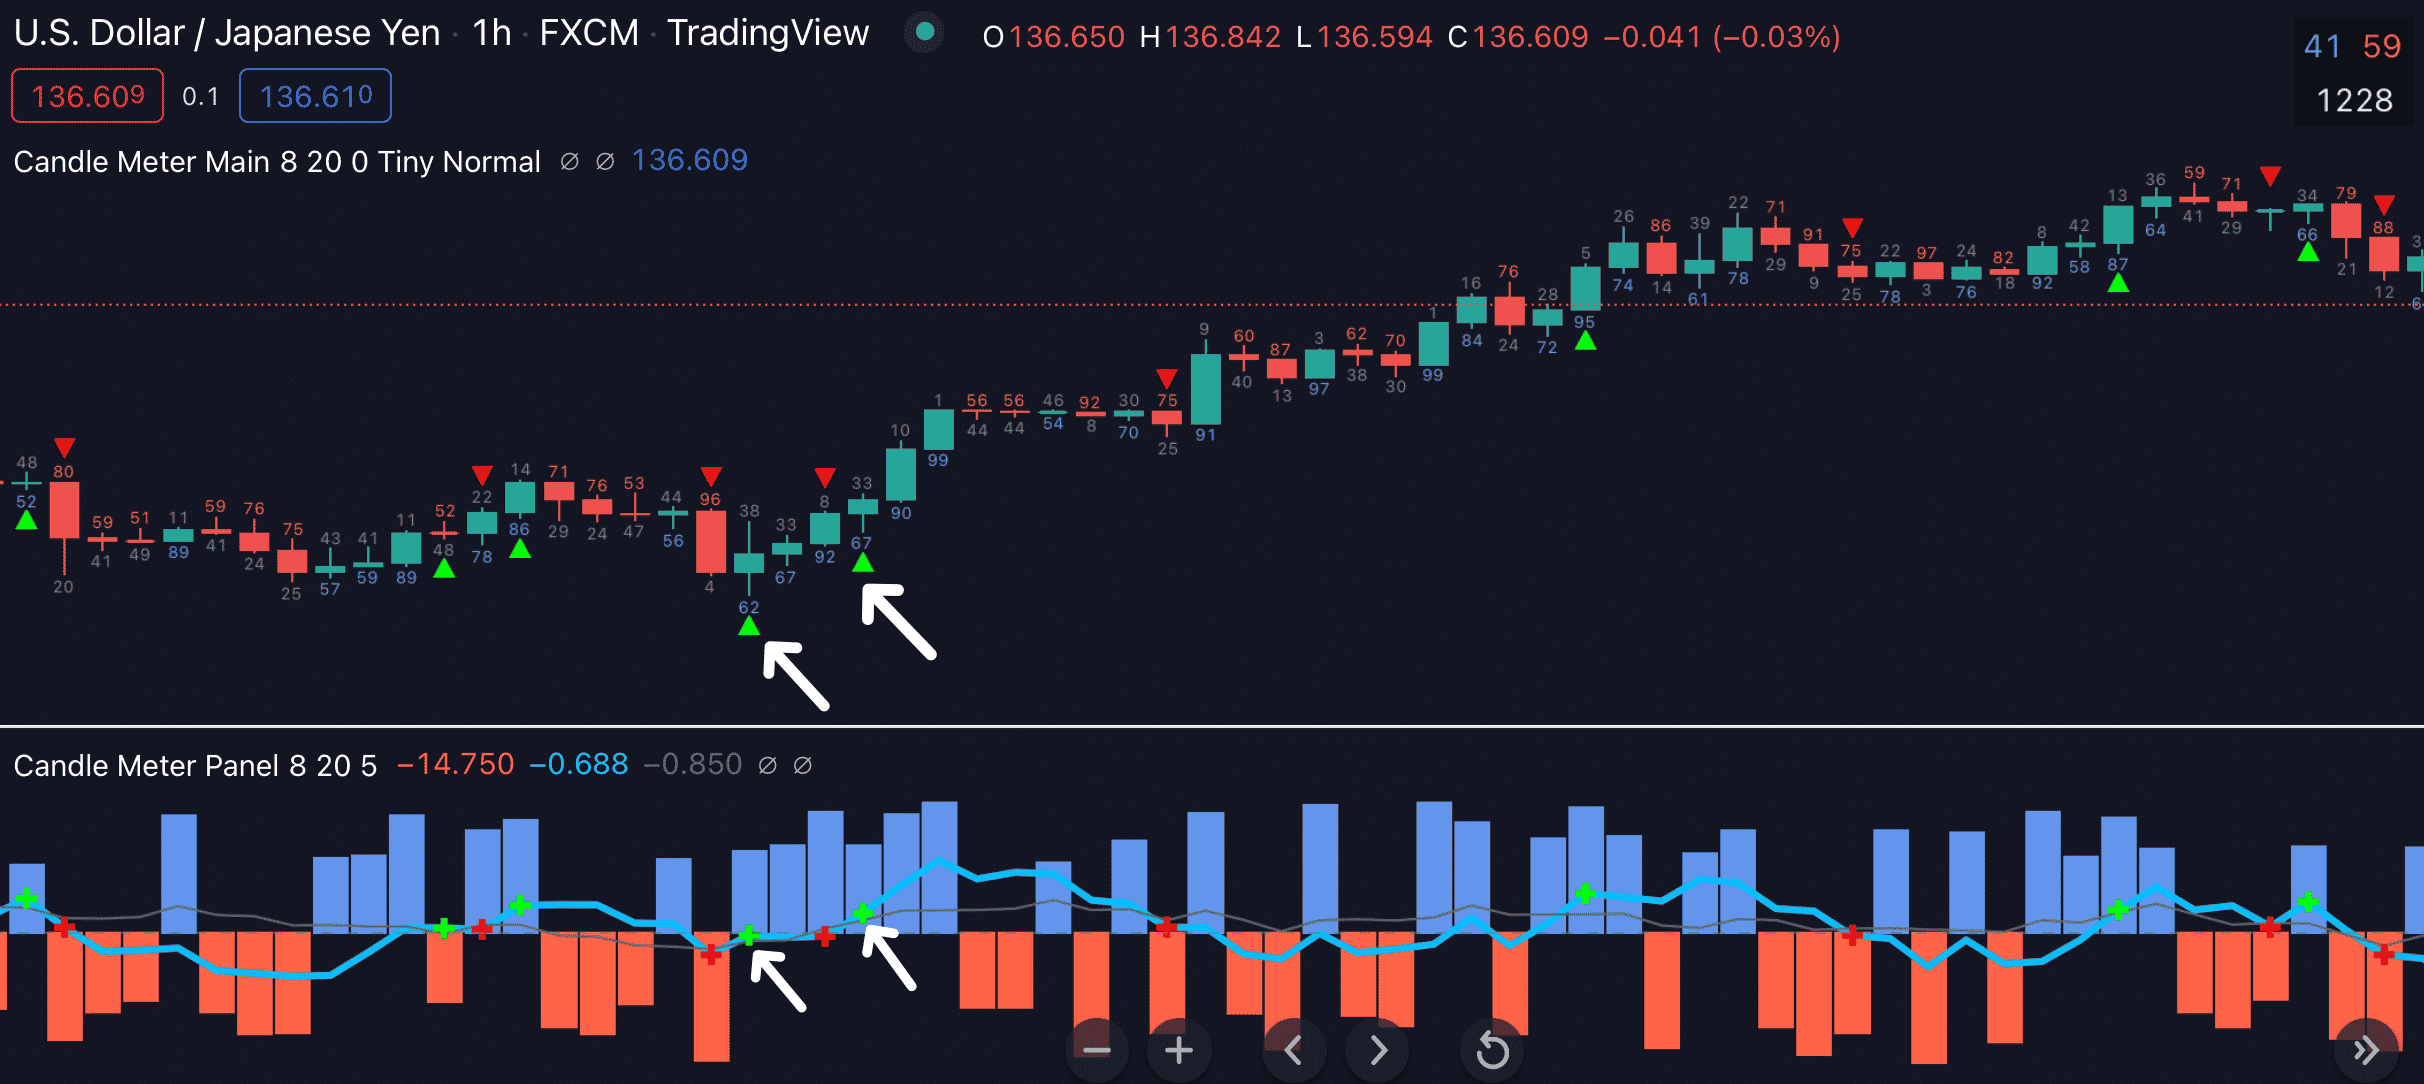
✅ Analyzes the strength of every candle in real time
✅ Tells you whether the bulls or the bears are winning
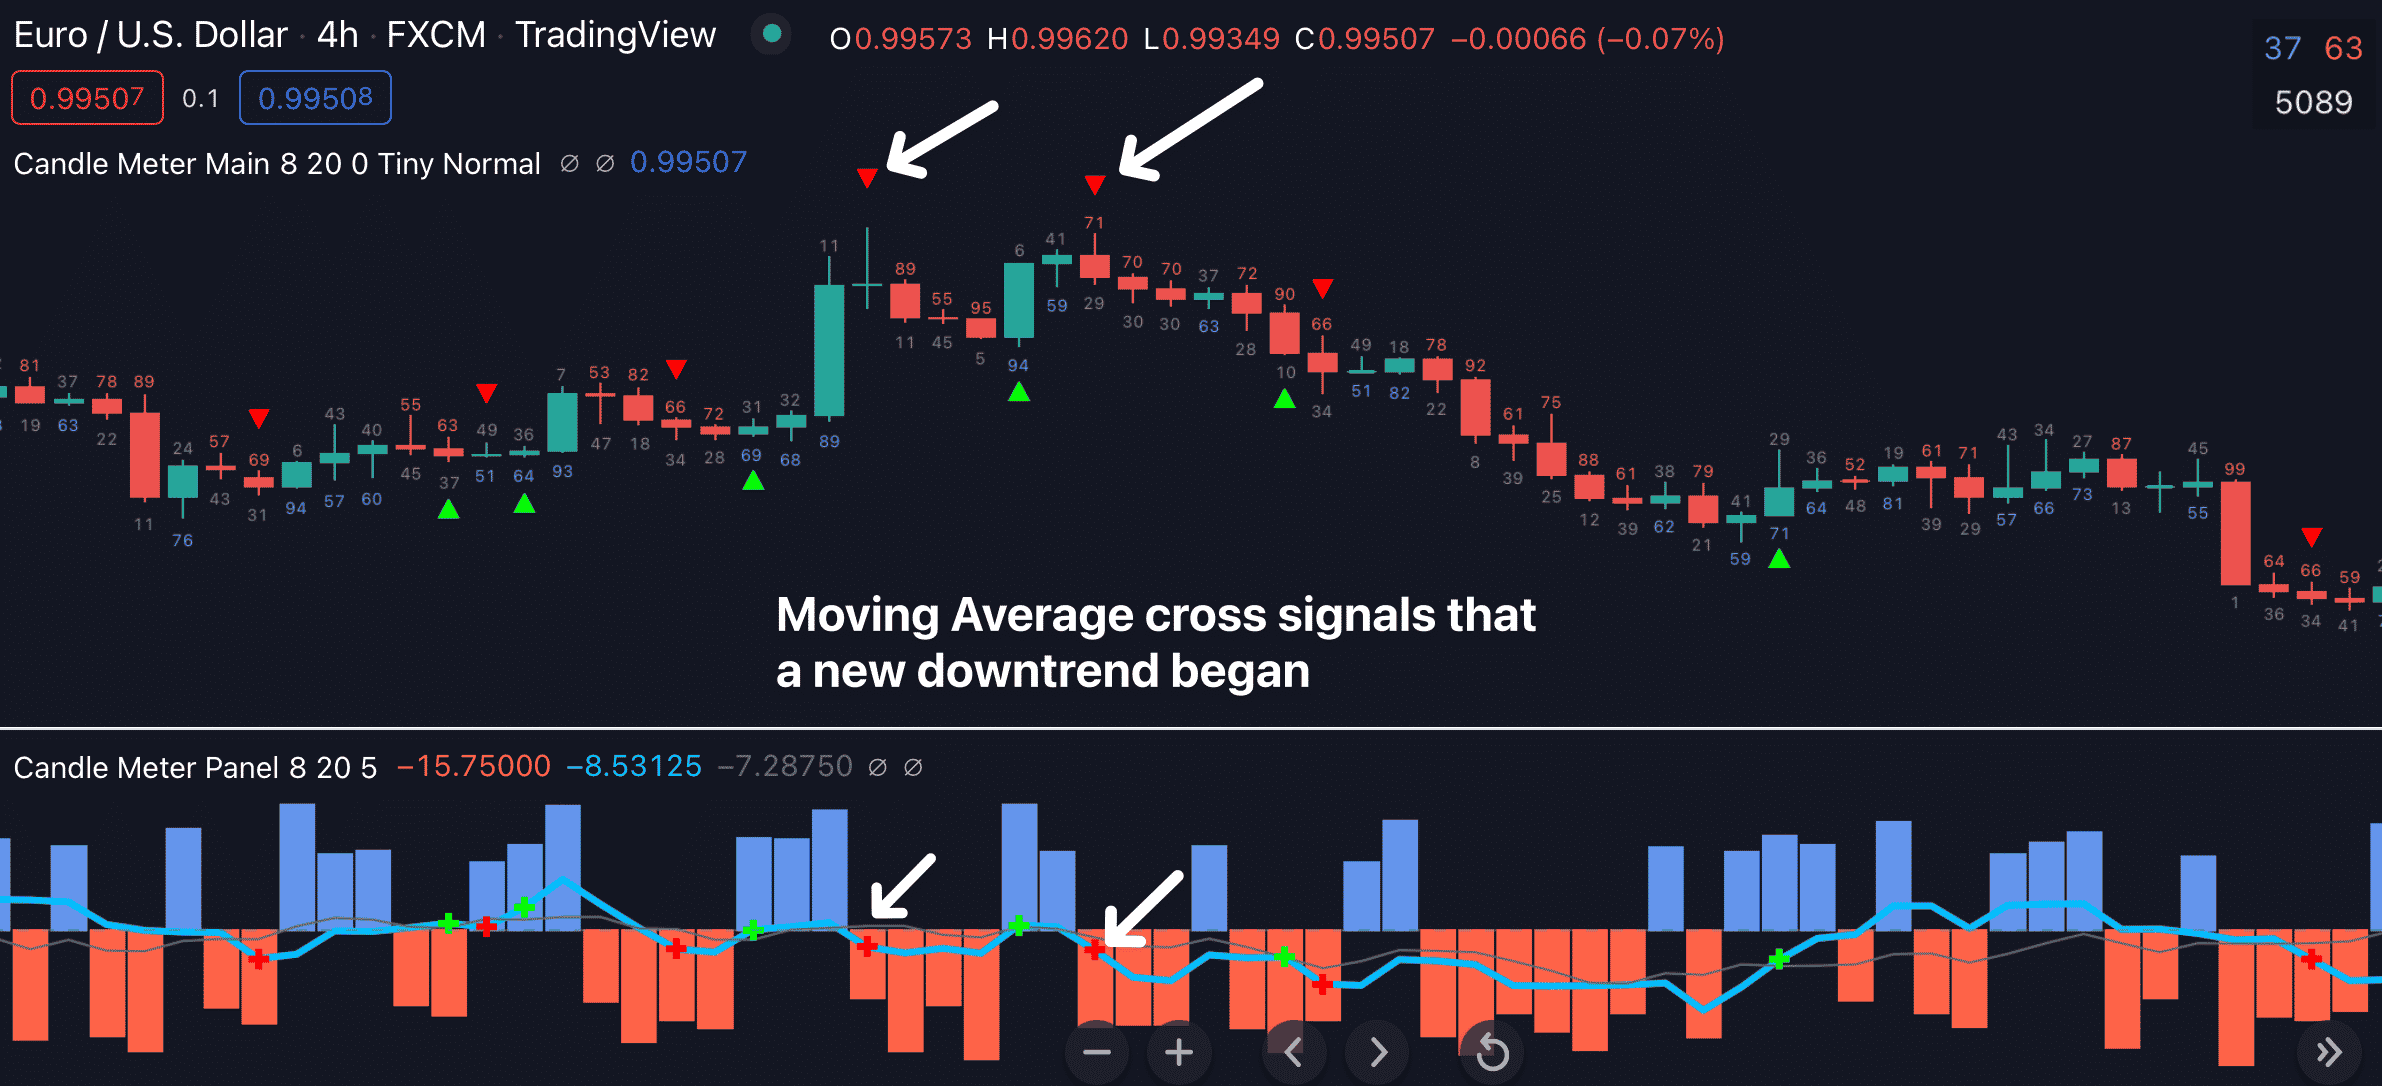
✅ Draws 2 moving averages to identify trends right from the beginning
$299.00

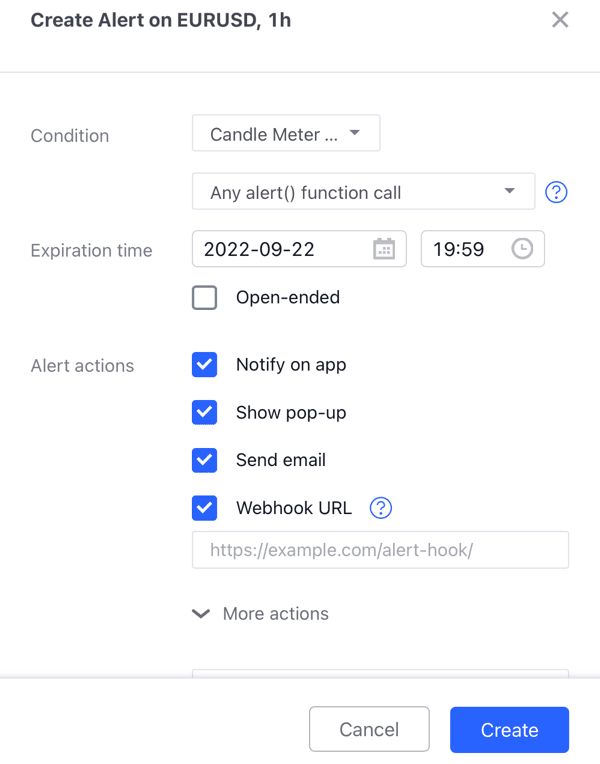
Watch this video guide to see how it works:
Frequently Asked Questions
Customer Reviews
-
-
-
Sale!

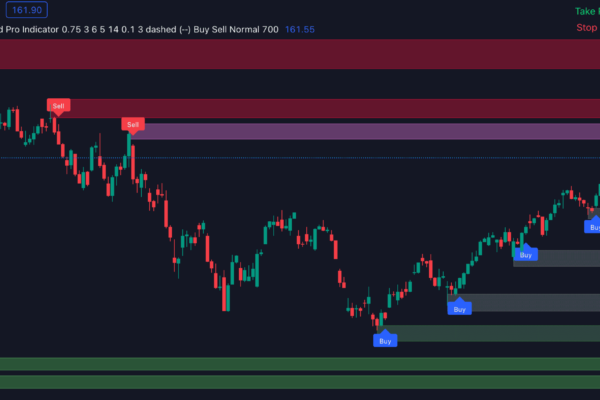
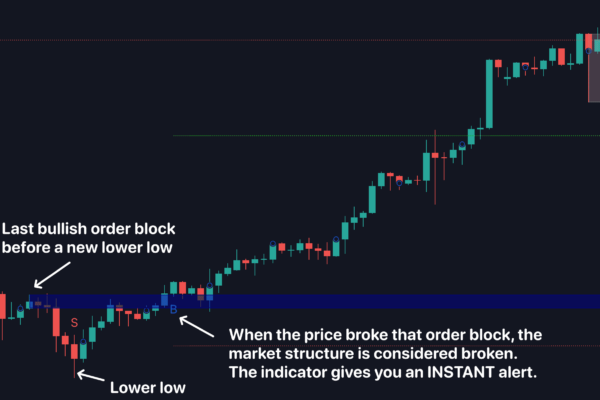
Dynamic Bands for TradingView
Original price was: $299.00.$269.00Current price is: $269.00. -